Financial Report: Performance of Ryanair, EasyJet, and Flybe

Verified

Added on  2020/12/09

|26
|4086
|185
Report
AI Summary
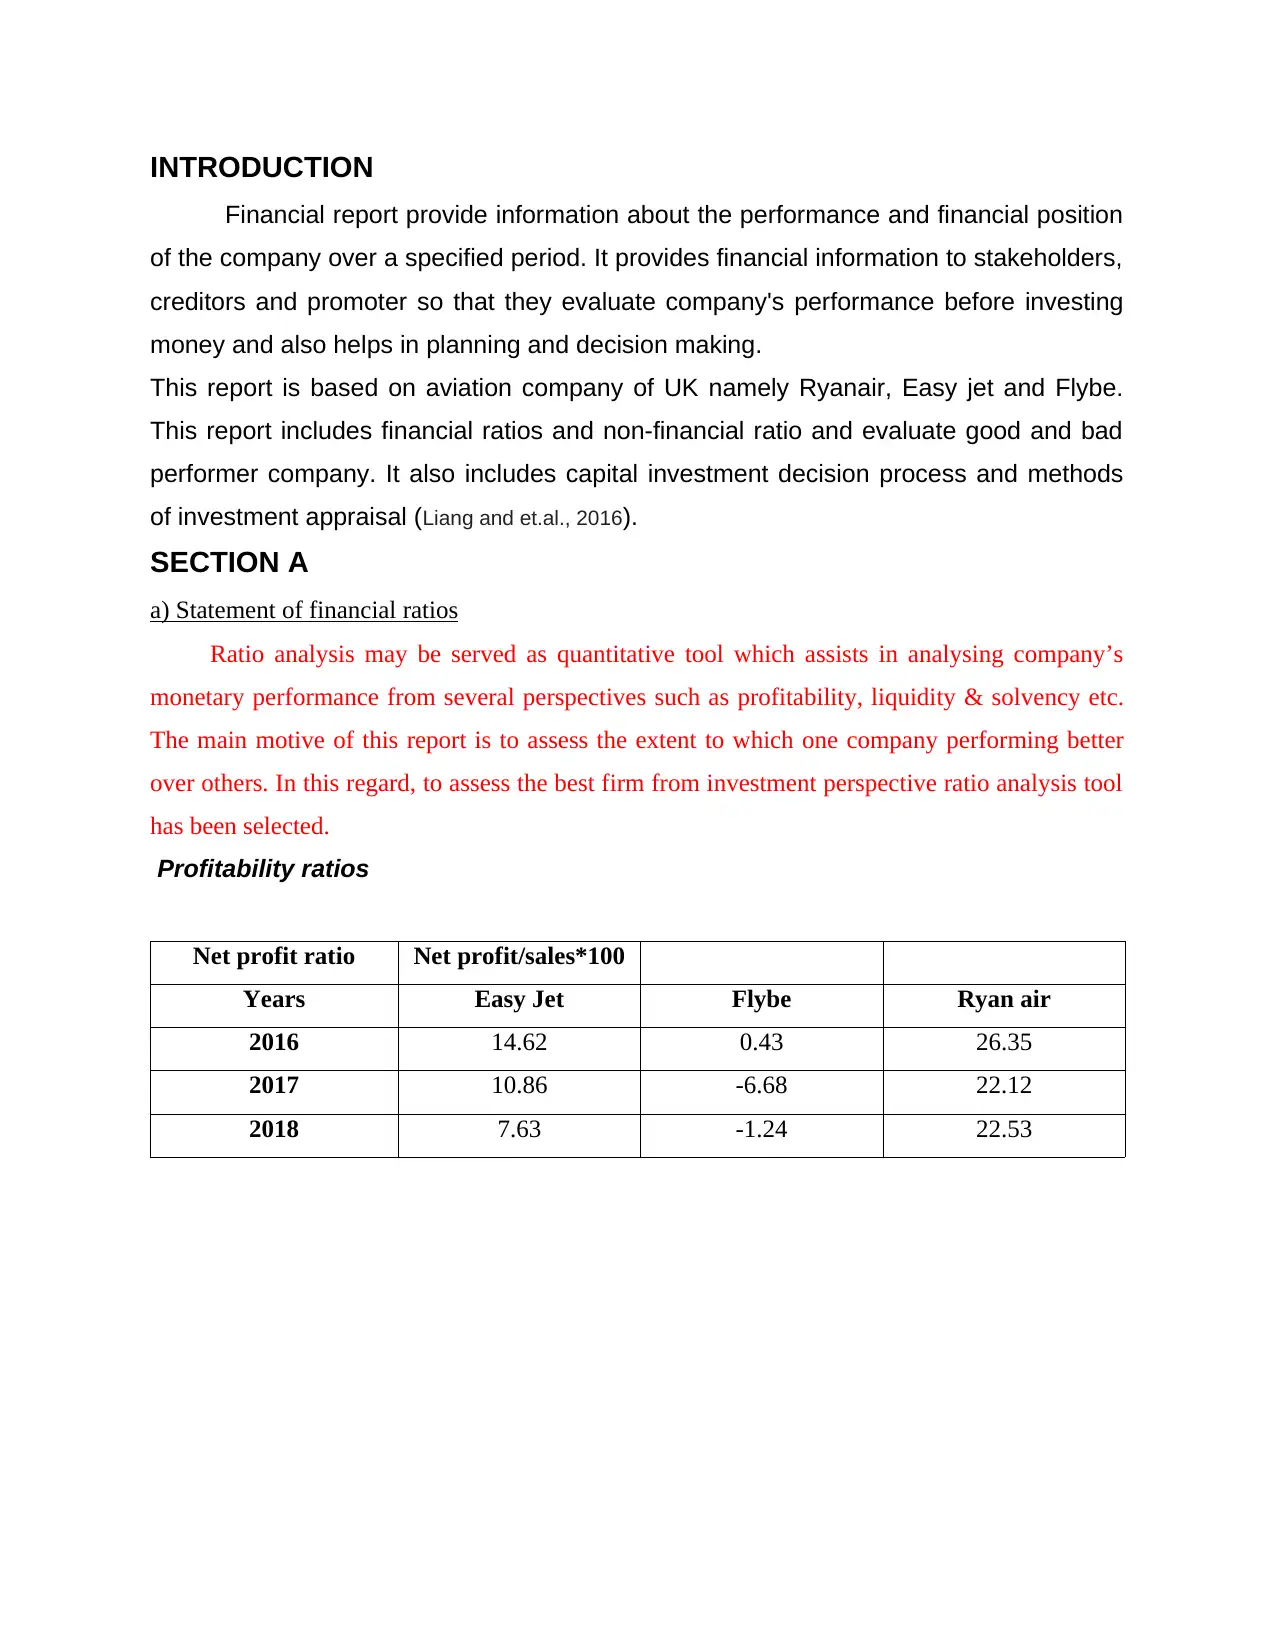
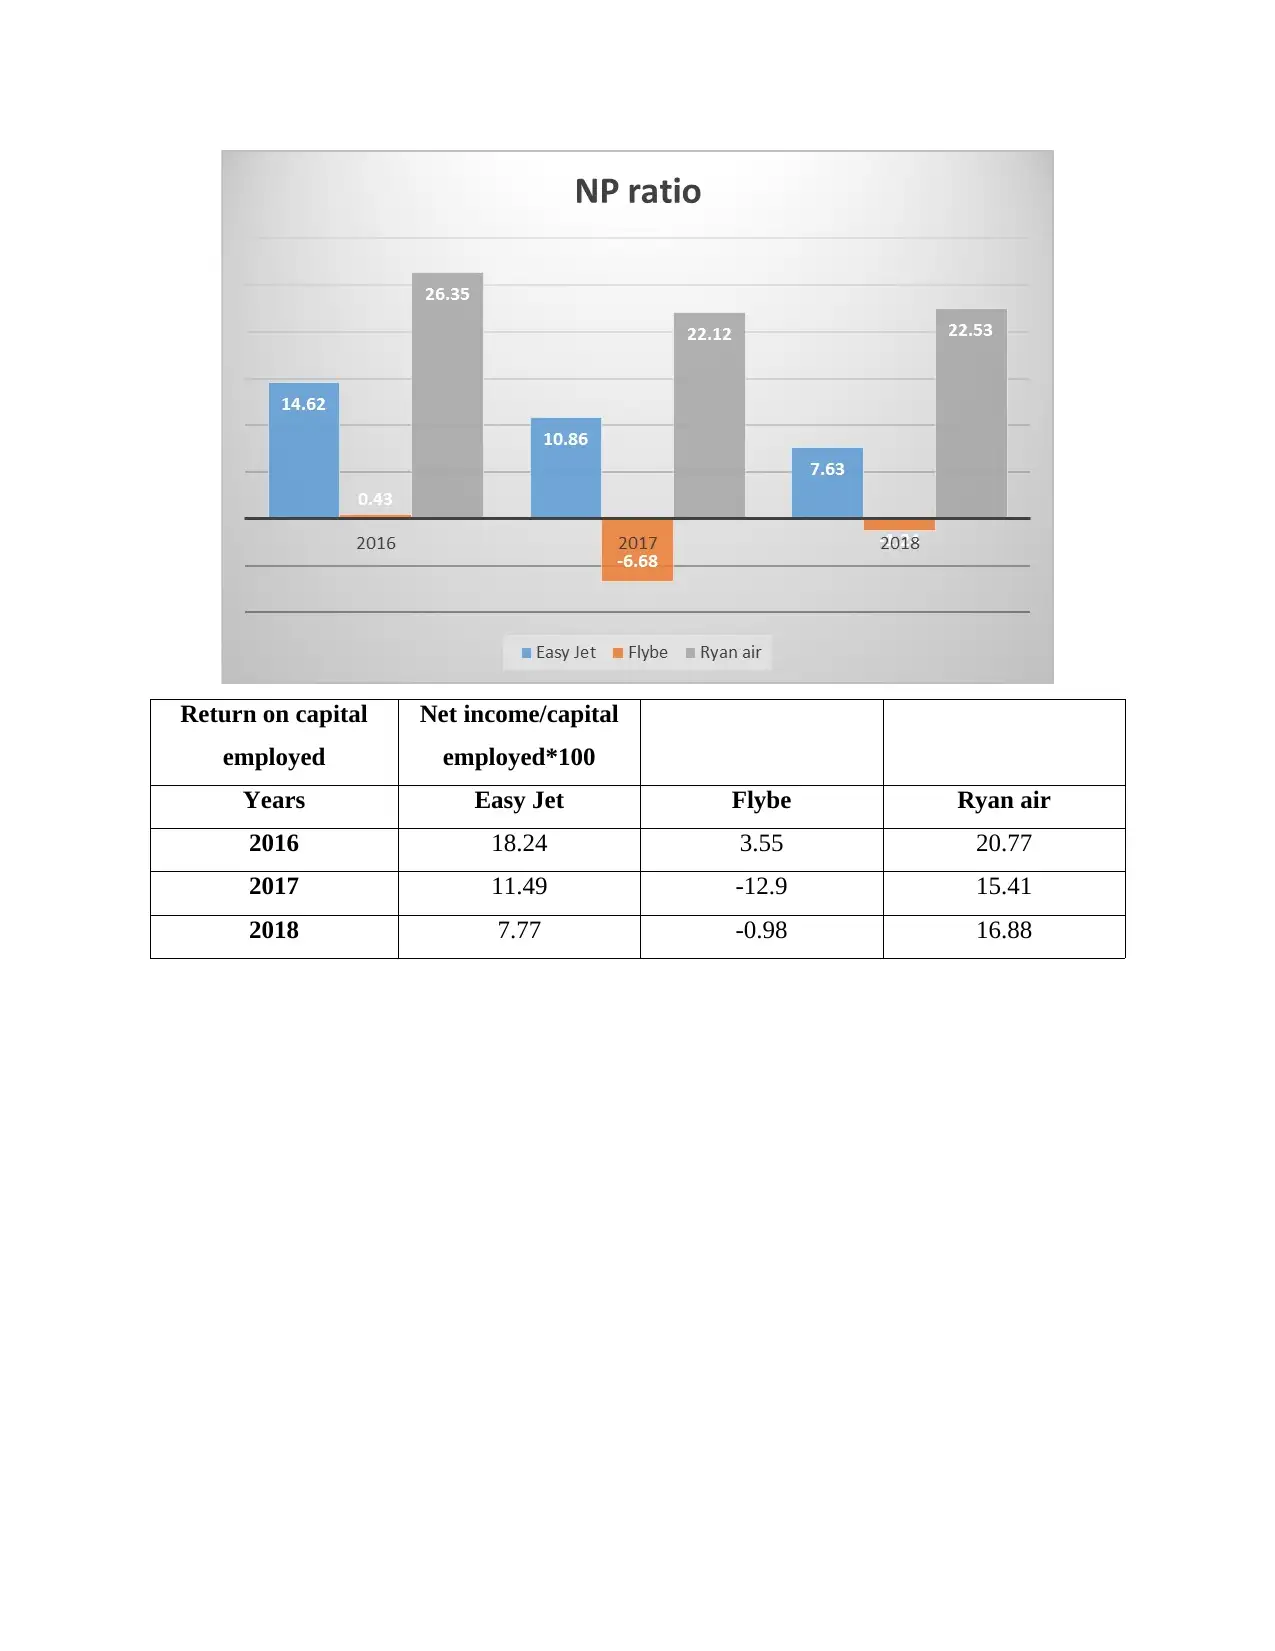
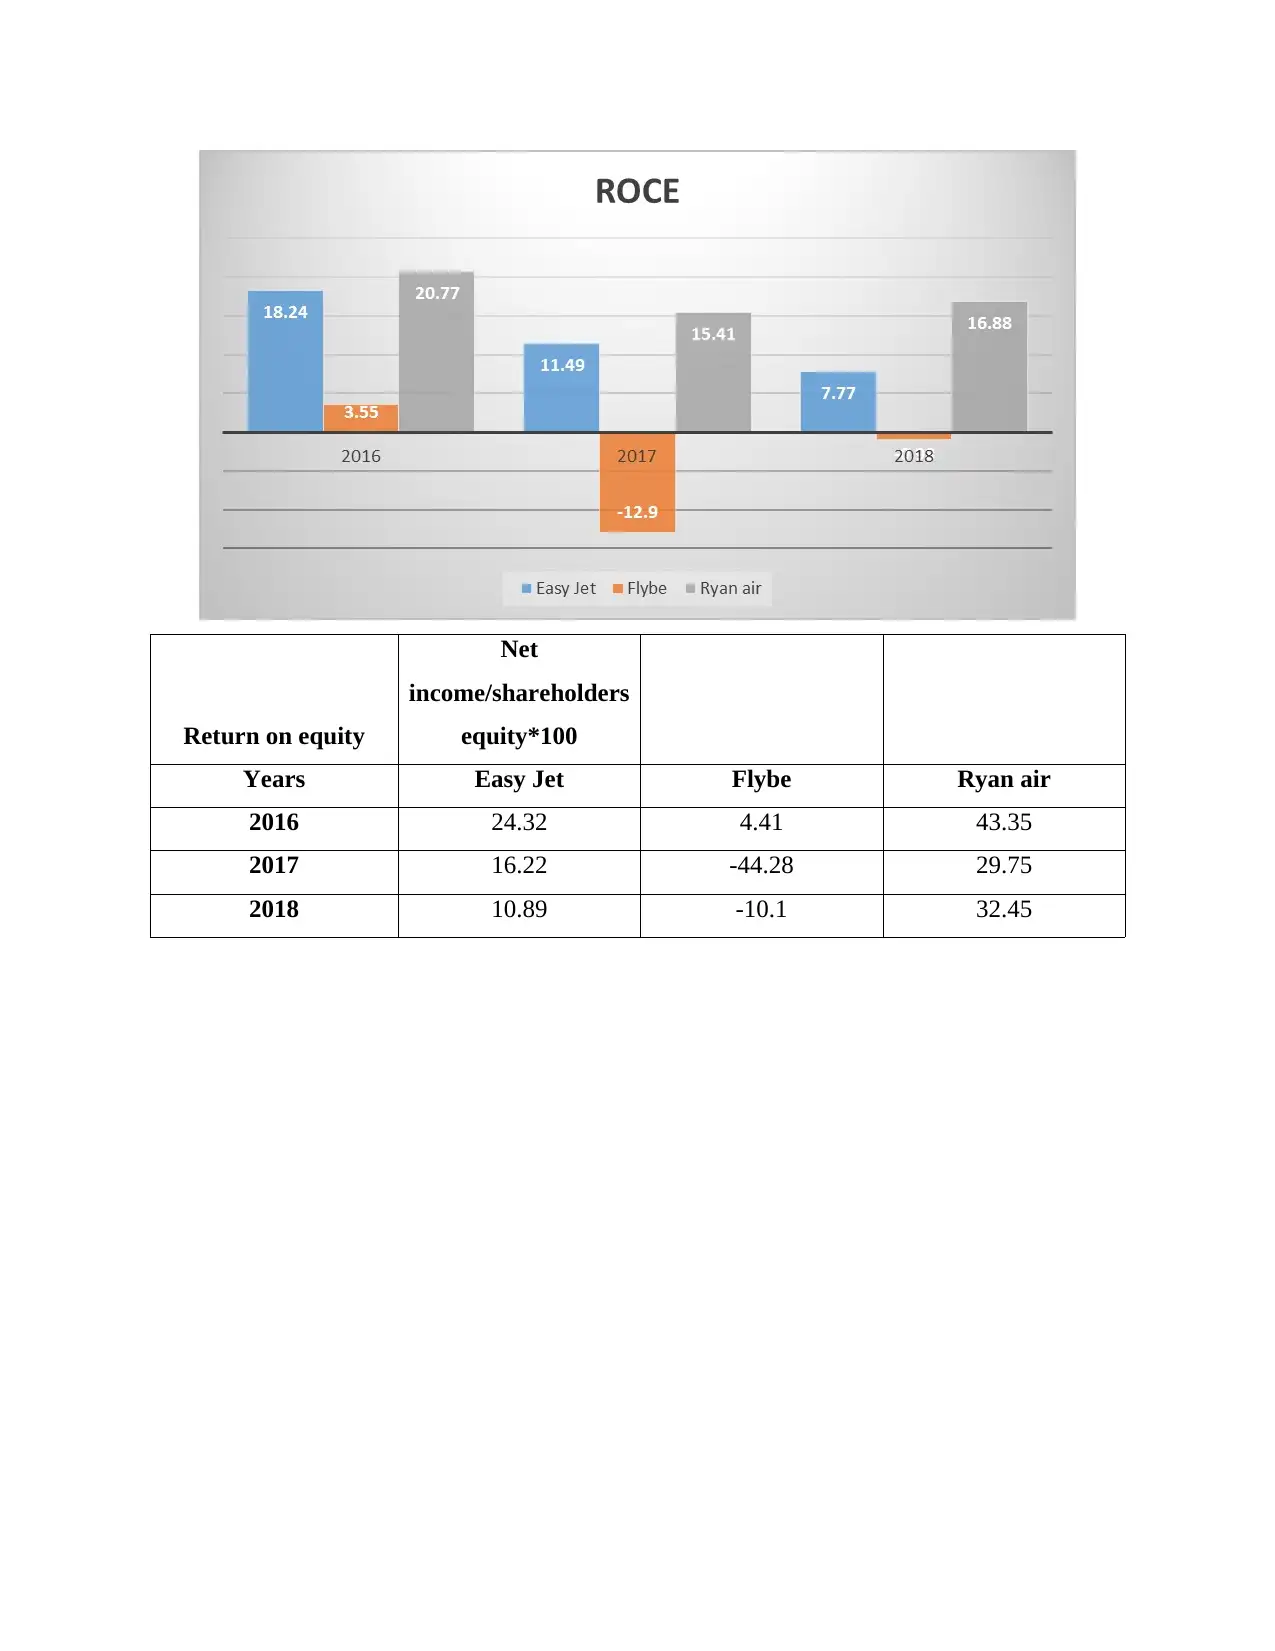
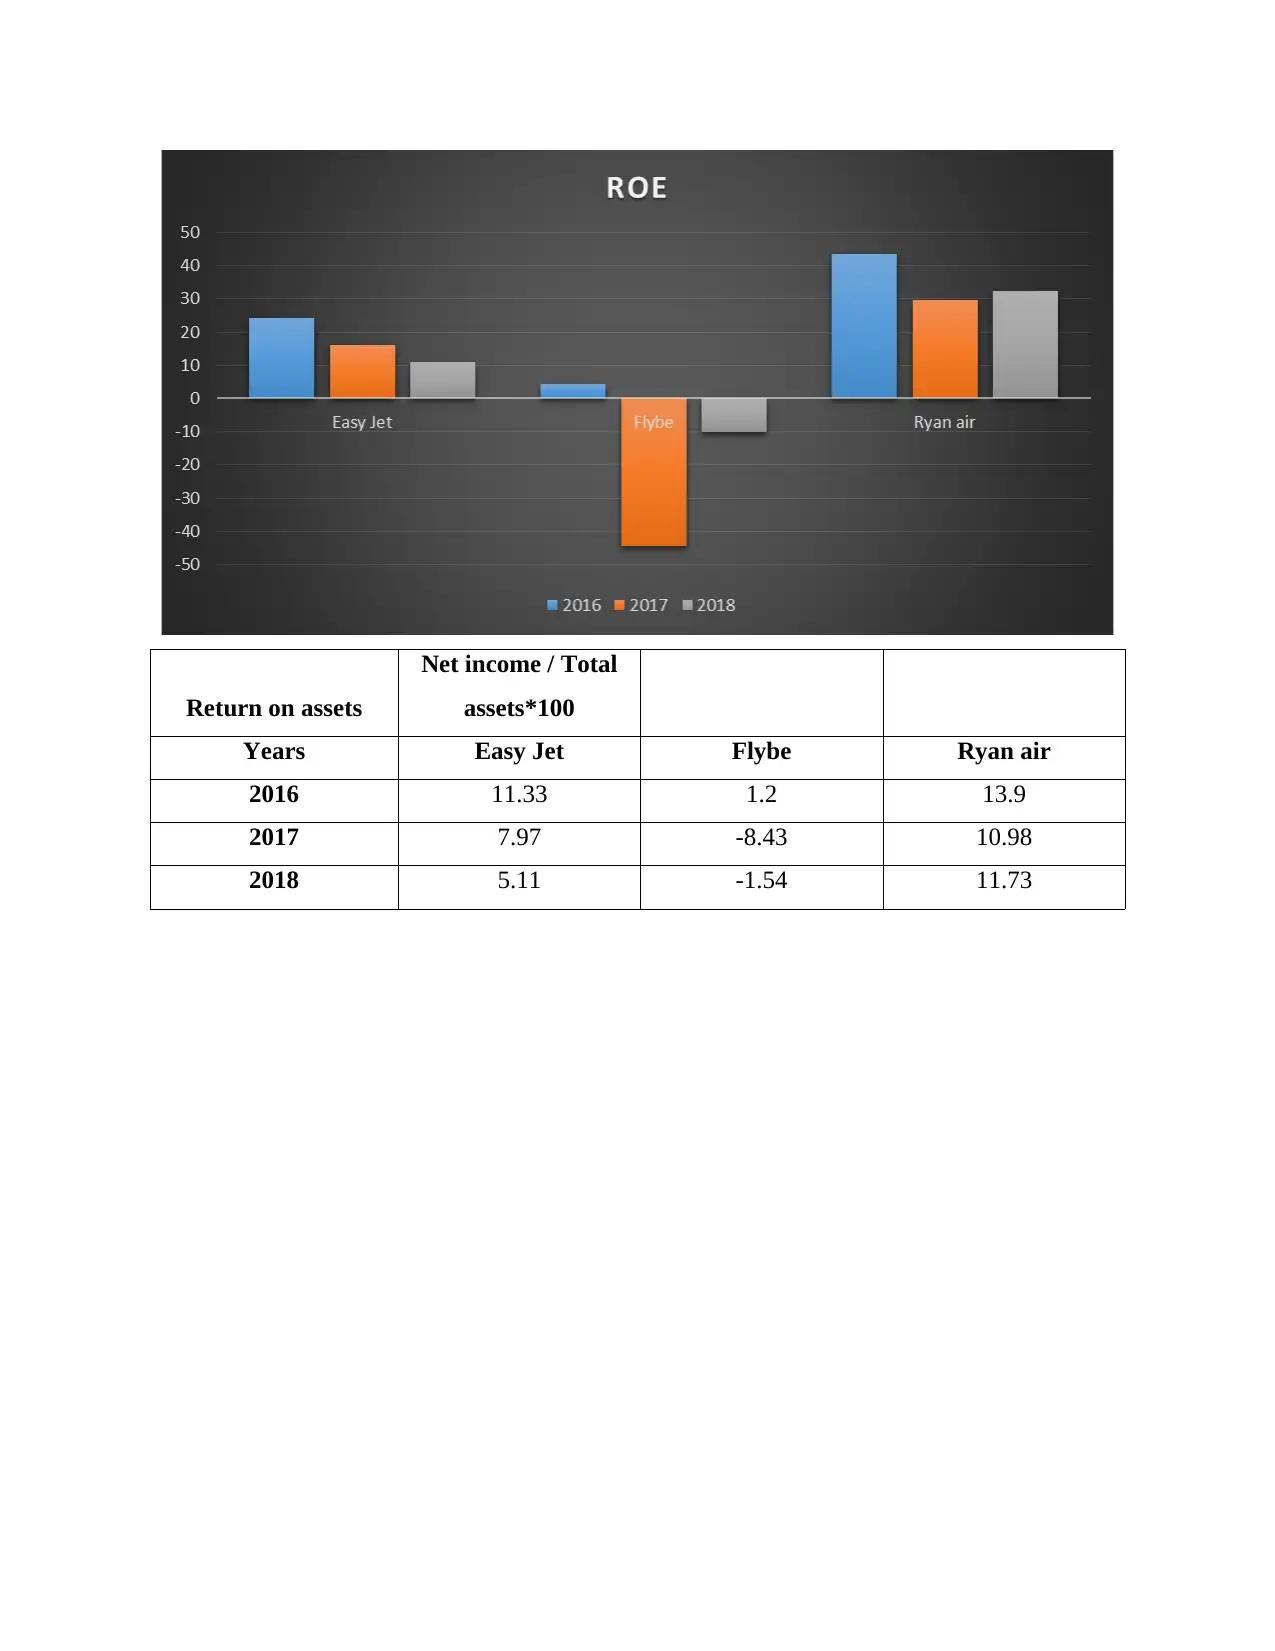
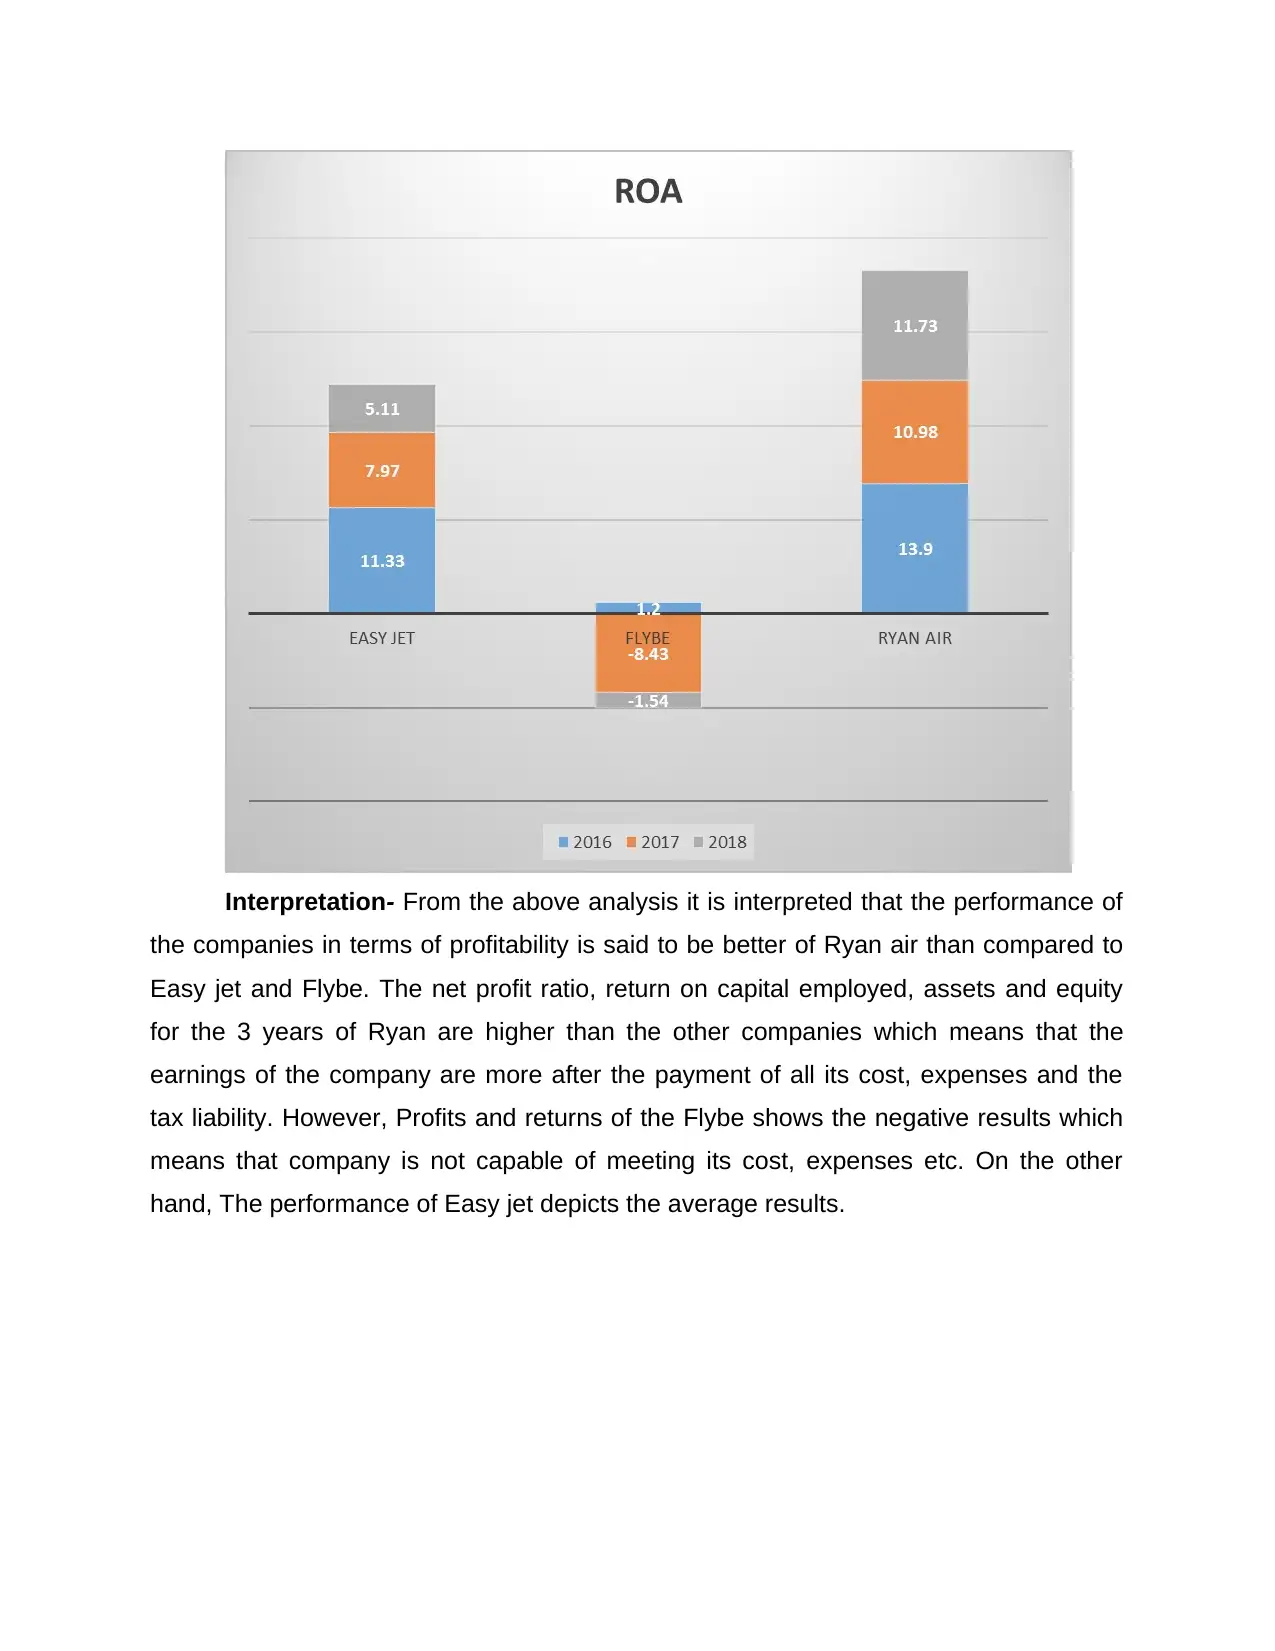
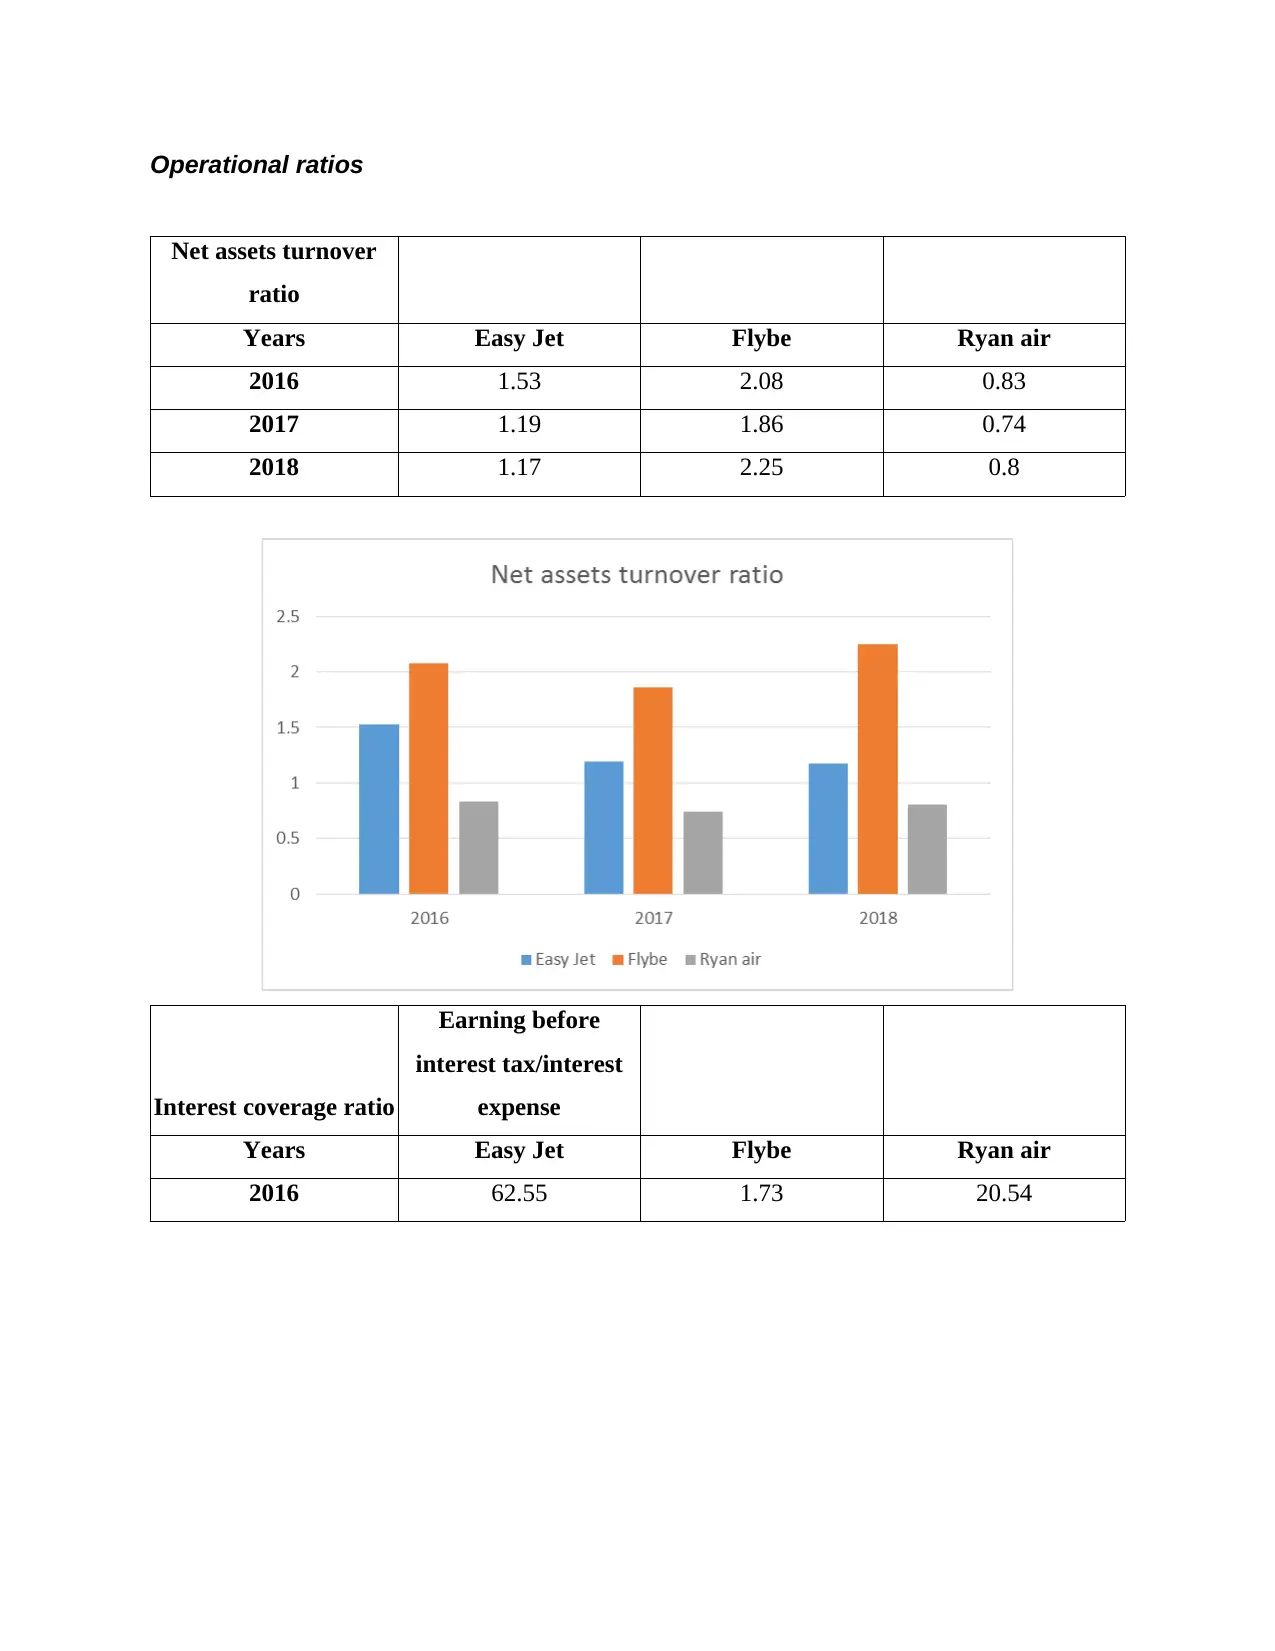
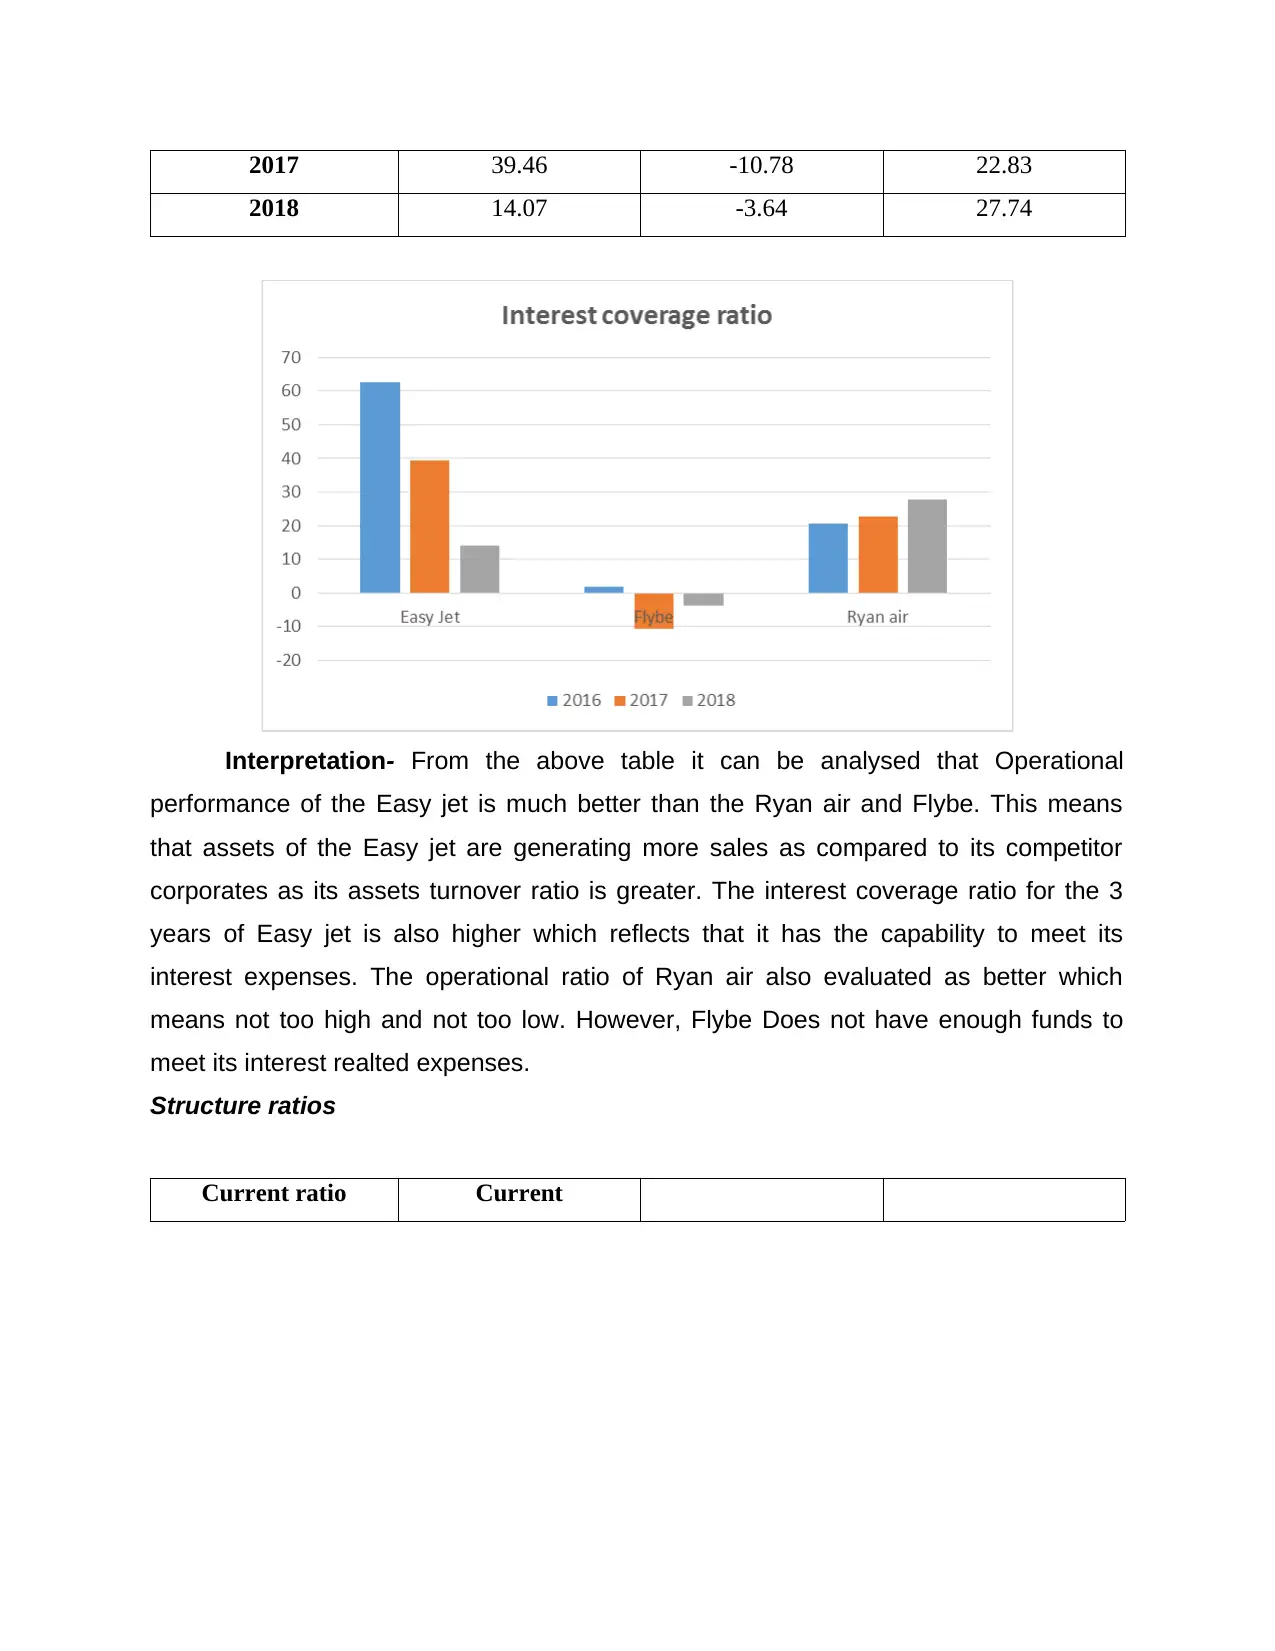
This financial report provides a comparative analysis of the financial performance of three UK-based aviation companies: Ryanair, EasyJet, and Flybe. The report begins with an introduction to financial reporting and its importance for stakeholders. Section A focuses on the analysis of financial ratios, including profitability, operational, structure, and non-financial ratios, for each company over three years (2016-2018). The analysis reveals that Ryanair consistently outperformed its competitors in terms of profitability and liquidity, making it the best-performing company. Flybe, on the other hand, showed poor financial performance and is identified as the worst performer, necessitating strategic recommendations. Section 2 delves into capital investment decision-making, outlining the process and importance of capital investment appraisal, including project identification and definition. The report concludes with a discussion on the role of capital investment decisions in achieving financial goals. The document provides a comprehensive overview of financial analysis and investment appraisal techniques.
Document Page
Financial report
tabler-icon-diamond-filled.svg

Paraphrase This Document

Need a fresh take? Get an instant paraphrase of this document with our AI Paraphraser
Document Page
TABLE OF CONTENTS
INTRODUCTION...........................................................................................................................1
SECTION A.....................................................................................................................................1
a) statement of financial ratios....................................................................................................1
b) the best performing company and its reasons.........................................................................6
C-The most poor performing company and its recommendation...............................................7
SECTION 2......................................................................................................................................8
A)capital investment decision making and its roles....................................................................8
b.techniques of investment appraisal........................................................................................11
CONCLUSION .............................................................................................................................15
REFERENCES..............................................................................................................................16
Document Page
INTRODUCTION
Financial report provide information about the performance and financial position
of the company over a specified period. It provides financial information to stakeholders,
creditors and promoter so that they evaluate company's performance before investing
money and also helps in planning and decision making.
This report is based on aviation company of UK namely Ryanair, Easy jet and Flybe.
This report includes financial ratios and non-financial ratio and evaluate good and bad
performer company. It also includes capital investment decision process and methods
of investment appraisal (Liang and et.al., 2016).
SECTION A
a) Statement of financial ratios
Ratio analysis may be served as quantitative tool which assists in analysing company’s
monetary performance from several perspectives such as profitability, liquidity & solvency etc.
The main motive of this report is to assess the extent to which one company performing better
over others. In this regard, to assess the best firm from investment perspective ratio analysis tool
has been selected.
Profitability ratios
Net profit ratio Net profit/sales*100
Years Easy Jet Flybe Ryan air
2016 14.62 0.43 26.35
2017 10.86 -6.68 22.12
2018 7.63 -1.24 22.53
Document Page
Return on capital
employed
Net income/capital
employed*100
Years Easy Jet Flybe Ryan air
2016 18.24 3.55 20.77
2017 11.49 -12.9 15.41
2018 7.77 -0.98 16.88
tabler-icon-diamond-filled.svg

Paraphrase This Document

Need a fresh take? Get an instant paraphrase of this document with our AI Paraphraser
Document Page
Return on equity
Net
income/shareholders
equity*100
Years Easy Jet Flybe Ryan air
2016 24.32 4.41 43.35
2017 16.22 -44.28 29.75
2018 10.89 -10.1 32.45
Document Page
Return on assets
Net income / Total
assets*100
Years Easy Jet Flybe Ryan air
2016 11.33 1.2 13.9
2017 7.97 -8.43 10.98
2018 5.11 -1.54 11.73
Document Page
Interpretation- From the above analysis it is interpreted that the performance of
the companies in terms of profitability is said to be better of Ryan air than compared to
Easy jet and Flybe. The net profit ratio, return on capital employed, assets and equity
for the 3 years of Ryan are higher than the other companies which means that the
earnings of the company are more after the payment of all its cost, expenses and the
tax liability. However, Profits and returns of the Flybe shows the negative results which
means that company is not capable of meeting its cost, expenses etc. On the other
hand, The performance of Easy jet depicts the average results.
tabler-icon-diamond-filled.svg

Paraphrase This Document

Need a fresh take? Get an instant paraphrase of this document with our AI Paraphraser
Document Page
Operational ratios
Net assets turnover
ratio
Years Easy Jet Flybe Ryan air
2016 1.53 2.08 0.83
2017 1.19 1.86 0.74
2018 1.17 2.25 0.8
Interest coverage ratio
Earning before
interest tax/interest
expense
Years Easy Jet Flybe Ryan air
2016 62.55 1.73 20.54
Document Page
2017 39.46 -10.78 22.83
2018 14.07 -3.64 27.74
Interpretation- From the above table it can be analysed that Operational
performance of the Easy jet is much better than the Ryan air and Flybe. This means
that assets of the Easy jet are generating more sales as compared to its competitor
corporates as its assets turnover ratio is greater. The interest coverage ratio for the 3
years of Easy jet is also higher which reflects that it has the capability to meet its
interest expenses. The operational ratio of Ryan air also evaluated as better which
means not too high and not too low. However, Flybe Does not have enough funds to
meet its interest realted expenses.
Structure ratios
Current ratio Current
Document Page
assets/current
liabilities
Years Easy Jet Flybe Ryan air
2016 0.72 1.06 1.43
2017 0.92 0.96 1.56
2018 1.04 0.77 1.23
Quick ratio
Quick assets/current
liabilities
Years Easy Jet Flybe Ryan air
2016 0.72 1.04 1.43
2017 0.92 0.94 1.56
2018 1.04 0.69 1.23
tabler-icon-diamond-filled.svg

Paraphrase This Document

Need a fresh take? Get an instant paraphrase of this document with our AI Paraphraser
Document Page
Shareholders liquidity
ratio
Years Easy Jet Flybe Ryan air
2016 2.77 1.03 0.85
2017 2.21 0.47 0.97
2018 1.87 0.38 1
Document Page
Gearing ratio
Years Easy Jet Flybe Ryan air
2016 39.97 106.62 130.73
2017 48.44 228.66 113.29
2018 53.5 281.2 109.97
chevron_up_icon
1 out of 26
circle_padding
hide_on_mobile
zoom_out_icon
[object Object]