Comprehensive Financial Performance Analysis Report: B Ltd. 2021-2022

Verified

Added on  2023/06/04

|3
|701
|191
Report
AI Summary
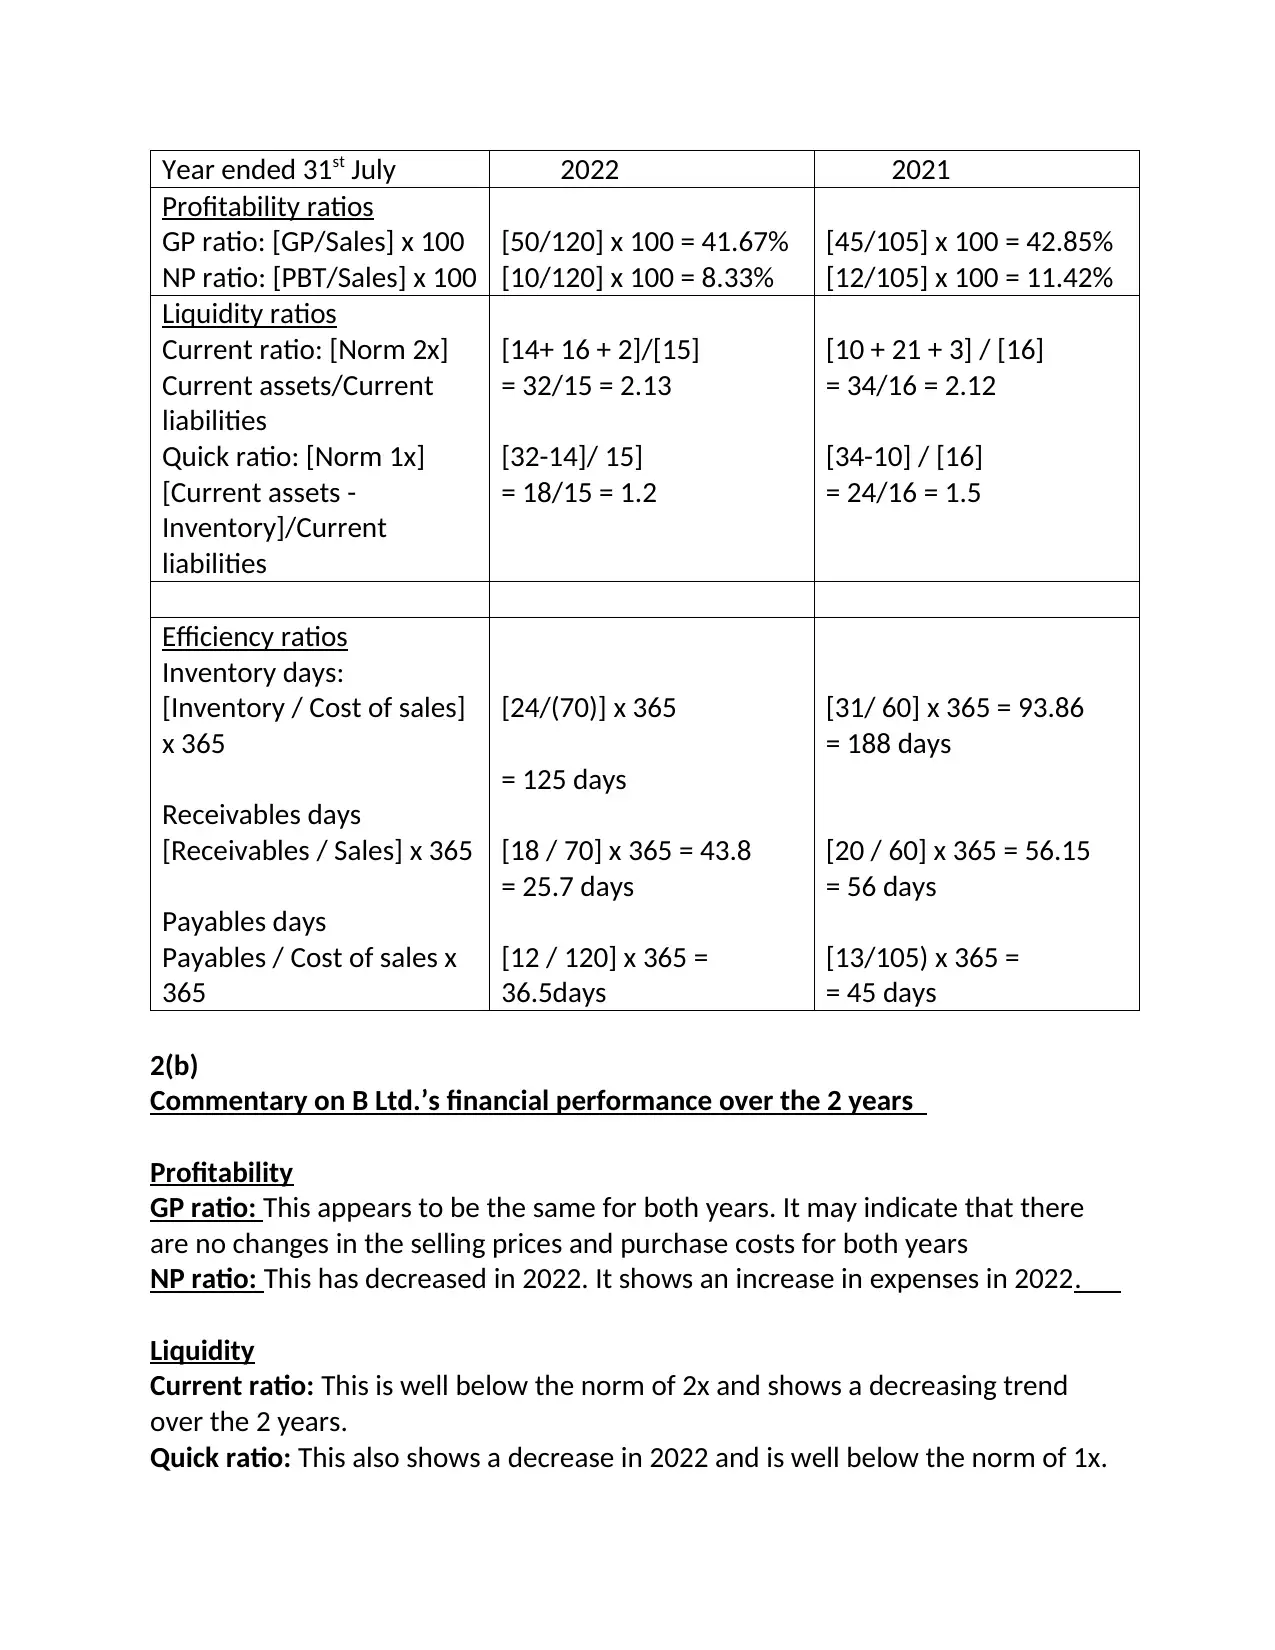
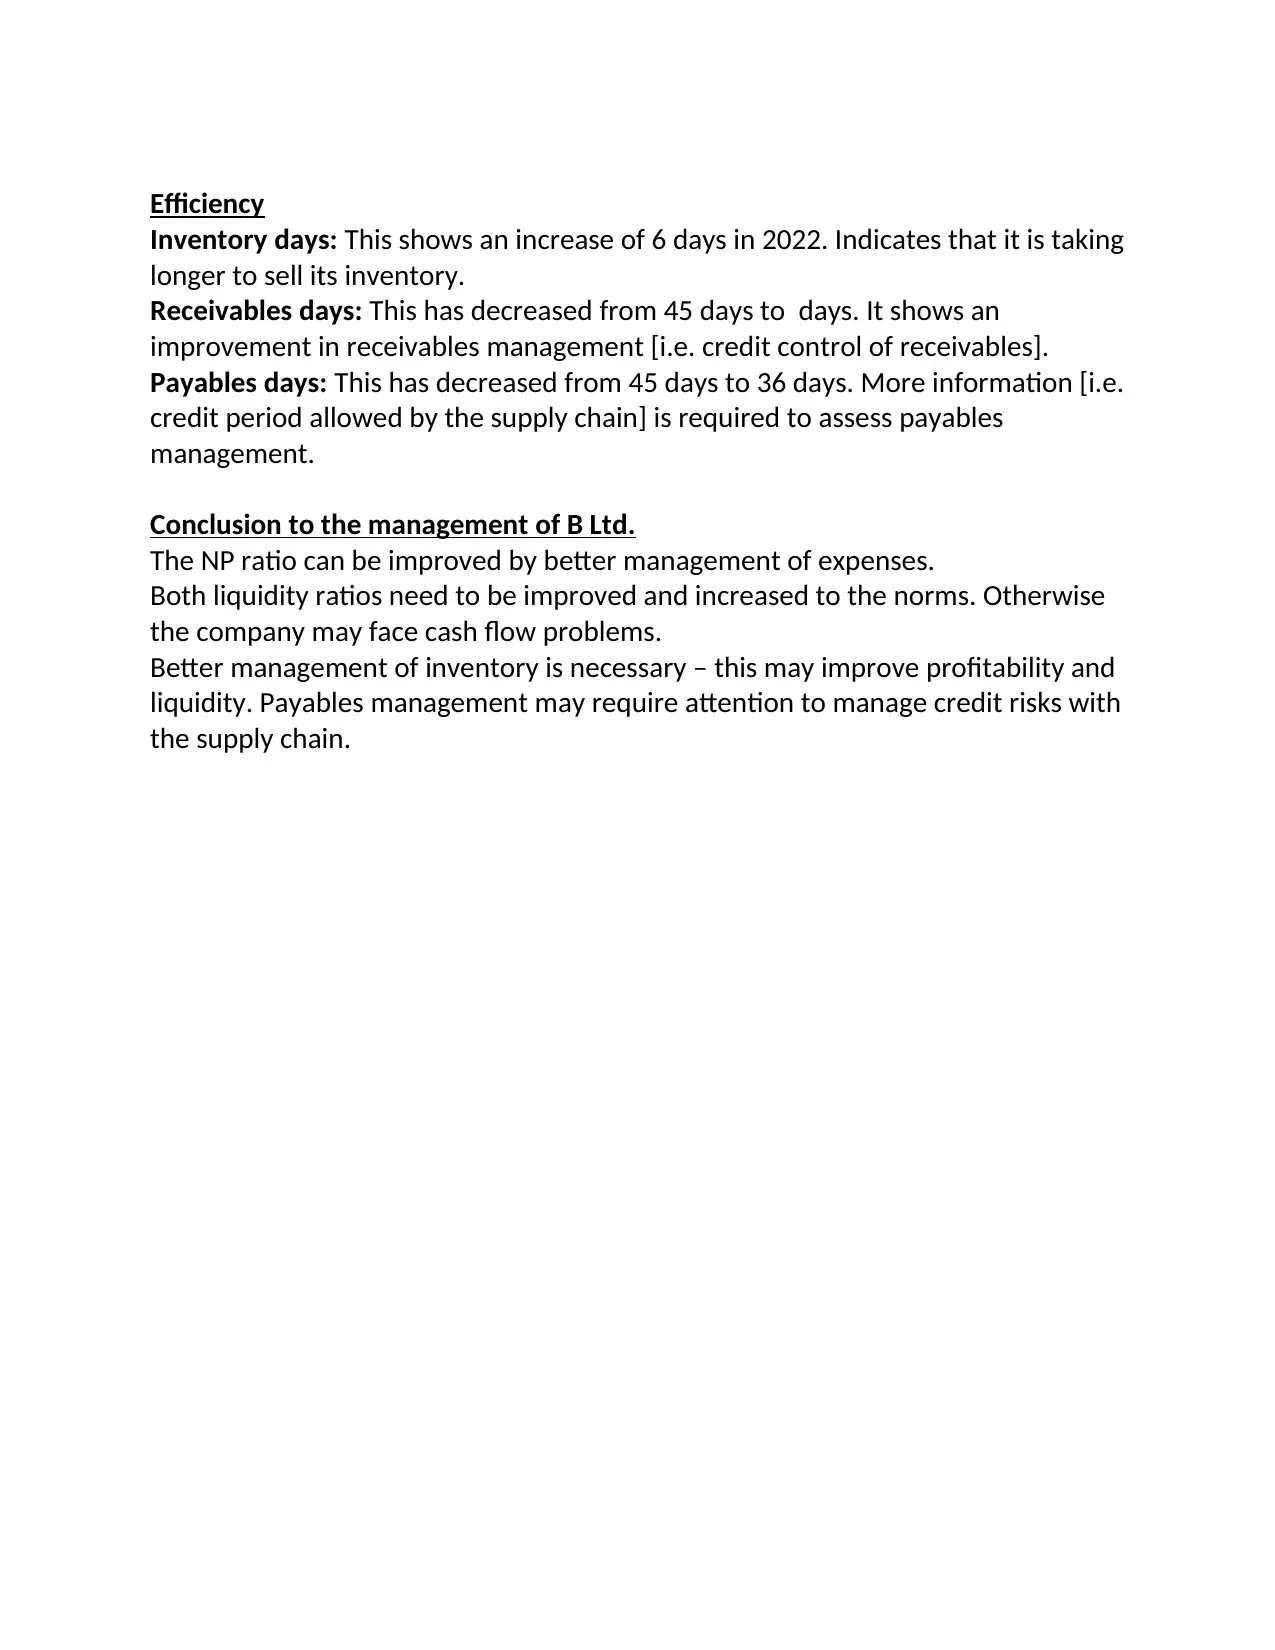
This report presents a financial ratio analysis of B Ltd.'s performance for the years 2021 and 2022. The analysis covers key financial ratios, including profitability ratios (GP and NP ratio), liquidity ratios (current and quick ratio), and efficiency ratios (inventory days, receivables days, and payables days). The report calculates these ratios and provides a commentary on the trends and changes observed over the two-year period. The commentary highlights the implications of these ratios, such as changes in expenses, inventory management, and credit control. The report concludes with recommendations for the management of B Ltd., emphasizing the need to improve the NP ratio, enhance liquidity, and optimize inventory and payables management. The report references several academic sources to support the analysis and findings.
Document Page
Year ended 31st July 2022 2021
Profitability ratios
GP ratio: [GP/Sales] x 100
NP ratio: [PBT/Sales] x 100
[50/120] x 100 = 41.67%
[10/120] x 100 = 8.33%
[45/105] x 100 = 42.85%
[12/105] x 100 = 11.42%
Liquidity ratios
Current ratio: [Norm 2x]
Current assets/Current
liabilities
Quick ratio: [Norm 1x]
[Current assets -
Inventory]/Current
liabilities
[14+ 16 + 2]/[15]
= 32/15 = 2.13
[32-14]/ 15]
= 18/15 = 1.2
[10 + 21 + 3] / [16]
= 34/16 = 2.12
[34-10] / [16]
= 24/16 = 1.5
Efficiency ratios
Inventory days:
[Inventory / Cost of sales]
x 365
Receivables days
[Receivables / Sales] x 365
Payables days
Payables / Cost of sales x
365
[24/(70)] x 365
= 125 days
[18 / 70] x 365 = 43.8
= 25.7 days
[12 / 120] x 365 =
36.5days
[31/ 60] x 365 = 93.86
= 188 days
[20 / 60] x 365 = 56.15
= 56 days
[13/105) x 365 =
= 45 days
2(b)
Commentary on B Ltd.’s financial performance over the 2 years
Profitability
GP ratio: This appears to be the same for both years. It may indicate that there
are no changes in the selling prices and purchase costs for both years
NP ratio: This has decreased in 2022. It shows an increase in expenses in 2022.
Liquidity
Current ratio: This is well below the norm of 2x and shows a decreasing trend
over the 2 years.
Quick ratio: This also shows a decrease in 2022 and is well below the norm of 1x.
tabler-icon-diamond-filled.svg

Paraphrase This Document

Need a fresh take? Get an instant paraphrase of this document with our AI Paraphraser
Document Page
Efficiency
Inventory days: This shows an increase of 6 days in 2022. Indicates that it is taking
longer to sell its inventory.
Receivables days: This has decreased from 45 days to days. It shows an
improvement in receivables management [i.e. credit control of receivables].
Payables days: This has decreased from 45 days to 36 days. More information [i.e.
credit period allowed by the supply chain] is required to assess payables
management.
Conclusion to the management of B Ltd.
The NP ratio can be improved by better management of expenses.
Both liquidity ratios need to be improved and increased to the norms. Otherwise
the company may face cash flow problems.
Better management of inventory is necessary – this may improve profitability and
liquidity. Payables management may require attention to manage credit risks with
the supply chain.
Document Page
REFERENCES
Books and Journals
Asir, M., Rachman, S. and Yuliani, N.F., 2022. Performance Analysis of Financial Statements on
CV. SAM in Gowa District. Budapest International Research and Critics Institute (BIRCI-
Journal): Humanities and Social Sciences, 5(3).
Haustein, E. and Lorson, P.C., 2019. Consolidated financial statements.
Hernawati, E., 2021. Corporate Governance, Earnings Management and Integrity of Financial
Statements: The Role of Audit Quality and Evidence from Indonesia. Review of
International Geographical Education Online, 11(3).
Huy, P.Q. and Phuc, V.K., 2022. Exploration the influence to information quality of financial
statements from internal control structure–an approach to education field in public
sector. International Journal of Intellectual Property Management, 12(3), pp.318-340.
Li, J., Wei, L. and Zhu, X., 2022. Financial Statements-Based Bank Risk Aggregation
Framework. Financial Statements-Based Bank Risk Aggregation, pp.43-54.
Xu, X., 2022. Analysis of Zijin Mining's Financial Statements based on Harvard
Framework. Frontiers in Economics and Management, 3(8), pp.368-377.
chevron_up_icon
1 out of 3
circle_padding
hide_on_mobile
zoom_out_icon
[object Object]