BBA Thesis: Financial Performance of Bank Asia Limited
VerifiedAdded on 2022/02/19
|27
|4179
|19
Report
AI Summary
This thesis report presents a comprehensive analysis of the financial performance of Bank Asia Limited, a leading private commercial bank in Bangladesh. The report, submitted to the University of Development Alternative (UODA), covers the period from 2014 to 2018 and examines various financial aspects, including export & import, capital structure, assets, loans, investments, and non-performing loans. Key financial ratios such as Return on Assets (ROA), Return on Equity (ROE), Debt to Equity Ratio, and Earnings per Share (EPS) are analyzed to assess the bank's profitability, efficiency, and financial health. The report also includes an overview of the banking sector in Bangladesh, the objectives of the study, and findings based on the analysis of the bank's financial data. The report concludes with an overview of the bank's performance and provides valuable insights into its financial standing.
1 | P a g e
UNIVERSITY OF DEVELOPMENT ALTERNATIVE (UODA)
THESIS REPORT
A STUDY ON
Financial Performance of Bank Asia Limited
SUBMITTED TO:
THE DEAN
FACULTY OF BUSINESS ADMINISTRATION
SUPERVISED BY:
MR. SIDDIQUE HAYAT KHAN
ASSOCIATE PROFESSOR
SUBMITTED BY:
RAKIB HOSSAIN
BBA 53 BATCH, MAJOR FINANCE
STUDENT ID: 021163034
FACULTY OF BUSINESS ADMINISTRATION
BBA PROGRAM
UNIVERSITY OF DEVELOPMENT ALTERNATIVE (UODA)
DATE:
SEPTEMBER 12, 2020
UNIVERSITY OF DEVELOPMENT ALTERNATIVE (UODA)
THESIS REPORT
A STUDY ON
Financial Performance of Bank Asia Limited
SUBMITTED TO:
THE DEAN
FACULTY OF BUSINESS ADMINISTRATION
SUPERVISED BY:
MR. SIDDIQUE HAYAT KHAN
ASSOCIATE PROFESSOR
SUBMITTED BY:
RAKIB HOSSAIN
BBA 53 BATCH, MAJOR FINANCE
STUDENT ID: 021163034
FACULTY OF BUSINESS ADMINISTRATION
BBA PROGRAM
UNIVERSITY OF DEVELOPMENT ALTERNATIVE (UODA)
DATE:
SEPTEMBER 12, 2020
Paraphrase This Document
Need a fresh take? Get an instant paraphrase of this document with our AI Paraphraser
2 | P a g e
Letter of Transmittal
12-sep-2020
The Dean
Faculty of Business Administration
University of Development Alternative (UODA)
Subject: Submission of thesis on “Financial Performance of Bank Asia Limited”.
Dear Sir,
With due respect, I would like to state that I have completed a thesis with my honest and maximum effort
that fulfills partial requirements of Bachelor of Business Administration Degree. I have prepared this
report on the basis of my on Bank Asia Limited. It is a great pleasure for me to present you this report
under the heading of “Financial performance”. I enjoy preparing this report, which enriched my partial
knowledge of the theoretical concept. Under the supervision of Mr. Siddique Hayat Khan.
I would like to thanks you for giving me such a great job and opportunity like this to prove my ability in
making a quality report. Therefore, I sincerely hope that you would be kind enough to accept my report for
assessment and oblige thereby.
Thanking you for your kind supervisions.
Sincerely yours,
Rakib Hossain
Batch # 53rd
Std. ID # 021163034
University of Development Alternative
3 | P a g e
Declaration
I am Rakib Hossain, hereby declare that the thesis titled “Financial Performance of Bank Asia
Limited” is uniquely prepared by my own efforts after the completion of three months works on
Bank Asia Limited. This report is a record of extensive research work under the supervision and
guidance of Mr. Siddique Hayat Khan, University of Development Alternative (UODA) .
I confirm that, the report is only prepared for only my academic requirement not for other purpose. I also
assure that this internship report is not submitted anywhere of Bangladesh before me.
Batch # 53rd
Std.ID # 021162034
University of Development Alternative (UODA)
⊘ This is a preview!⊘
Do you want full access?
Subscribe today to unlock all pages.
Trusted by 1+ million students worldwide
4 | P a g e
Executive Summary
In this report the financial performance of Bank Asia Ltd. has been analyzed. It has been one of the
leading private commercial banks in Bangladesh and also doing really well over past few years. At the
beginning of the report, a precise. At the beginning of the report, a precise Introduction, Objective of
report and Fact/ Summaries Information. In addition, the ratio analysis has been done of last five years
performance which will help to understand the current as well as past performance of Bank Asia Ltd. .
After that I want to show that export & Import , Authorized capital, Paid-up capital, Core (Tier 1) capital,
Supplementary (Tier 2) capital, Total capital (Tier 1 and Tier 2), Total risk weighted assets, Tier 1 capital
to risk-weighted asset ratio (%),Tier 2 capital to risk-weighted asset ratio (%),Number of share
outstanding, Deposits, Assets, Loans and Advances, Investments, Non-performing loans/assets
(NPL/NPA),Provisions, Classified loan. I have mentioned about some findings of this Bank.
Paraphrase This Document
Need a fresh take? Get an instant paraphrase of this document with our AI Paraphraser
5 | P a g e
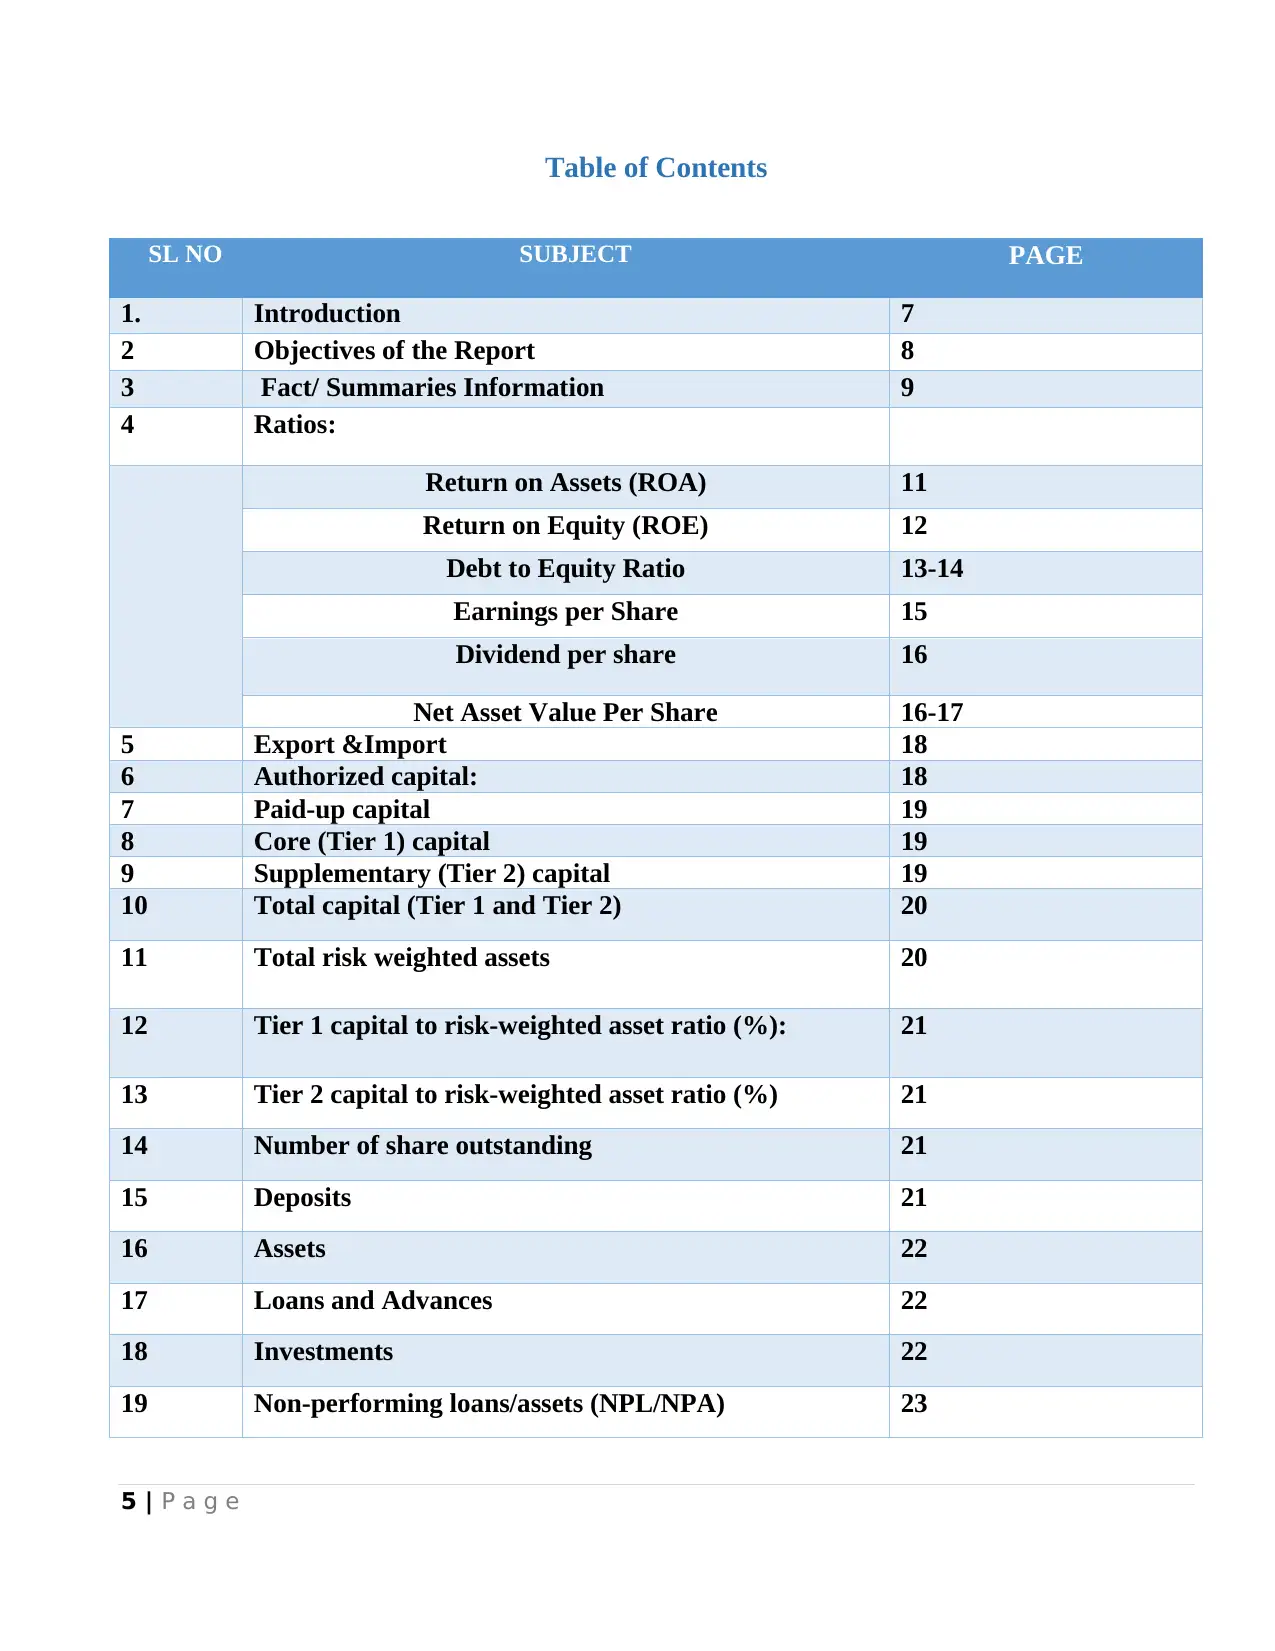
Table of Contents
SL NO SUBJECT PAGE
1. Introduction 7
2 Objectives of the Report 8
3 Fact/ Summaries Information 9
4 Ratios:
Return on Assets (ROA) 11
Return on Equity (ROE) 12
Debt to Equity Ratio 13-14
Earnings per Share 15
Dividend per share 16
Net Asset Value Per Share 16-17
5 Export &Import 18
6 Authorized capital: 18
7 Paid-up capital 19
8 Core (Tier 1) capital 19
9 Supplementary (Tier 2) capital 19
10 Total capital (Tier 1 and Tier 2) 20
11 Total risk weighted assets 20
12 Tier 1 capital to risk-weighted asset ratio (%): 21
13 Tier 2 capital to risk-weighted asset ratio (%) 21
14 Number of share outstanding 21
15 Deposits 21
16 Assets 22
17 Loans and Advances 22
18 Investments 22
19 Non-performing loans/assets (NPL/NPA) 23
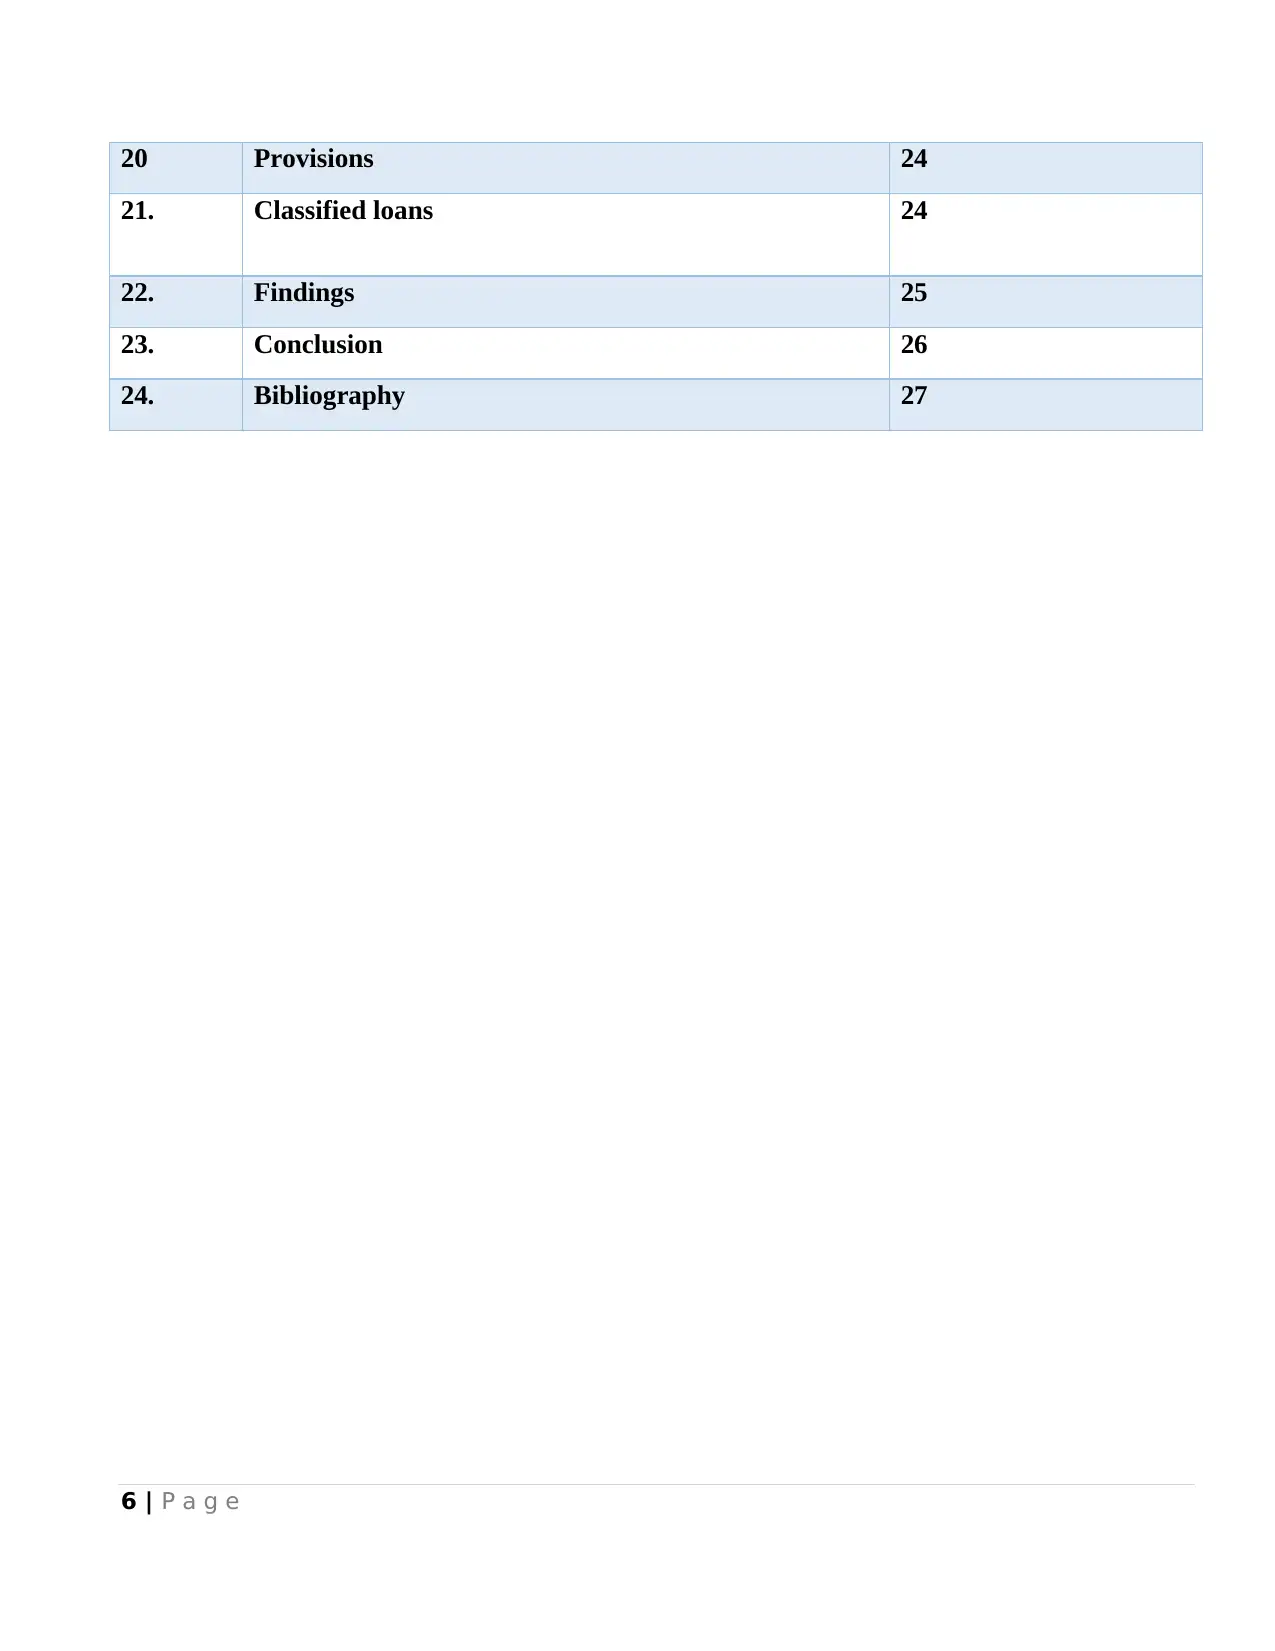
6 | P a g e
20 Provisions 24
21. Classified loans 24
22. Findings 25
23. Conclusion 26
24. Bibliography 27
20 Provisions 24
21. Classified loans 24
22. Findings 25
23. Conclusion 26
24. Bibliography 27
⊘ This is a preview!⊘
Do you want full access?
Subscribe today to unlock all pages.
Trusted by 1+ million students worldwide
7 | P a g e
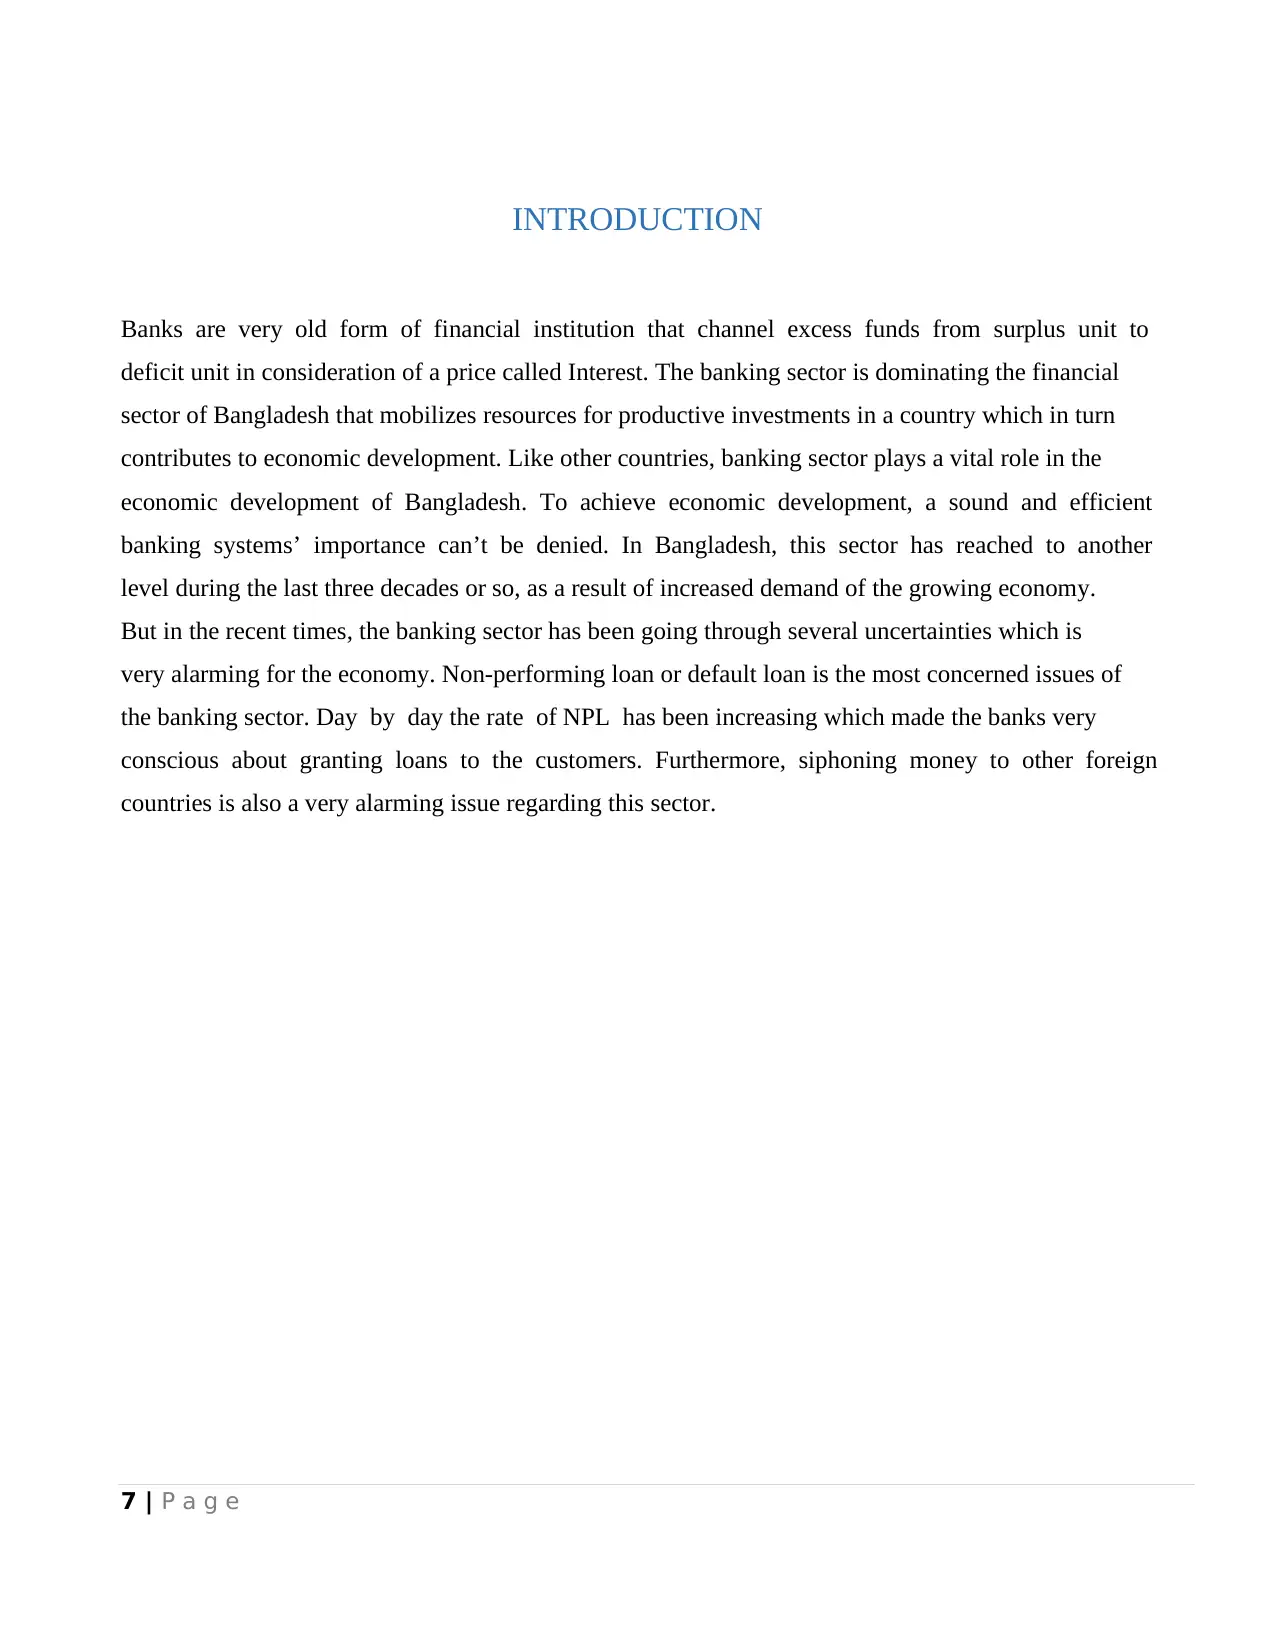
INTRODUCTION
Banks are very old form of financial institution that channel excess funds from surplus unit to
deficit unit in consideration of a price called Interest. The banking sector is dominating the financial
sector of Bangladesh that mobilizes resources for productive investments in a country which in turn
contributes to economic development. Like other countries, banking sector plays a vital role in the
economic development of Bangladesh. To achieve economic development, a sound and efficient
banking systems’ importance can’t be denied. In Bangladesh, this sector has reached to another
level during the last three decades or so, as a result of increased demand of the growing economy.
But in the recent times, the banking sector has been going through several uncertainties which is
very alarming for the economy. Non-performing loan or default loan is the most concerned issues of
the banking sector. Day by day the rate of NPL has been increasing which made the banks very
conscious about granting loans to the customers. Furthermore, siphoning money to other foreign
countries is also a very alarming issue regarding this sector.
Paraphrase This Document
Need a fresh take? Get an instant paraphrase of this document with our AI Paraphraser
8 | P a g e
OBJECTIVE OF REPORT
The objectives of the report can be divided into two levels. One is primary objective and the other is
secondary objectives.
The primary objectives of the report are:
• To fulfill one of the requirements of achieving BBA degree.
• To secure good marks on internship report.
• To adapt with the corporate world.
The secondary objectives of the report are:
• To identify their key financial performances for acquiring the knowledge of
operational efficiency of Bank Asia Ltd.
• To obtain a clear concept of banking sector in Bangladesh.
• To get acquainted with the ratios which indicate and measure the performance of
a bank.
9 | P a g e
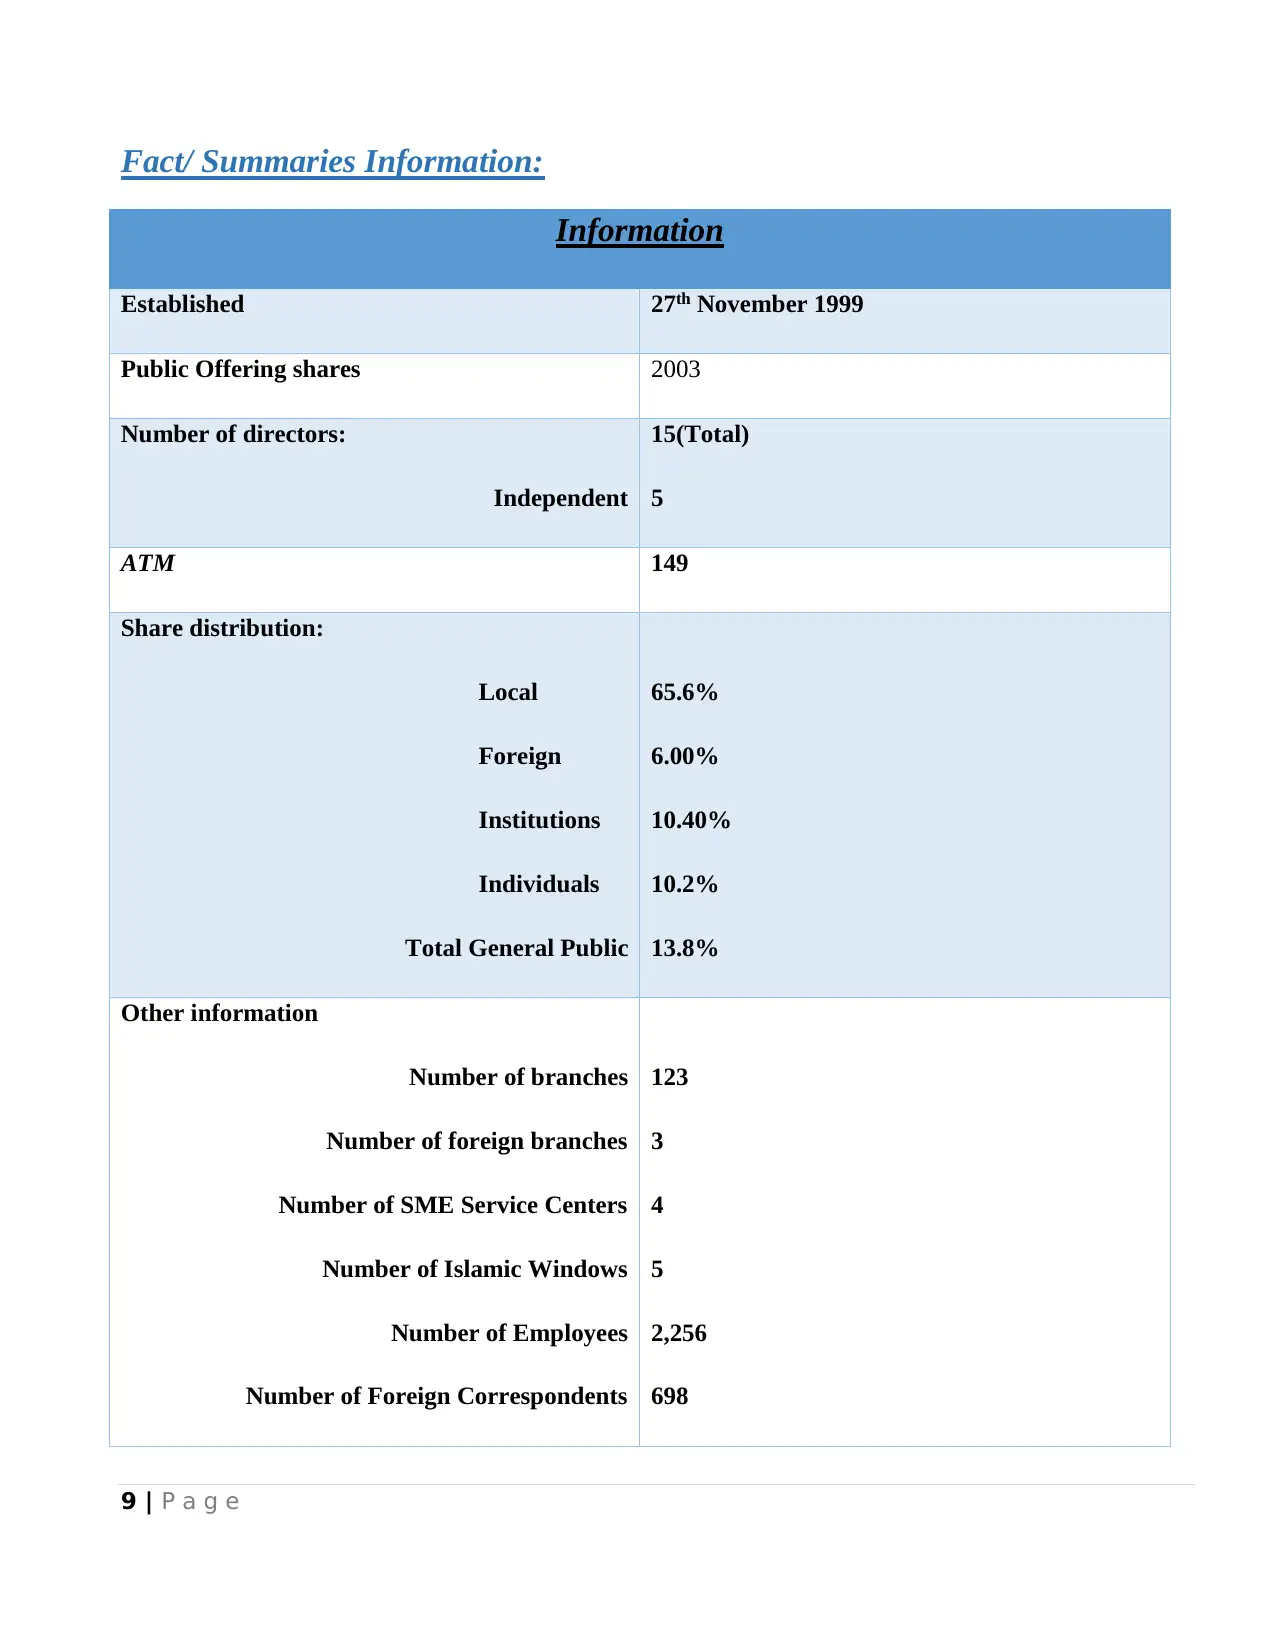
Fact/ Summaries Information:
Information
Established 27th November 1999
Public Offering shares 2003
Number of directors:
Independent
15(Total)
5
ATM 149
Share distribution:
Local
Foreign
Institutions
Individuals
Total General Public
65.6%
6.00%
10.40%
10.2%
13.8%
Other information
Number of branches
Number of foreign branches
Number of SME Service Centers
Number of Islamic Windows
Number of Employees
Number of Foreign Correspondents
123
3
4
5
2,256
698
⊘ This is a preview!⊘
Do you want full access?
Subscribe today to unlock all pages.
Trusted by 1+ million students worldwide
10 | P a g e
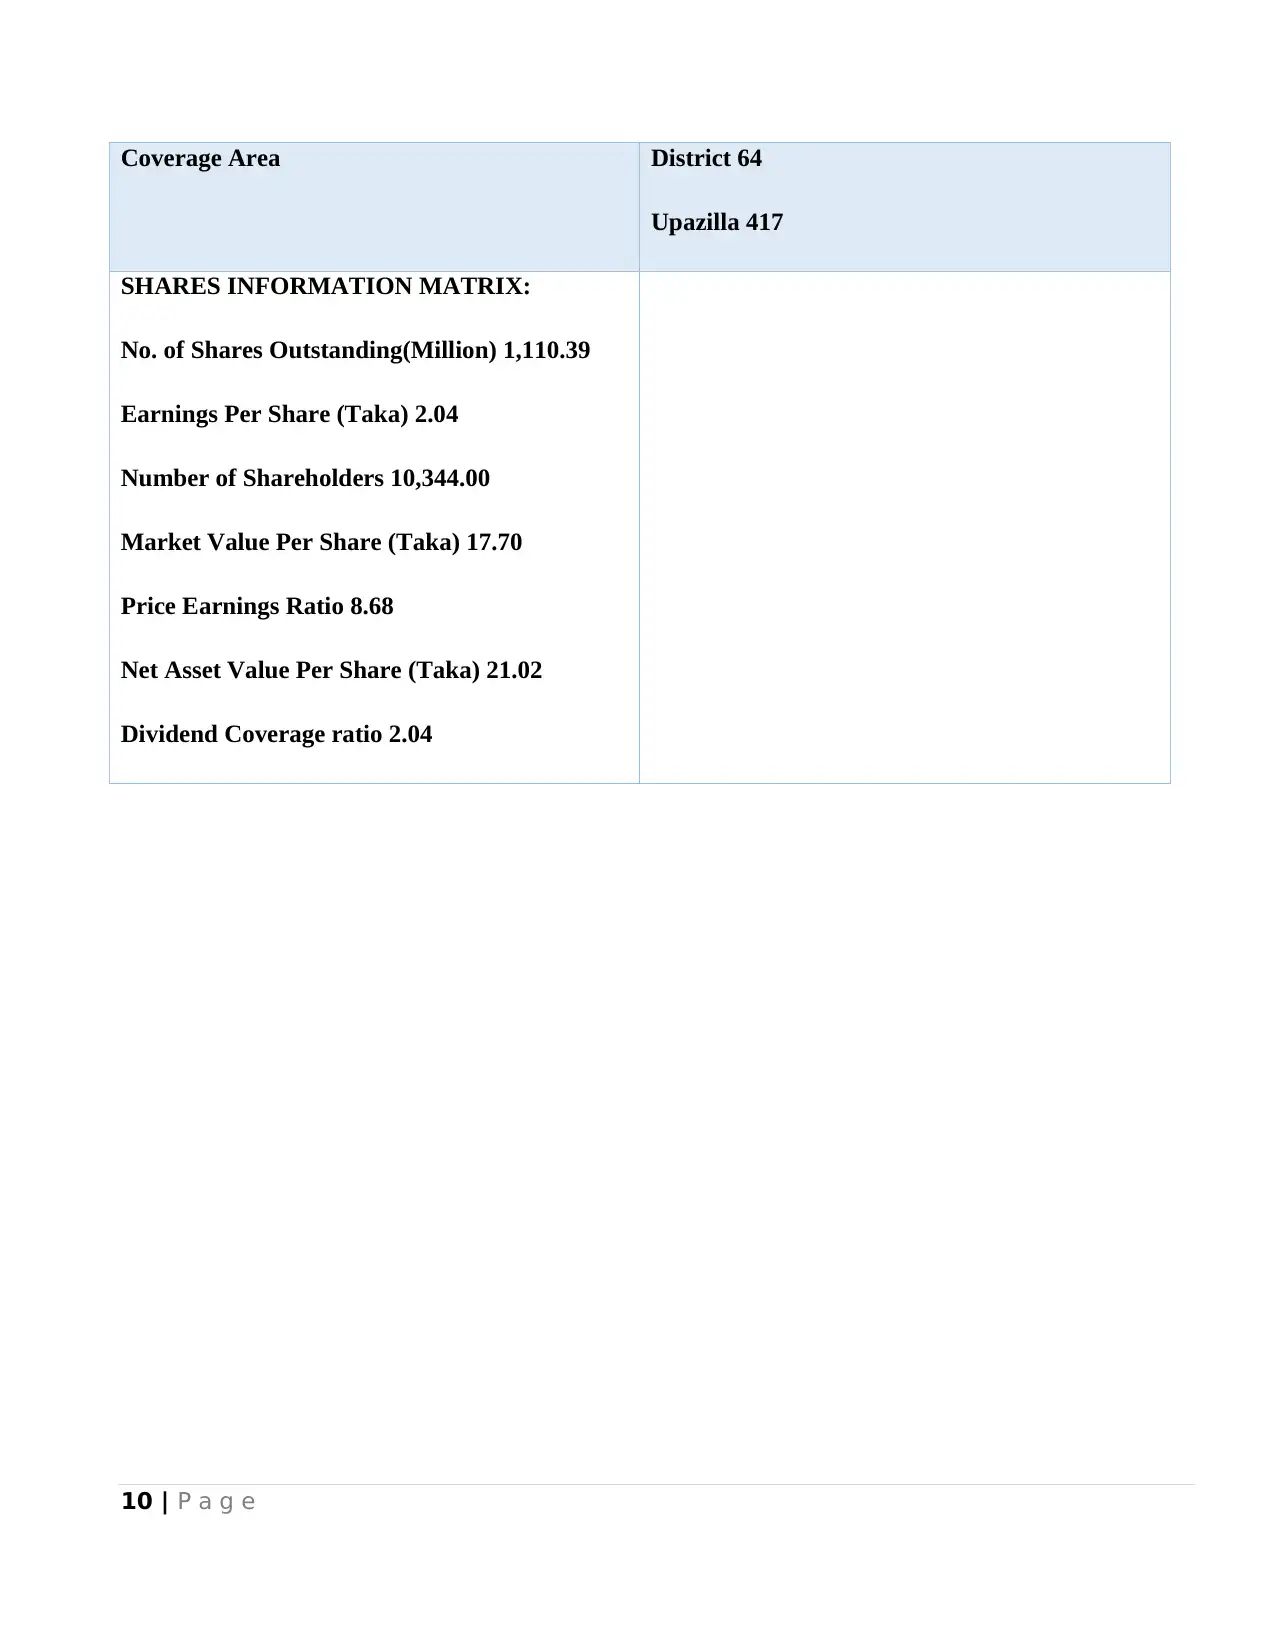
Coverage Area District 64
Upazilla 417
SHARES INFORMATION MATRIX:
No. of Shares Outstanding(Million) 1,110.39
Earnings Per Share (Taka) 2.04
Number of Shareholders 10,344.00
Market Value Per Share (Taka) 17.70
Price Earnings Ratio 8.68
Net Asset Value Per Share (Taka) 21.02
Dividend Coverage ratio 2.04
Paraphrase This Document
Need a fresh take? Get an instant paraphrase of this document with our AI Paraphraser
11 | P a g e
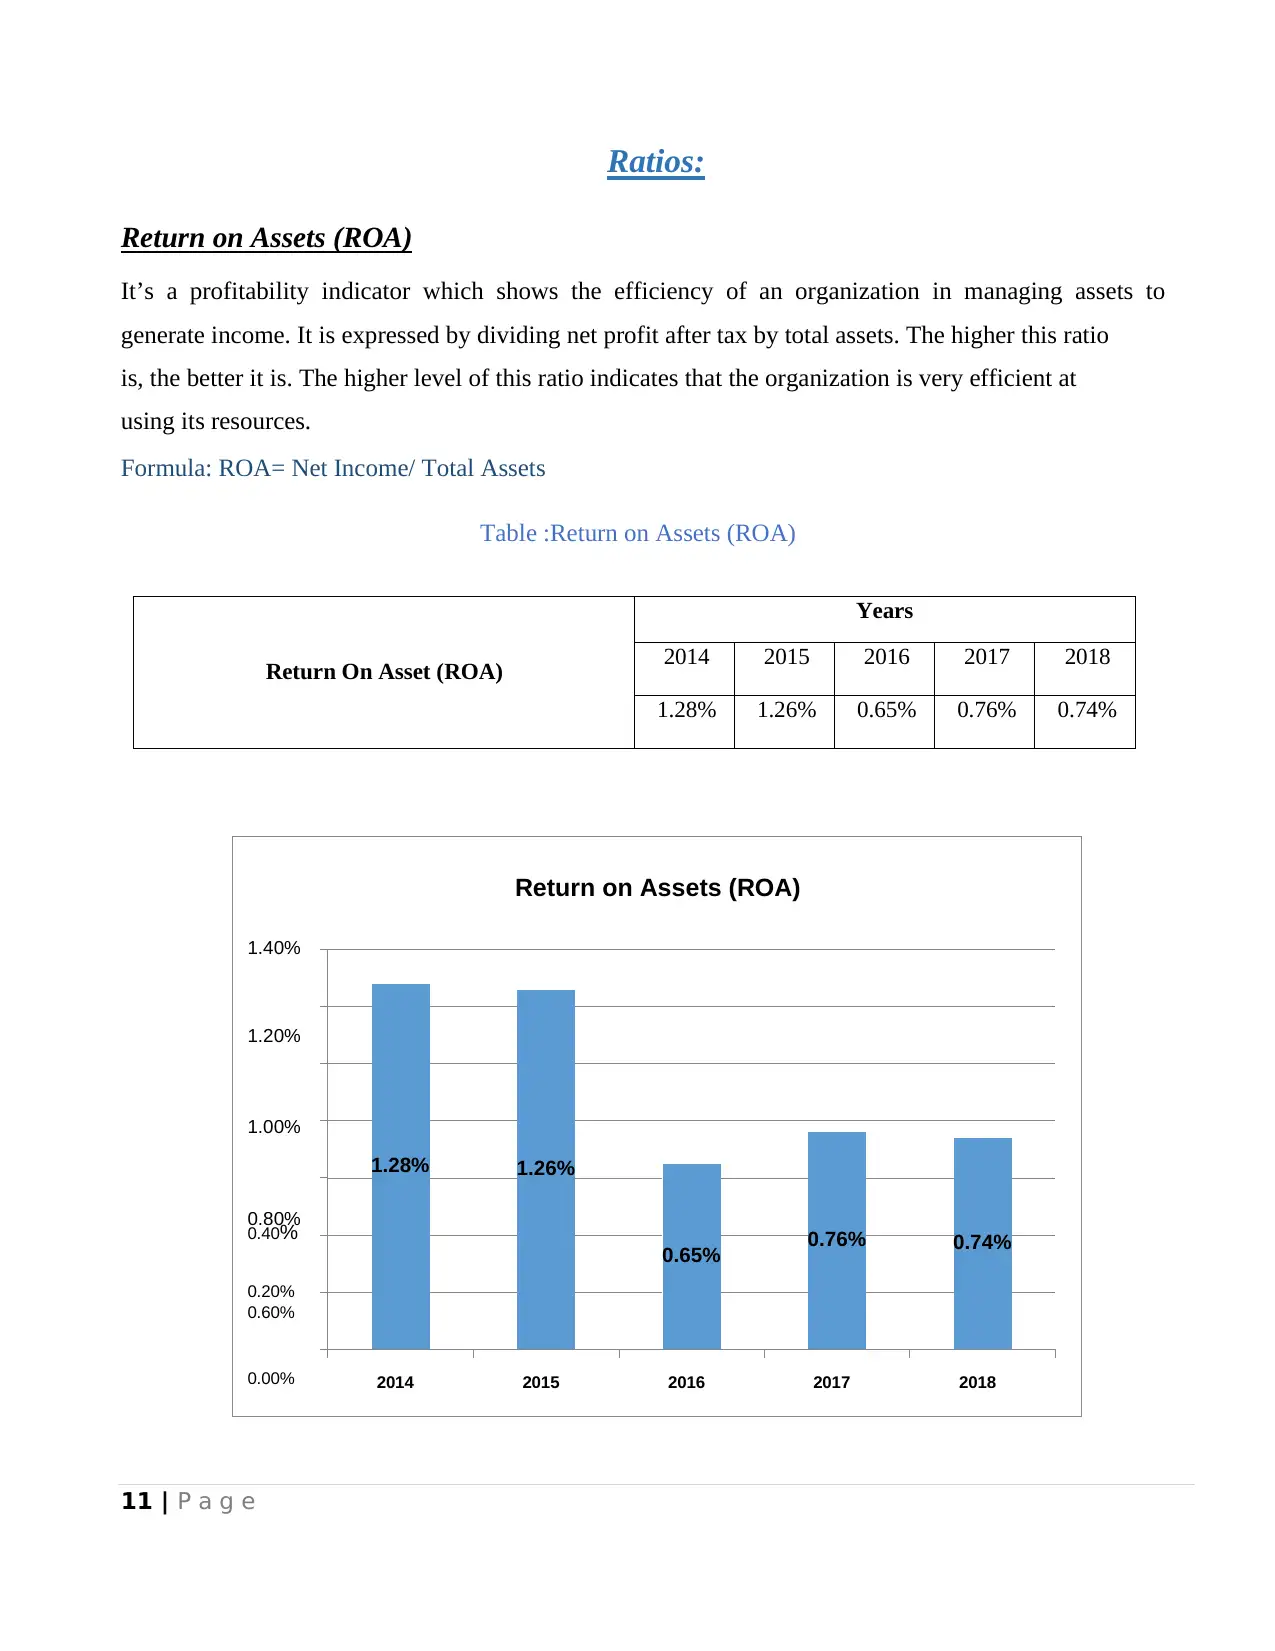
Ratios:
Return on Assets (ROA)
It’s a profitability indicator which shows the efficiency of an organization in managing assets to
generate income. It is expressed by dividing net profit after tax by total assets. The higher this ratio
is, the better it is. The higher level of this ratio indicates that the organization is very efficient at
using its resources.
Formula: ROA= Net Income/ Total Assets
Table :Return on Assets (ROA)
Return On Asset (ROA)
Years
2014 2015 2016 2017 2018
1.28% 1.26% 0.65% 0.76% 0.74%
Return on Assets (ROA)
1.40%
1.20%
1.00%
0.80%
0.60%
1.28% 1.26%
0.40%
0.65% 0.76% 0.74%
0.20%
0.00% 2014 2015 2016 2017 2018
12 | P a g e
Interpretation:
From the above figure we can see that return on asset was in increasing trend from 2014 to 2015.
In 2014 Bank Asia Ltd. Has earned Tk. 1.28 for each taka of assets they have invested. But in
2016 return on asset declines drastically because profit after tax of 2016 was lower than 2014 and
2015 and total asset was higher than 2014 and 2015 and that’s why the return on asset declines. In
2017 it again increased because its profit after tax and total asset increased but in 2018, it slightly
decreased to 0.74% than the previous year.
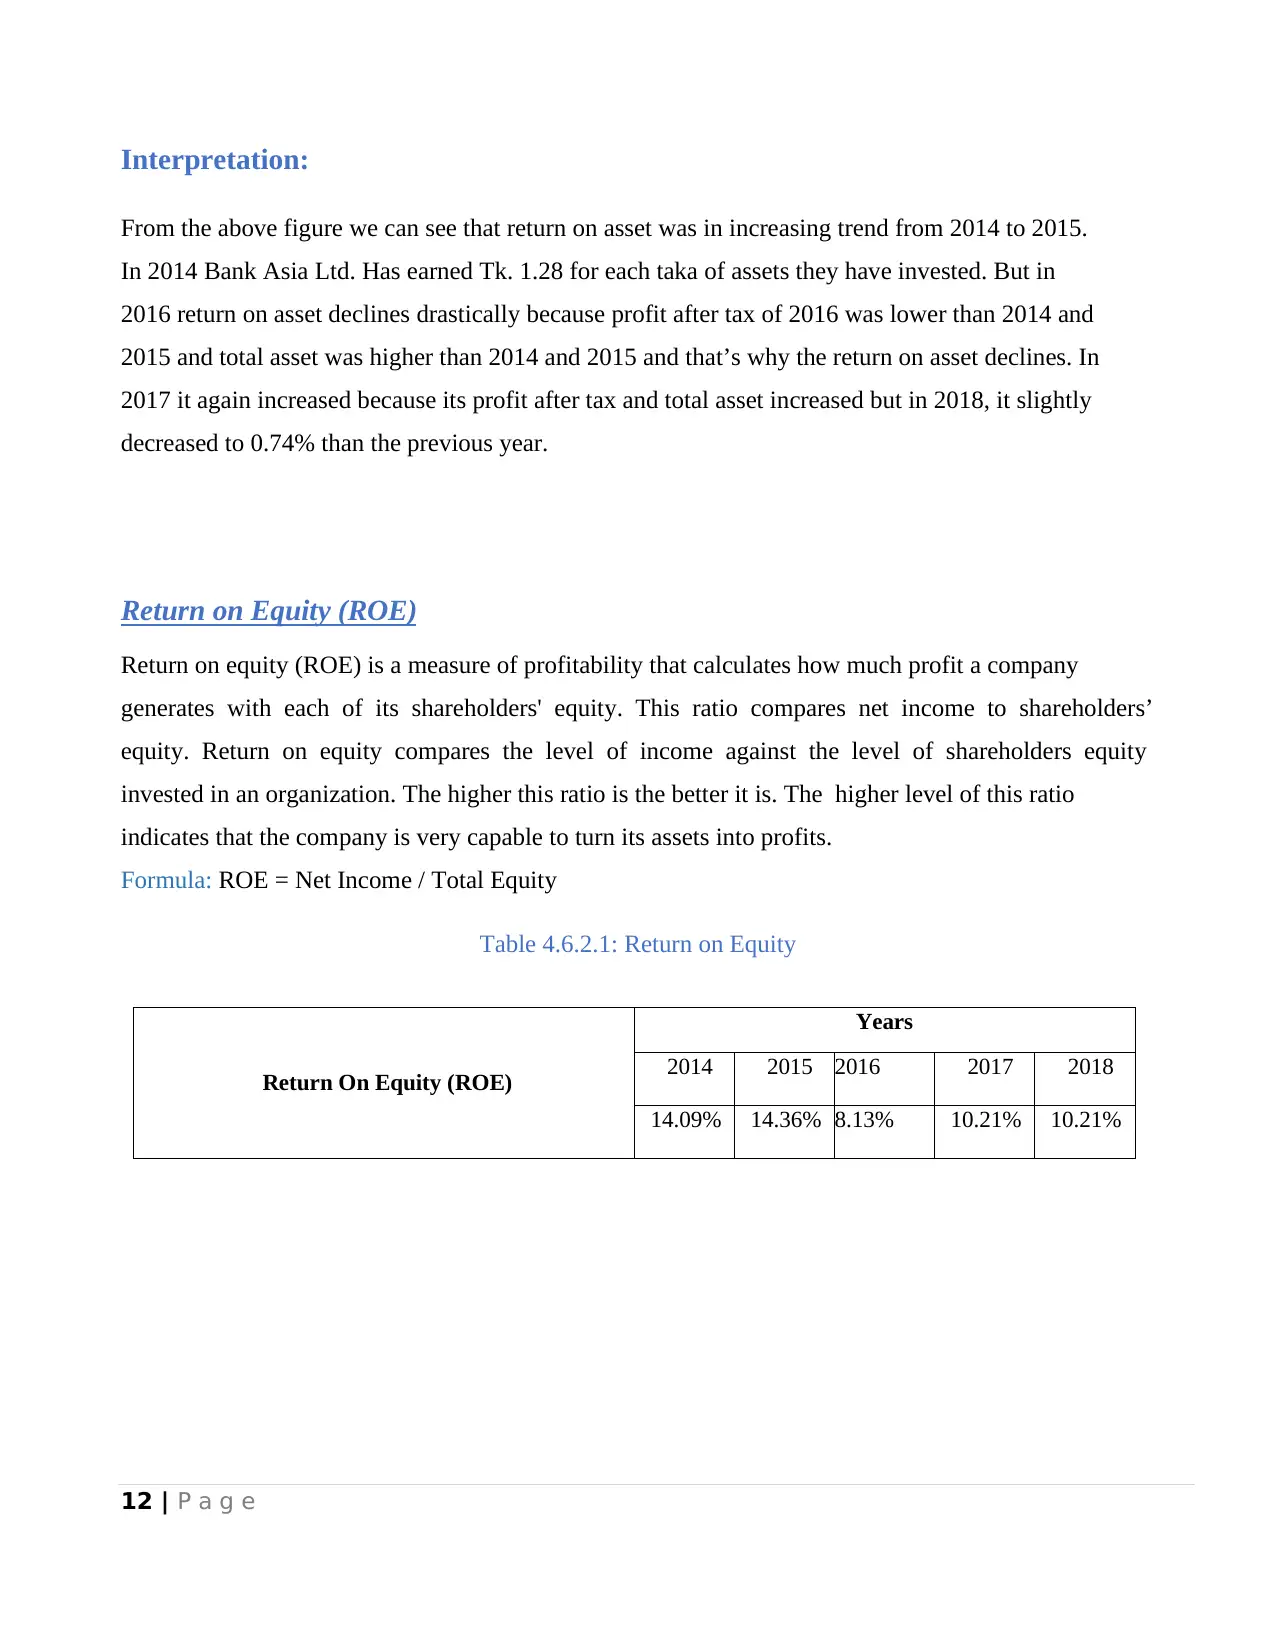
Return on Equity (ROE)
Return on equity (ROE) is a measure of profitability that calculates how much profit a company
generates with each of its shareholders' equity. This ratio compares net income to shareholders’
equity. Return on equity compares the level of income against the level of shareholders equity
invested in an organization. The higher this ratio is the better it is. The higher level of this ratio
indicates that the company is very capable to turn its assets into profits.
Formula: ROE = Net Income / Total Equity
Table 4.6.2.1: Return on Equity
Return On Equity (ROE)
Years
2014 2015 2016 2017 2018
14.09% 14.36% 8.13% 10.21% 10.21%
Interpretation:
From the above figure we can see that return on asset was in increasing trend from 2014 to 2015.
In 2014 Bank Asia Ltd. Has earned Tk. 1.28 for each taka of assets they have invested. But in
2016 return on asset declines drastically because profit after tax of 2016 was lower than 2014 and
2015 and total asset was higher than 2014 and 2015 and that’s why the return on asset declines. In
2017 it again increased because its profit after tax and total asset increased but in 2018, it slightly
decreased to 0.74% than the previous year.
Return on Equity (ROE)
Return on equity (ROE) is a measure of profitability that calculates how much profit a company
generates with each of its shareholders' equity. This ratio compares net income to shareholders’
equity. Return on equity compares the level of income against the level of shareholders equity
invested in an organization. The higher this ratio is the better it is. The higher level of this ratio
indicates that the company is very capable to turn its assets into profits.
Formula: ROE = Net Income / Total Equity
Table 4.6.2.1: Return on Equity
Return On Equity (ROE)
Years
2014 2015 2016 2017 2018
14.09% 14.36% 8.13% 10.21% 10.21%
⊘ This is a preview!⊘
Do you want full access?
Subscribe today to unlock all pages.
Trusted by 1+ million students worldwide
1 out of 27
Your All-in-One AI-Powered Toolkit for Academic Success.
+13062052269
info@desklib.com
Available 24*7 on WhatsApp / Email
![[object Object]](/_next/static/media/star-bottom.7253800d.svg)
Unlock your academic potential
Copyright © 2020–2026 A2Z Services. All Rights Reserved. Developed and managed by ZUCOL.