FINM036: Detailed Financial Analysis of Banyan Tree Holding Limited
VerifiedAdded on 2023/06/05
|18
|4350
|500
Report
AI Summary
This report provides a financial analysis of Banyan Tree Holding Limited, comparing its performance with Mantra Group Limited. It includes vertical and horizontal analyses of the income statement and balance sheet from 2013 to 2017, examining key financial ratios such as profitability, dividend, and liquidity ratios. The analysis identifies the company's profit trends, noting a significant improvement in 2017 compared to a loss in 2016, attributed to increased revenue and reduced expenses. The report also touches on the economic conditions impacting the hotel industry and assesses Banyan Tree's financial health relative to its competitor, Mantra Group, highlighting differences in profitability and shareholder returns.

FINM036 Assessment Two
Paraphrase This Document
Need a fresh take? Get an instant paraphrase of this document with our AI Paraphraser
TABLE OF CONTENTS
Section A....................................................................................................................................3
Company selected..................................................................................................................3
Introduction............................................................................................................................3
Vertical analysis of Banyan Tree Holding limited.................................................................4
Horizontal analysis of Banyan Tree Holding limited............................................................6
Identification of profits..........................................................................................................9
Profits of Banyan Tree Holding Limited...........................................................................9
The economic condition of the hotel Industries.................................................................9
Ratio analysis.........................................................................................................................9
Share analysis.......................................................................................................................12
Non-financial parameters.....................................................................................................14
Section B..................................................................................................................................14
Conclusion................................................................................................................................16
References................................................................................................................................17
SECTION A
Company selected
Banyan Tree Holding Limited
Introduction
Banyan Tree Holding Limited was established in 1994 and headquarter of the company is
situated in Singapore, since then it is the one of the leading company, which is recognized
globally. The company expanded its operation worldwide such as in China, India, Thailand,
Indonesia etc. The company is primarily engaged in the developing and managing the hotels,
resorts and spa. Further, the activities of the company are comprised with the three main
segments. The name of the first segment is hotel investment segment, which is basically
engaged in the investment in the hotel, the second segment of the company is property sale
segment, which is engaged in the sale of the development project and sites or the sale of the
service apartment and the hotels. The last segment of the company is a Fee-based segment, in
this segment operations related to the hotel management, club management, innovative
designs for the spa and gallery are included.
Further for the better understanding of the financial position of the Banyan Tree Holding
Limited, comparison with the Mantra group limited also stated in this study. Mantra Group
limited is the Australian based company which is engaged in the investment and the
development of the hotel industries worldwide.
⊘ This is a preview!⊘
Do you want full access?
Subscribe today to unlock all pages.
Trusted by 1+ million students worldwide
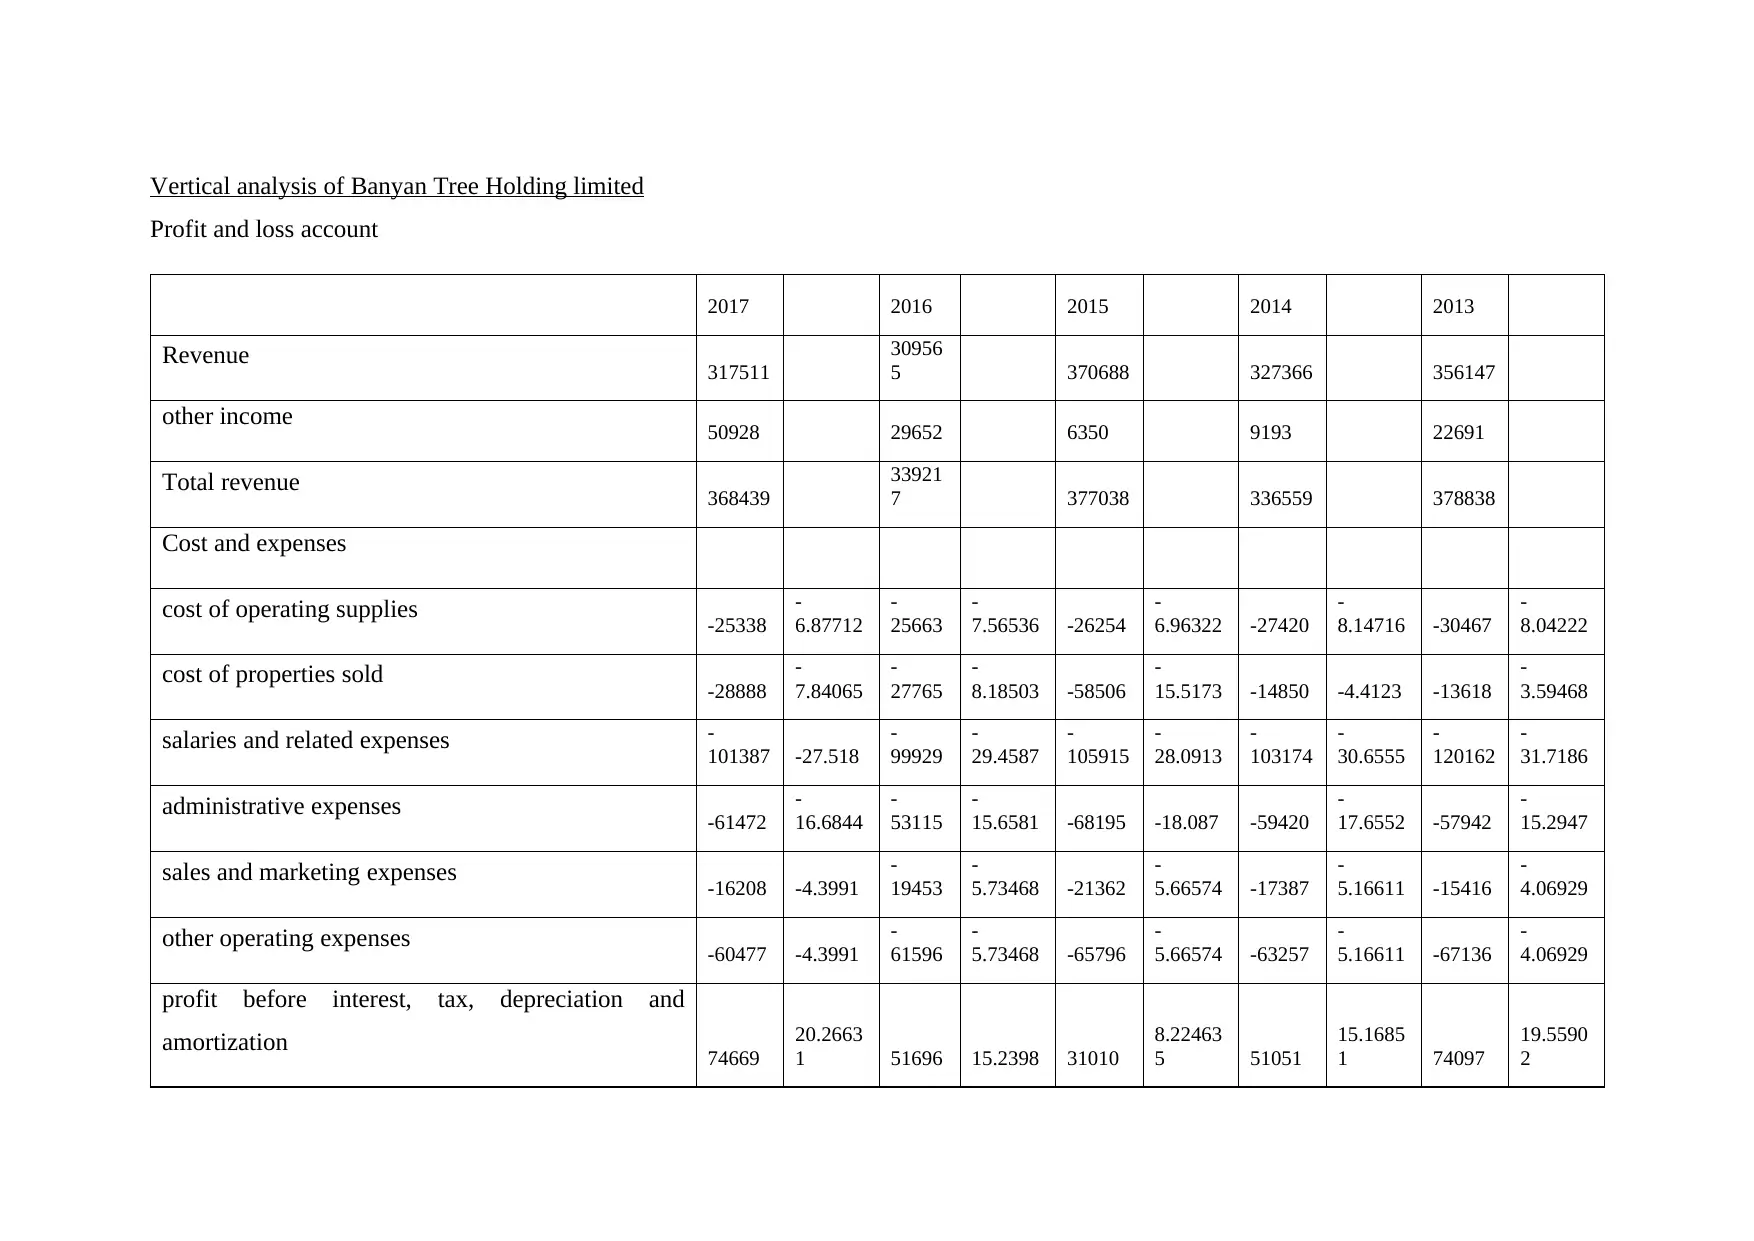
Vertical analysis of Banyan Tree Holding limited
Profit and loss account
2017 2016 2015 2014 2013
Revenue 317511
30956
5 370688 327366 356147
other income 50928 29652 6350 9193 22691
Total revenue 368439
33921
7 377038 336559 378838
Cost and expenses
cost of operating supplies -25338
-
6.87712
-
25663
-
7.56536 -26254
-
6.96322 -27420
-
8.14716 -30467
-
8.04222
cost of properties sold -28888
-
7.84065
-
27765
-
8.18503 -58506
-
15.5173 -14850 -4.4123 -13618
-
3.59468
salaries and related expenses -
101387 -27.518
-
99929
-
29.4587
-
105915
-
28.0913
-
103174
-
30.6555
-
120162
-
31.7186
administrative expenses -61472
-
16.6844
-
53115
-
15.6581 -68195 -18.087 -59420
-
17.6552 -57942
-
15.2947
sales and marketing expenses -16208 -4.3991
-
19453
-
5.73468 -21362
-
5.66574 -17387
-
5.16611 -15416
-
4.06929
other operating expenses -60477 -4.3991
-
61596
-
5.73468 -65796
-
5.66574 -63257
-
5.16611 -67136
-
4.06929
profit before interest, tax, depreciation and
amortization 74669
20.2663
1 51696 15.2398 31010
8.22463
5 51051
15.1685
1 74097
19.5590
2
Paraphrase This Document
Need a fresh take? Get an instant paraphrase of this document with our AI Paraphraser
depreciation of property, plant and equipment -22515
-
6.11092
-
22341
-
6.58605 -21826
-
5.78881 -19520
-
5.79987 -19762
-
5.21648
Amortization expenses -2599
-
0.70541 -2722
-
0.80244 -2882
-
0.76438 -2350
-
0.69824 -2694
-
0.71112
profit from operations and other gain 49555
13.4499
9 26633
7.85131
6 6302 1.67145 29181
8.67039
7 51641
13.6314
2
financial income 2571
0.69780
9 3674
1.08308
3 2351
0.62354
5 3402
1.01081
8 2749 0.72564
finance cost -28181
-
7.64876
-
29630
-
8.73482 -28083
-
7.44832 -25451
-
7.56212 -23296
-
6.14933
Share of results of associates 346 0.09391 33
0.00972
8 -35
-
0.00928 31
0.00921
1 22
0.00580
7
share of results of joint venture -1632
-
0.44295 0 0 0 0 0 0 0 0
profit before taxation 22659 6.15 710
0.20930
6 -19465
-
5.16261 7163
2.12830
4 31116
8.21353
7
income tax expenses -7802
-
2.11758 -7660
-
2.25814 -6495
-
1.72264 -6564
-
1.95033 -12961
-
3.42125
profit/loss after taxation 14857
4.03241
8 -6950
-
2.04884 -25960
-
6.88525 599
0.17797
8 18155
4.79228
6
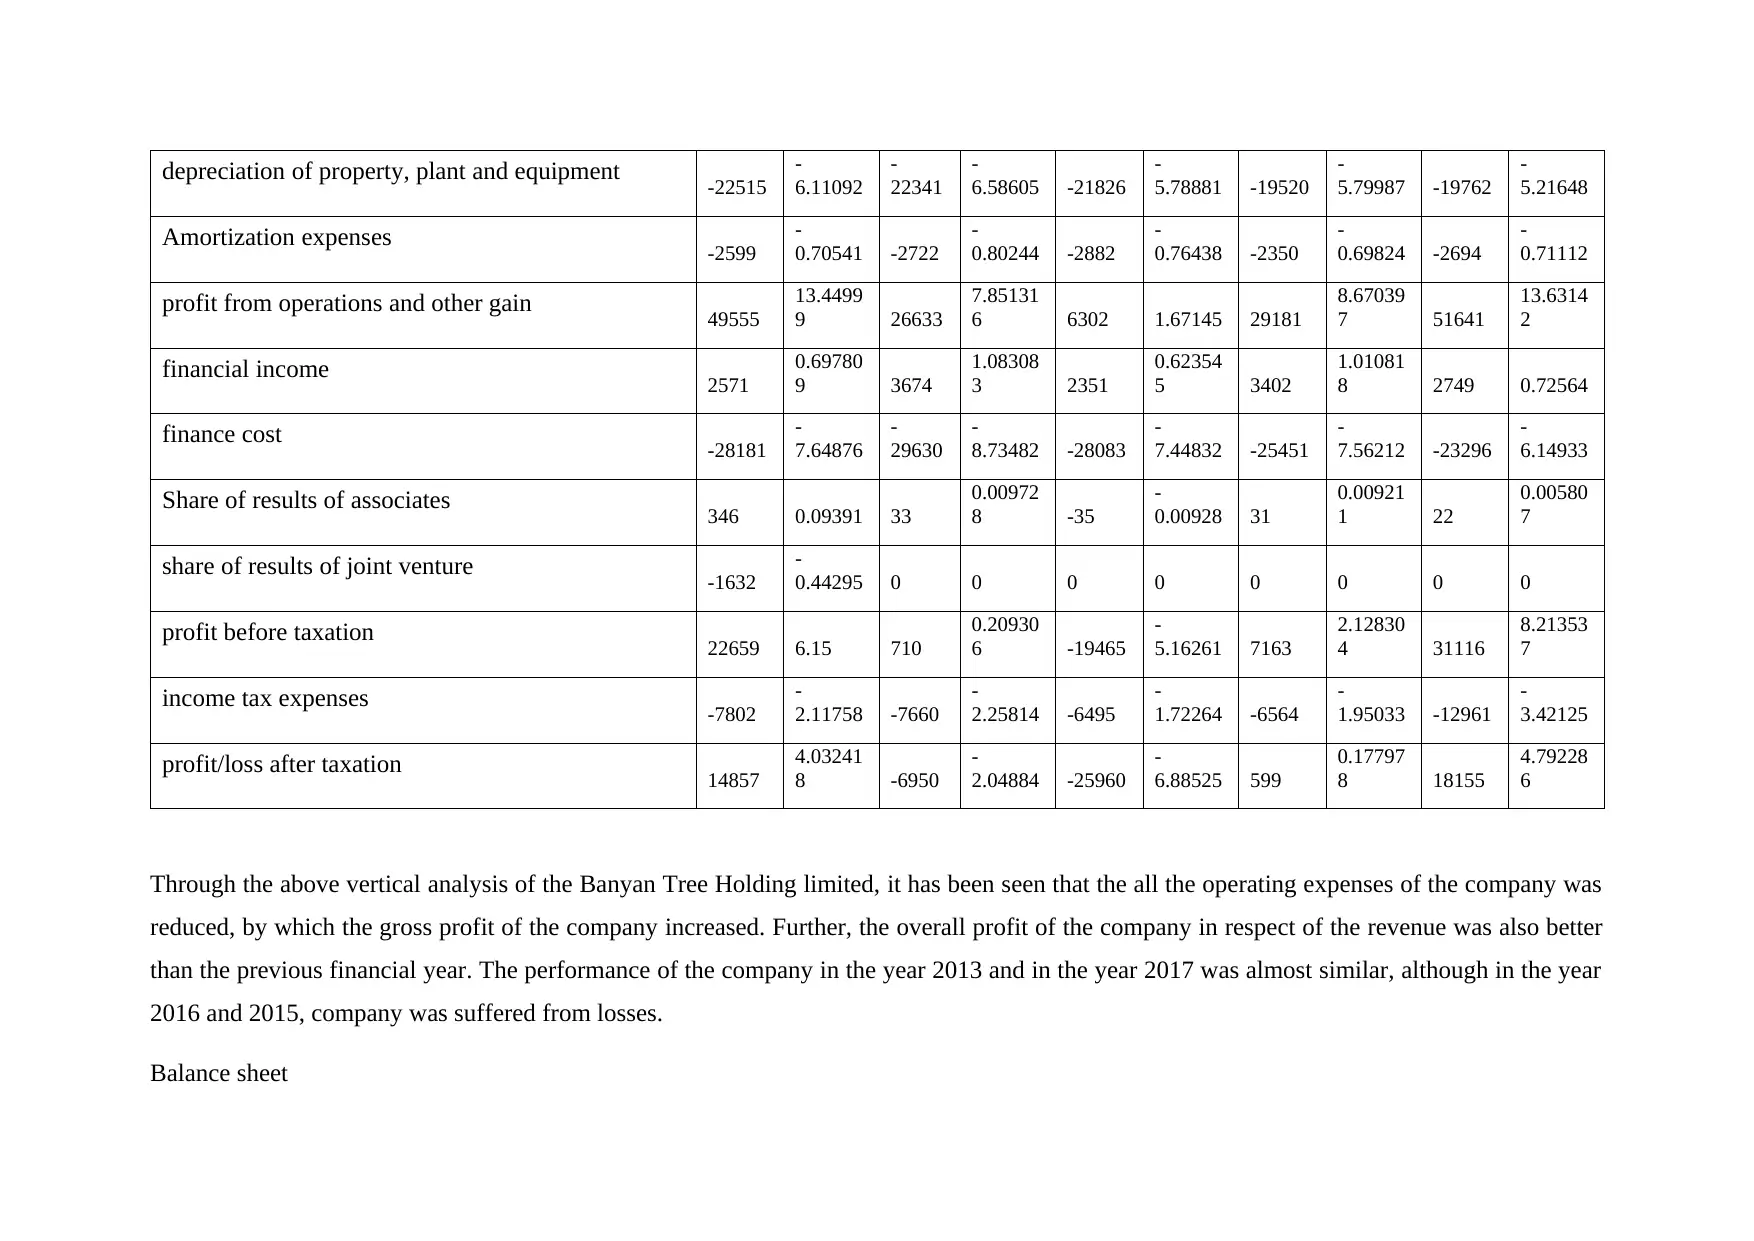
Through the above vertical analysis of the Banyan Tree Holding limited, it has been seen that the all the operating expenses of the company was
reduced, by which the gross profit of the company increased. Further, the overall profit of the company in respect of the revenue was also better
than the previous financial year. The performance of the company in the year 2013 and in the year 2017 was almost similar, although in the year
2016 and 2015, company was suffered from losses.
Balance sheet
-
6.11092
-
22341
-
6.58605 -21826
-
5.78881 -19520
-
5.79987 -19762
-
5.21648
Amortization expenses -2599
-
0.70541 -2722
-
0.80244 -2882
-
0.76438 -2350
-
0.69824 -2694
-
0.71112
profit from operations and other gain 49555
13.4499
9 26633
7.85131
6 6302 1.67145 29181
8.67039
7 51641
13.6314
2
financial income 2571
0.69780
9 3674
1.08308
3 2351
0.62354
5 3402
1.01081
8 2749 0.72564
finance cost -28181
-
7.64876
-
29630
-
8.73482 -28083
-
7.44832 -25451
-
7.56212 -23296
-
6.14933
Share of results of associates 346 0.09391 33
0.00972
8 -35
-
0.00928 31
0.00921
1 22
0.00580
7
share of results of joint venture -1632
-
0.44295 0 0 0 0 0 0 0 0
profit before taxation 22659 6.15 710
0.20930
6 -19465
-
5.16261 7163
2.12830
4 31116
8.21353
7
income tax expenses -7802
-
2.11758 -7660
-
2.25814 -6495
-
1.72264 -6564
-
1.95033 -12961
-
3.42125
profit/loss after taxation 14857
4.03241
8 -6950
-
2.04884 -25960
-
6.88525 599
0.17797
8 18155
4.79228
6
Through the above vertical analysis of the Banyan Tree Holding limited, it has been seen that the all the operating expenses of the company was
reduced, by which the gross profit of the company increased. Further, the overall profit of the company in respect of the revenue was also better
than the previous financial year. The performance of the company in the year 2013 and in the year 2017 was almost similar, although in the year
2016 and 2015, company was suffered from losses.
Balance sheet
2017 2016 2015 2014 2013
Non-Current Assets
106975
1
63.6852
5 956024
59.4460
2 958803
60.1893
4 931223
62.2892
9 894381 64.3913
Current Assets 609996
36.3147
5 652198
40.5539
8 634175
39.8106
6 563774
37.7107
1 494597 35.6087
Total Assets
167974
7
160822
2
159297
8
149499
7
138897
8
Non-Current Liabilities 494626
29.4464
6 594183
36.9465
8 678563
42.5971
4 552545
36.9596
1 444015
31.9670
3
Current Liabilities 407585
24.2646
7 281193
17.4847
1 214954
13.4938
5 215148 14.3912 249015
17.9279
3
Total Liabilities 902211
53.7111
2 875376
54.4312
9 893517
56.0909
8 770693
51.5514
7 693030
49.8949
6
Total Equity 777536
46.2888
8 732846
45.5687
1 699461
43.9090
2 724304
48.4485
3 695948
50.1050
4
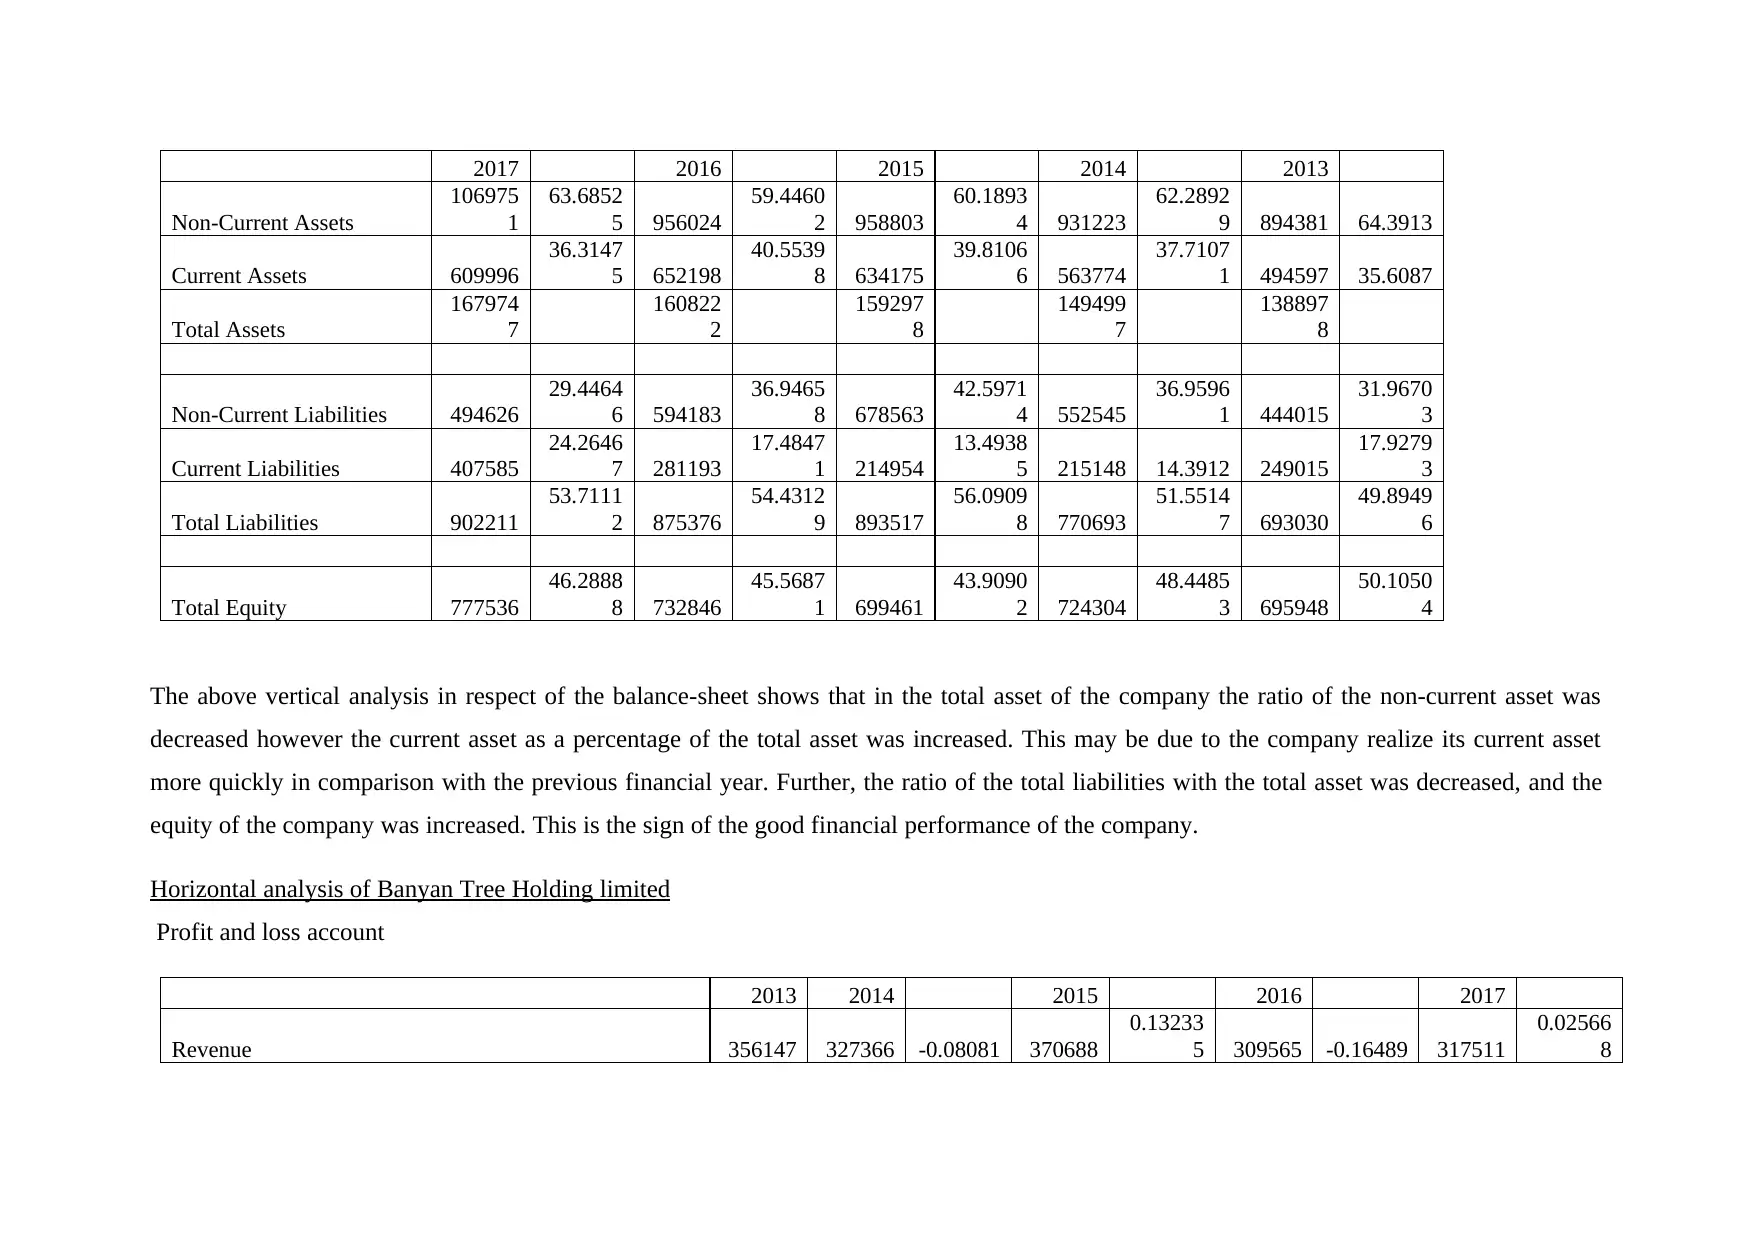
The above vertical analysis in respect of the balance-sheet shows that in the total asset of the company the ratio of the non-current asset was
decreased however the current asset as a percentage of the total asset was increased. This may be due to the company realize its current asset
more quickly in comparison with the previous financial year. Further, the ratio of the total liabilities with the total asset was decreased, and the
equity of the company was increased. This is the sign of the good financial performance of the company.
Horizontal analysis of Banyan Tree Holding limited
Profit and loss account
2013 2014 2015 2016 2017
Revenue 356147 327366 -0.08081 370688
0.13233
5 309565 -0.16489 317511
0.02566
8
Non-Current Assets
106975
1
63.6852
5 956024
59.4460
2 958803
60.1893
4 931223
62.2892
9 894381 64.3913
Current Assets 609996
36.3147
5 652198
40.5539
8 634175
39.8106
6 563774
37.7107
1 494597 35.6087
Total Assets
167974
7
160822
2
159297
8
149499
7
138897
8
Non-Current Liabilities 494626
29.4464
6 594183
36.9465
8 678563
42.5971
4 552545
36.9596
1 444015
31.9670
3
Current Liabilities 407585
24.2646
7 281193
17.4847
1 214954
13.4938
5 215148 14.3912 249015
17.9279
3
Total Liabilities 902211
53.7111
2 875376
54.4312
9 893517
56.0909
8 770693
51.5514
7 693030
49.8949
6
Total Equity 777536
46.2888
8 732846
45.5687
1 699461
43.9090
2 724304
48.4485
3 695948
50.1050
4
The above vertical analysis in respect of the balance-sheet shows that in the total asset of the company the ratio of the non-current asset was
decreased however the current asset as a percentage of the total asset was increased. This may be due to the company realize its current asset
more quickly in comparison with the previous financial year. Further, the ratio of the total liabilities with the total asset was decreased, and the
equity of the company was increased. This is the sign of the good financial performance of the company.
Horizontal analysis of Banyan Tree Holding limited
Profit and loss account
2013 2014 2015 2016 2017
Revenue 356147 327366 -0.08081 370688
0.13233
5 309565 -0.16489 317511
0.02566
8
⊘ This is a preview!⊘
Do you want full access?
Subscribe today to unlock all pages.
Trusted by 1+ million students worldwide
other income 22691 9193 -0.59486 6350 -0.30926 29652
3.66960
6 50928
0.71752
3
Total revenue 378838 336559 -0.1116 377038
0.12027
3 339217 -0.10031 368439
0.08614
5
Cost and expenses
cost of operating supplies -30467 -27420 -0.10001 -26254 -0.04252 -25663 -0.02251 -25338 -0.01266
cost of properties sold -13618 -14850
0.09046
8 -58506
2.93979
8 -27765 -0.52543 -28888
0.04044
7
salaries and related expenses
-
120162
-
103174 -0.14138
-
105915
0.02656
7 -99929 -0.05652
-
101387 0.01459
administrative expenses -57942 -59420
0.02550
8 -68195
0.14767
8 -53115 -0.22113 -61472
0.15733
8
sales and marketing expenses -15416 -17387
0.12785
4 -21362
0.22861
9 -19453 -0.08936 -16208 -0.16681
other operating expenses -67136 -63257 -0.05778 -65796
0.04013
8 -61596 -0.06383 -60477 -0.01817
profit before interest, tax, depreciation and amortization 74097 51051 -0.31102 31010 -0.39257 51696
0.66707
5 74669
0.44438
6
depreciation of property, plant and equipment -19762 -19520 -0.01225 -21826
0.11813
5 -22341
0.02359
6 -22515
0.00778
8
Amortization expenses -2694 -2350 -0.12769 -2882
0.22638
3 -2722 -0.05552 -2599 -0.04519
profit from operations and other gain 51641 29181 -0.43493 6302 -0.78404 26633
3.22611
9 49555
0.86066
2
financial income 2749 3402
0.23754
1 2351 -0.30894 3674
0.56273
9 2571 -0.30022
finance cost -23296 -25451
0.09250
5 -28083
0.10341
4 -29630
0.05508
7 -28181 -0.0489
Share of results of associates 22 31
0.40909
1 -35 -2.12903 33 -1.94286 346
9.48484
8
share of results of joint venture 0 0 0 0 0 0 0 -1632 0
profit before taxation 31116 7163 -0.7698 -19465 -3.71744 710 -1.03648 22659
30.9140
8
income tax expenses -12961 -6564 -0.49356 -6495 -0.01051 -7660 0.17936 -7802 0.01853
Paraphrase This Document
Need a fresh take? Get an instant paraphrase of this document with our AI Paraphraser
9 8
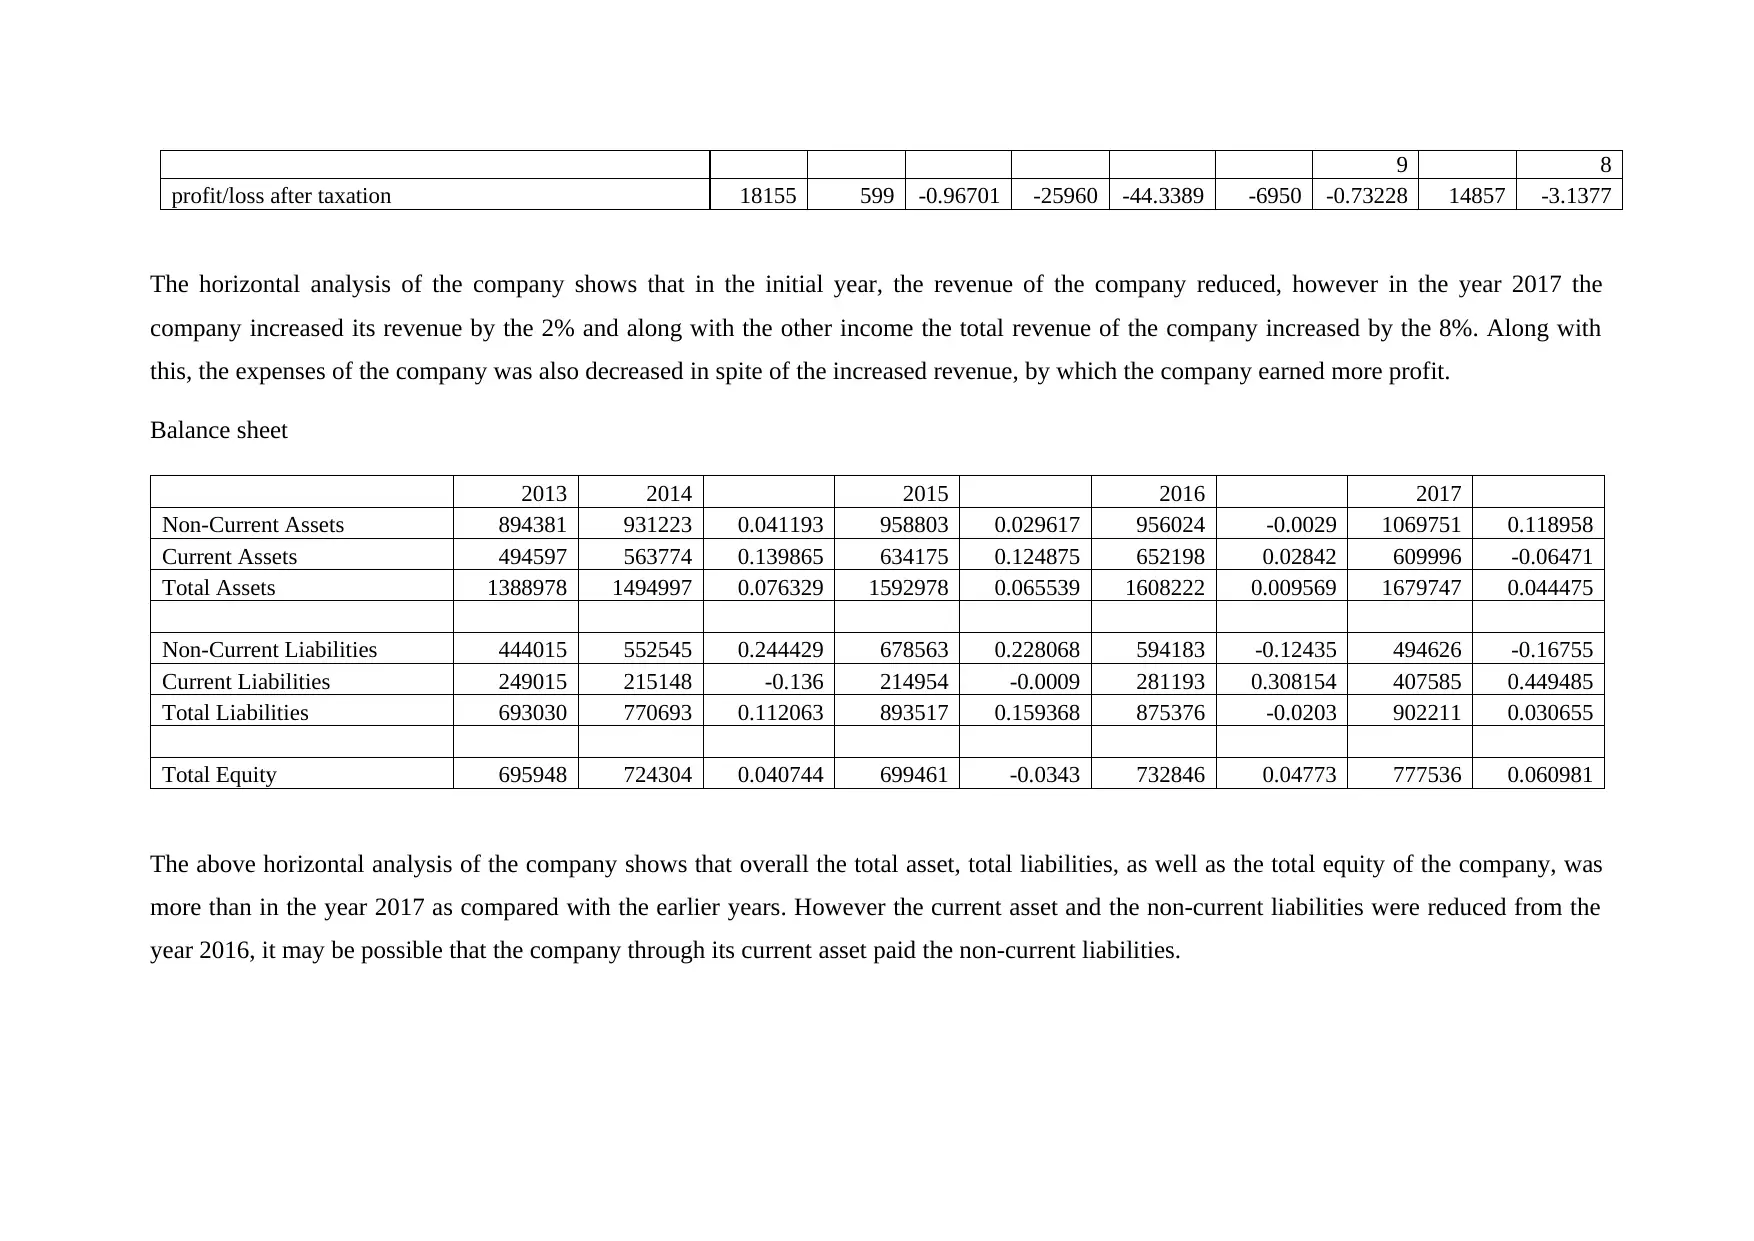
profit/loss after taxation 18155 599 -0.96701 -25960 -44.3389 -6950 -0.73228 14857 -3.1377
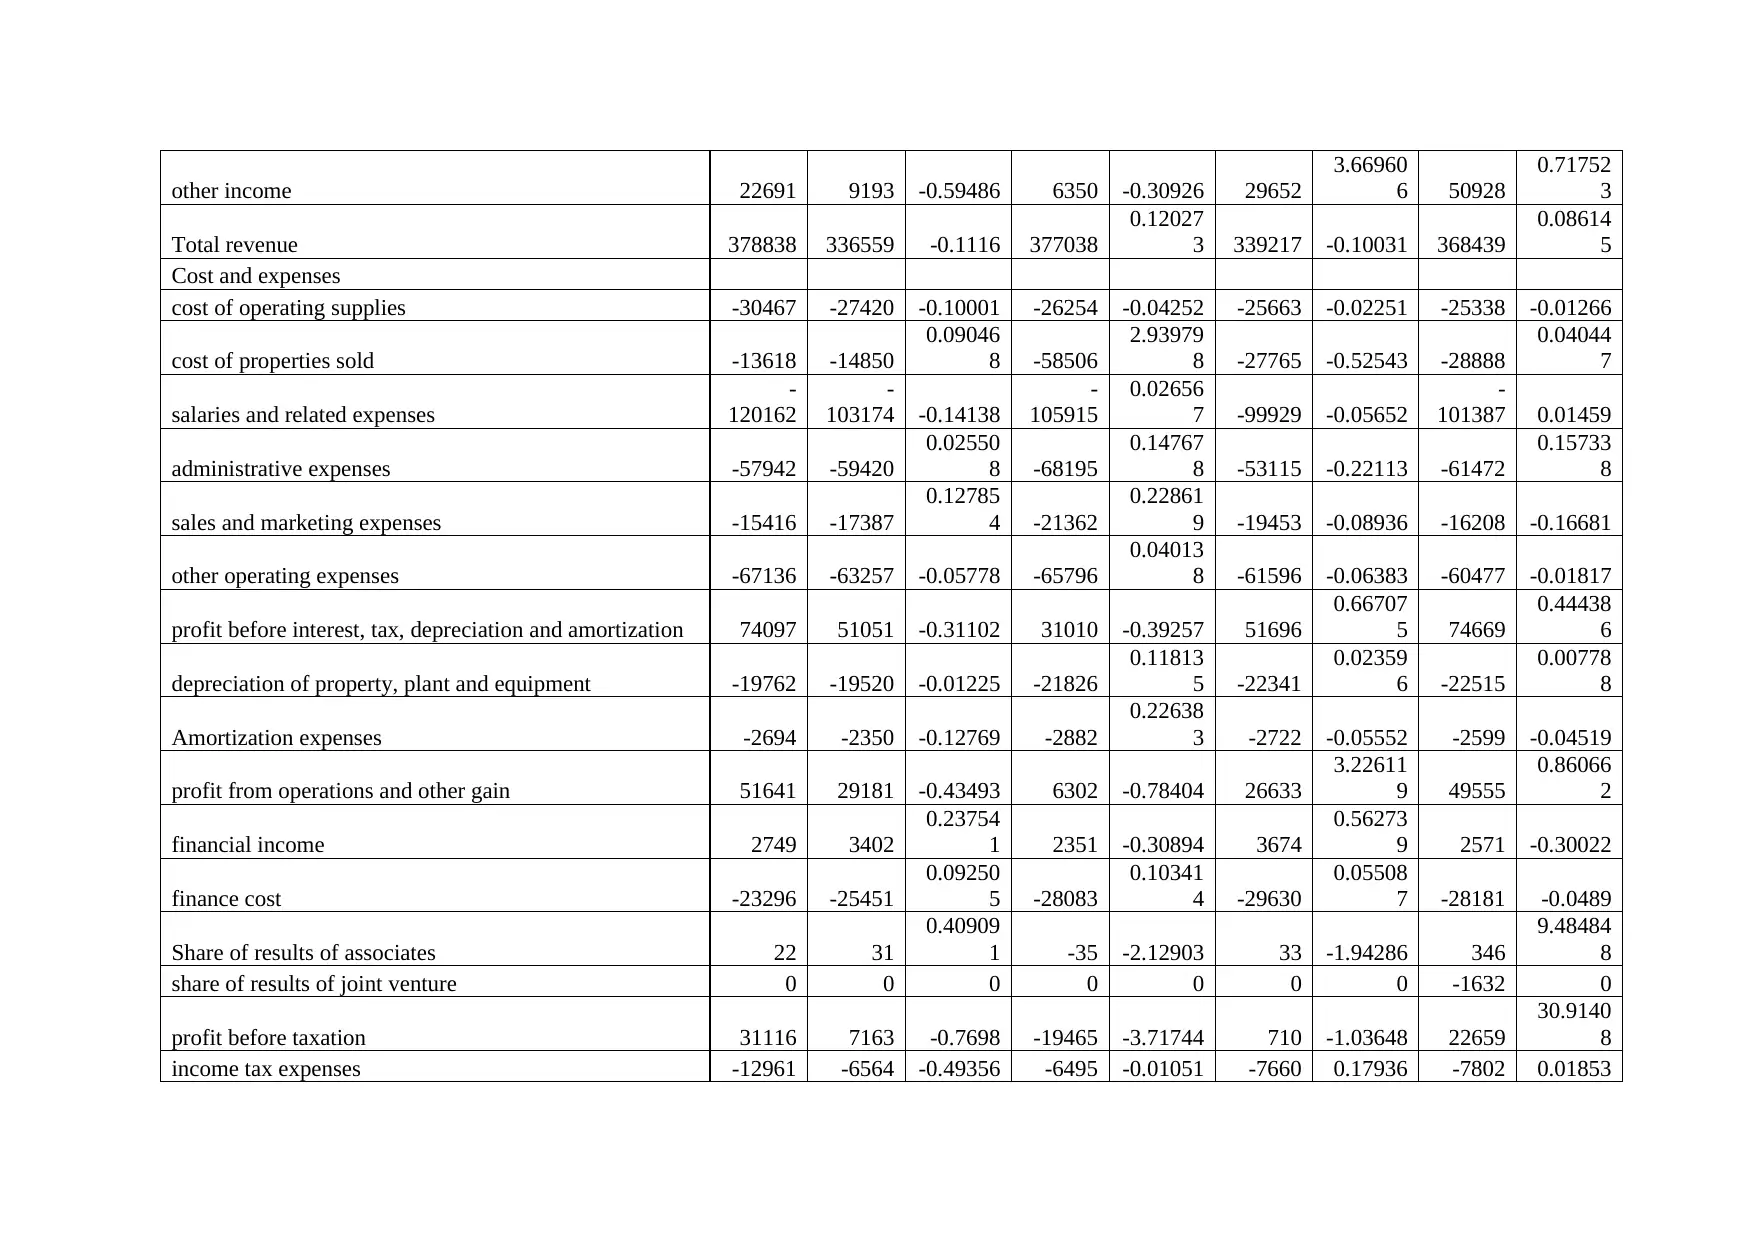
The horizontal analysis of the company shows that in the initial year, the revenue of the company reduced, however in the year 2017 the
company increased its revenue by the 2% and along with the other income the total revenue of the company increased by the 8%. Along with
this, the expenses of the company was also decreased in spite of the increased revenue, by which the company earned more profit.
Balance sheet
2013 2014 2015 2016 2017
Non-Current Assets 894381 931223 0.041193 958803 0.029617 956024 -0.0029 1069751 0.118958
Current Assets 494597 563774 0.139865 634175 0.124875 652198 0.02842 609996 -0.06471
Total Assets 1388978 1494997 0.076329 1592978 0.065539 1608222 0.009569 1679747 0.044475
Non-Current Liabilities 444015 552545 0.244429 678563 0.228068 594183 -0.12435 494626 -0.16755
Current Liabilities 249015 215148 -0.136 214954 -0.0009 281193 0.308154 407585 0.449485
Total Liabilities 693030 770693 0.112063 893517 0.159368 875376 -0.0203 902211 0.030655
Total Equity 695948 724304 0.040744 699461 -0.0343 732846 0.04773 777536 0.060981
The above horizontal analysis of the company shows that overall the total asset, total liabilities, as well as the total equity of the company, was
more than in the year 2017 as compared with the earlier years. However the current asset and the non-current liabilities were reduced from the
year 2016, it may be possible that the company through its current asset paid the non-current liabilities.
profit/loss after taxation 18155 599 -0.96701 -25960 -44.3389 -6950 -0.73228 14857 -3.1377
The horizontal analysis of the company shows that in the initial year, the revenue of the company reduced, however in the year 2017 the
company increased its revenue by the 2% and along with the other income the total revenue of the company increased by the 8%. Along with
this, the expenses of the company was also decreased in spite of the increased revenue, by which the company earned more profit.
Balance sheet
2013 2014 2015 2016 2017
Non-Current Assets 894381 931223 0.041193 958803 0.029617 956024 -0.0029 1069751 0.118958
Current Assets 494597 563774 0.139865 634175 0.124875 652198 0.02842 609996 -0.06471
Total Assets 1388978 1494997 0.076329 1592978 0.065539 1608222 0.009569 1679747 0.044475
Non-Current Liabilities 444015 552545 0.244429 678563 0.228068 594183 -0.12435 494626 -0.16755
Current Liabilities 249015 215148 -0.136 214954 -0.0009 281193 0.308154 407585 0.449485
Total Liabilities 693030 770693 0.112063 893517 0.159368 875376 -0.0203 902211 0.030655
Total Equity 695948 724304 0.040744 699461 -0.0343 732846 0.04773 777536 0.060981
The above horizontal analysis of the company shows that overall the total asset, total liabilities, as well as the total equity of the company, was
more than in the year 2017 as compared with the earlier years. However the current asset and the non-current liabilities were reduced from the
year 2016, it may be possible that the company through its current asset paid the non-current liabilities.
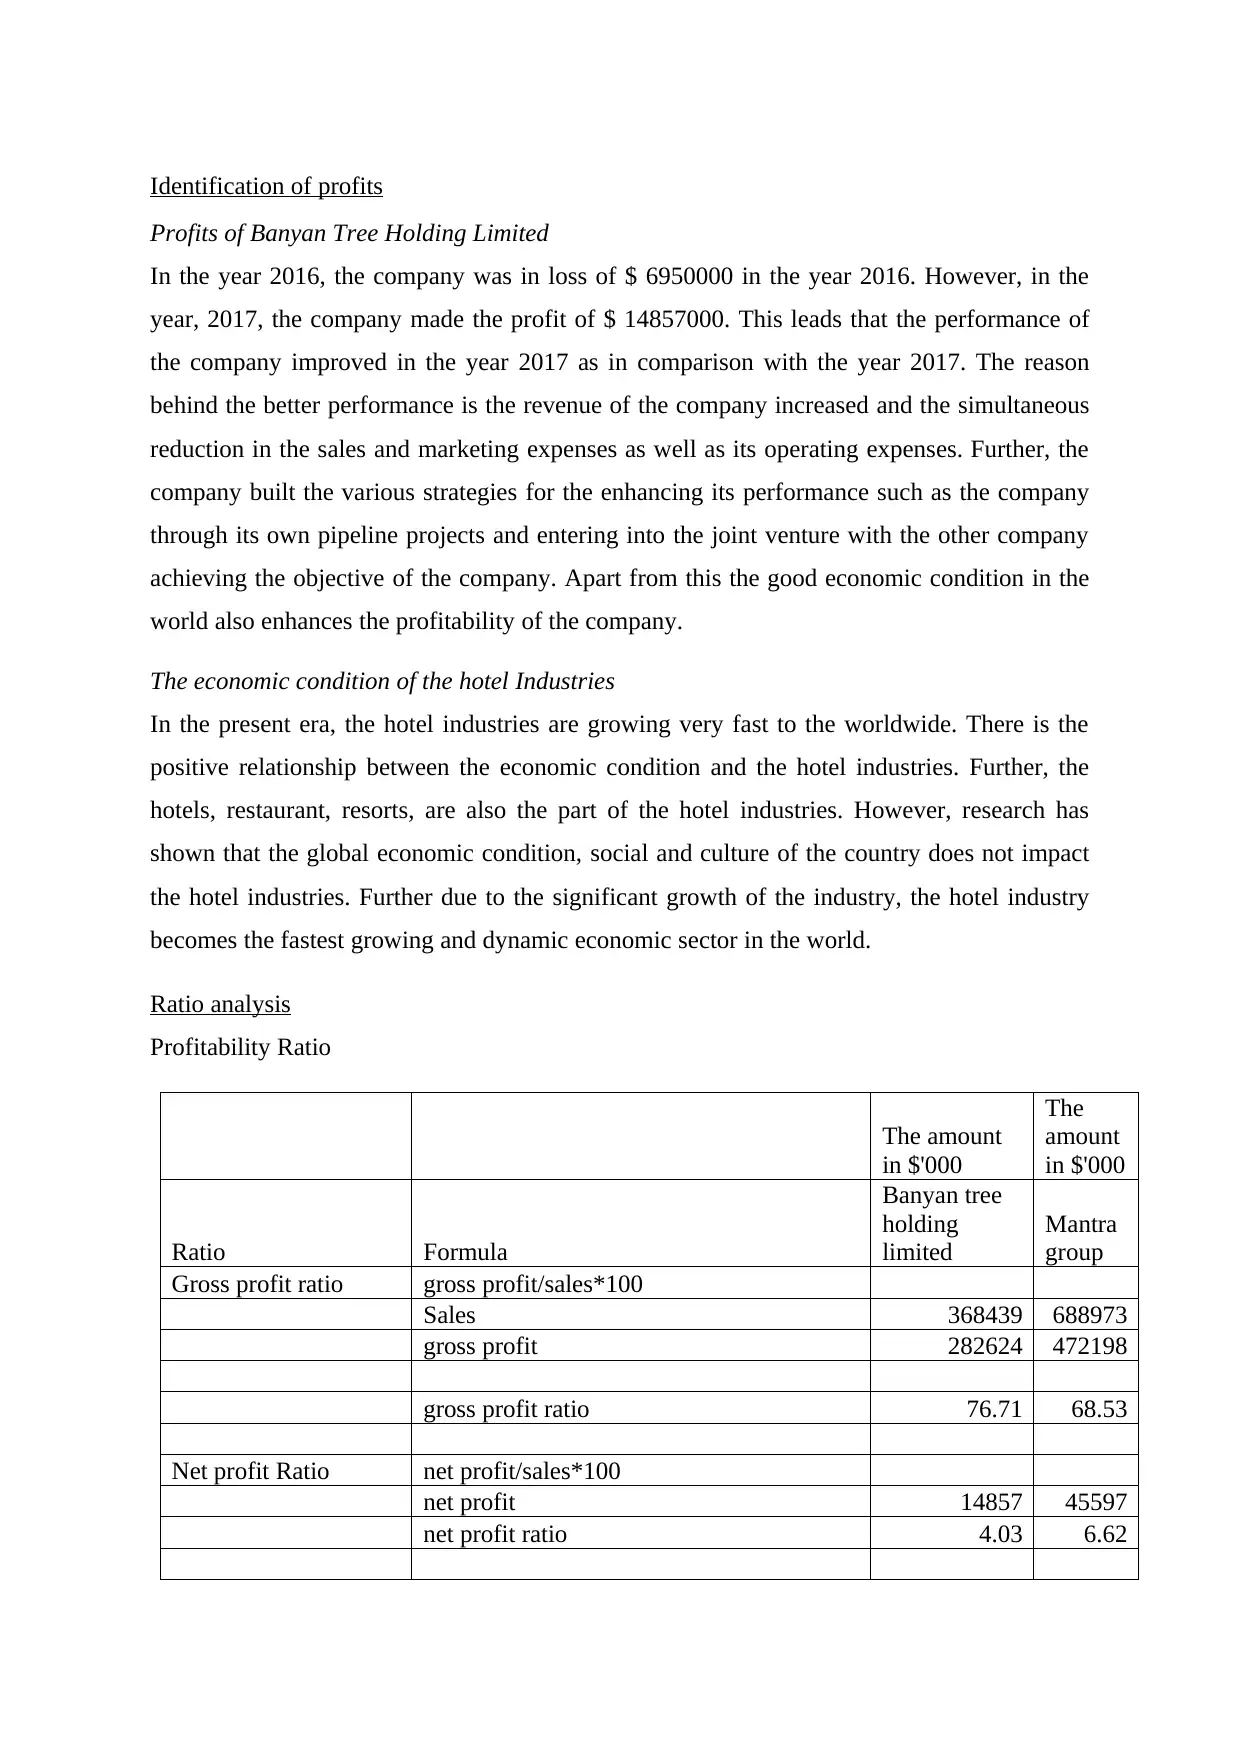
Identification of profits
Profits of Banyan Tree Holding Limited
In the year 2016, the company was in loss of $ 6950000 in the year 2016. However, in the
year, 2017, the company made the profit of $ 14857000. This leads that the performance of
the company improved in the year 2017 as in comparison with the year 2017. The reason
behind the better performance is the revenue of the company increased and the simultaneous
reduction in the sales and marketing expenses as well as its operating expenses. Further, the
company built the various strategies for the enhancing its performance such as the company
through its own pipeline projects and entering into the joint venture with the other company
achieving the objective of the company. Apart from this the good economic condition in the
world also enhances the profitability of the company.
The economic condition of the hotel Industries
In the present era, the hotel industries are growing very fast to the worldwide. There is the
positive relationship between the economic condition and the hotel industries. Further, the
hotels, restaurant, resorts, are also the part of the hotel industries. However, research has
shown that the global economic condition, social and culture of the country does not impact
the hotel industries. Further due to the significant growth of the industry, the hotel industry
becomes the fastest growing and dynamic economic sector in the world.
Ratio analysis
Profitability Ratio
The amount
in $'000
The
amount
in $'000
Ratio Formula
Banyan tree
holding
limited
Mantra
group
Gross profit ratio gross profit/sales*100
Sales 368439 688973
gross profit 282624 472198
gross profit ratio 76.71 68.53
Net profit Ratio net profit/sales*100
net profit 14857 45597
net profit ratio 4.03 6.62
⊘ This is a preview!⊘
Do you want full access?
Subscribe today to unlock all pages.
Trusted by 1+ million students worldwide
Return on ordinary
shareholders fund
ratio
net income attributable to equity
shareholders/ equity shareholders
fund*100
net income attributable to equity
shareholders 12929 43707
equity shareholders fund 777536 477948
Return on ordinary shareholders fund ratio 1.66 9.14
Return on Asset ratio Net income/total asset*100
Total asset 1679747 806259
Return on Asset ratio 0.88 5.65
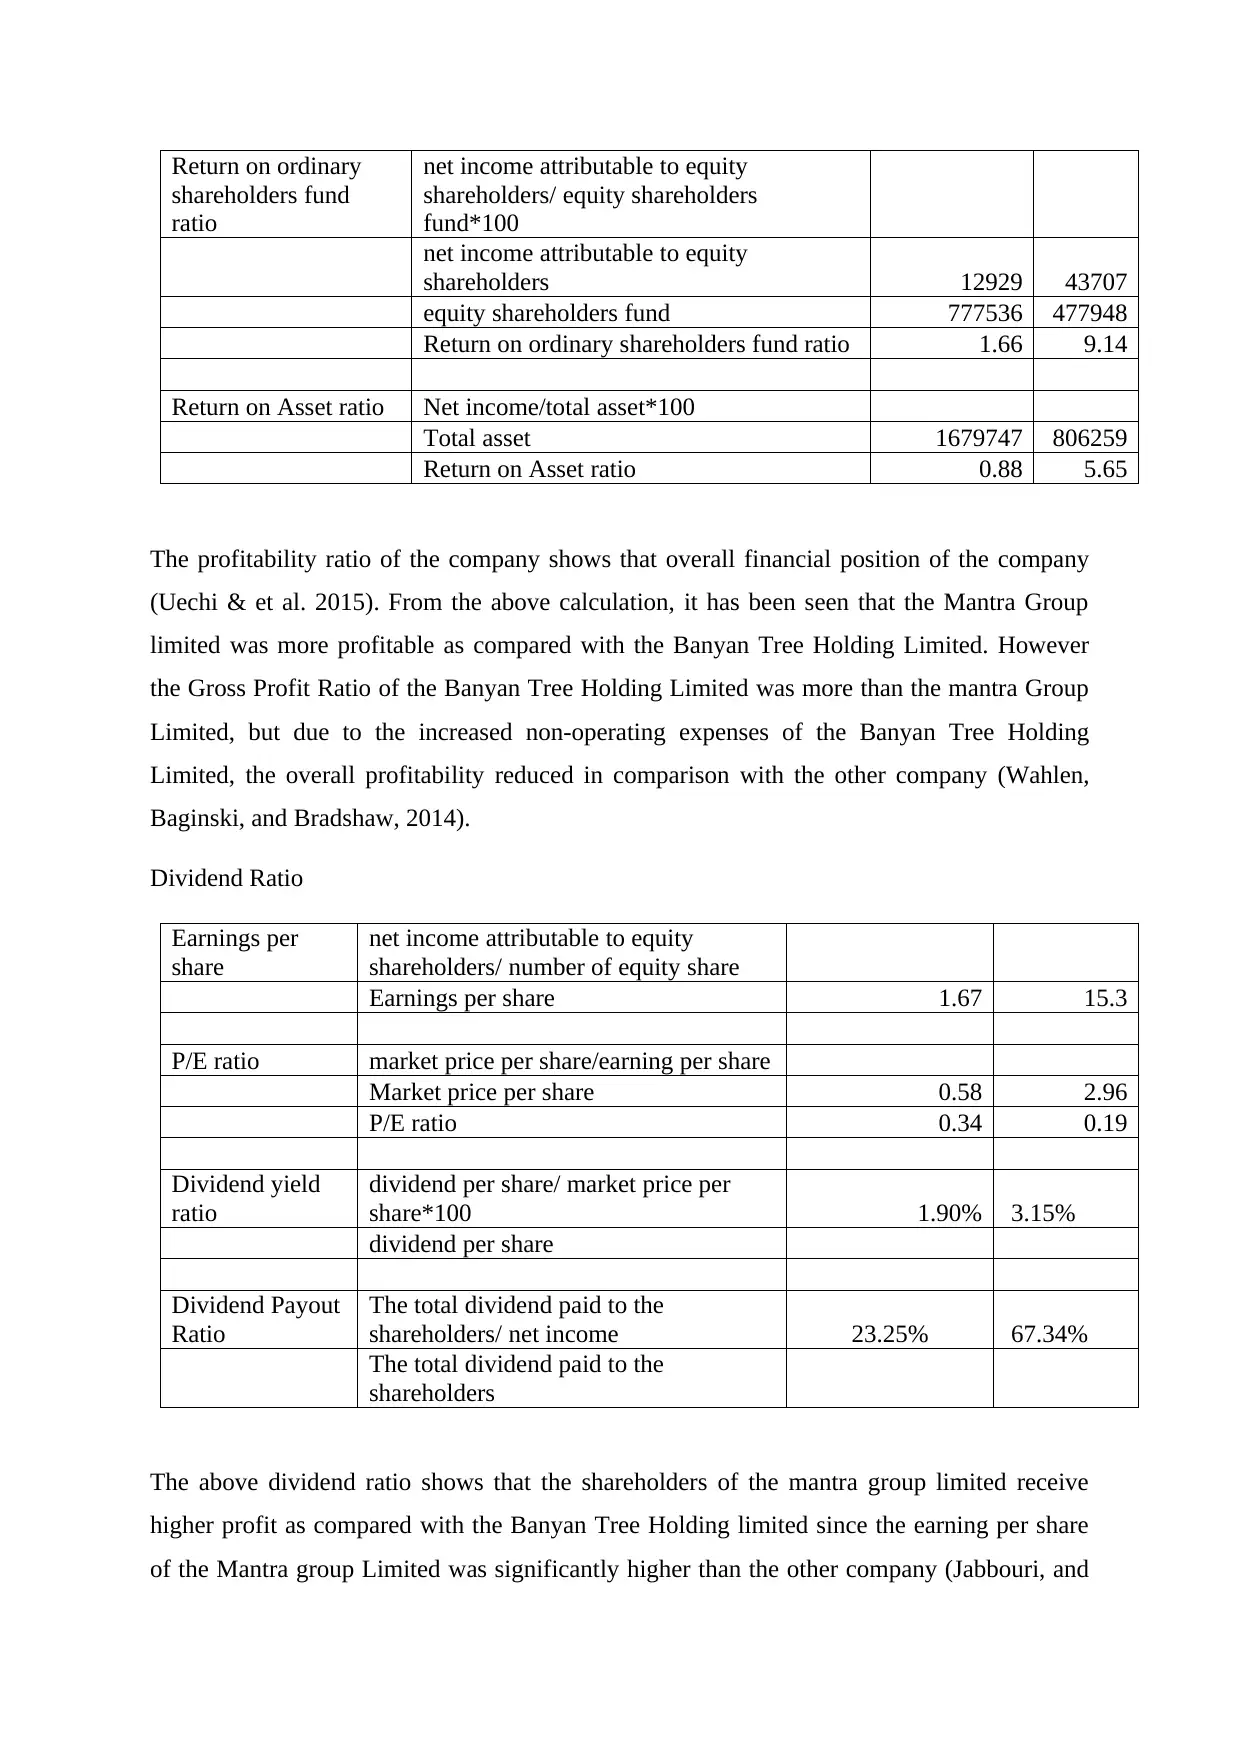
The profitability ratio of the company shows that overall financial position of the company
(Uechi & et al. 2015). From the above calculation, it has been seen that the Mantra Group
limited was more profitable as compared with the Banyan Tree Holding Limited. However
the Gross Profit Ratio of the Banyan Tree Holding Limited was more than the mantra Group
Limited, but due to the increased non-operating expenses of the Banyan Tree Holding
Limited, the overall profitability reduced in comparison with the other company (Wahlen,
Baginski, and Bradshaw, 2014).
Dividend Ratio
Earnings per
share
net income attributable to equity
shareholders/ number of equity share
Earnings per share 1.67 15.3
P/E ratio market price per share/earning per share
Market price per share 0.58 2.96
P/E ratio 0.34 0.19
Dividend yield
ratio
dividend per share/ market price per
share*100 1.90% 3.15%
dividend per share
Dividend Payout
Ratio
The total dividend paid to the
shareholders/ net income 23.25% 67.34%
The total dividend paid to the
shareholders
The above dividend ratio shows that the shareholders of the mantra group limited receive
higher profit as compared with the Banyan Tree Holding limited since the earning per share
of the Mantra group Limited was significantly higher than the other company (Jabbouri, and
shareholders fund
ratio
net income attributable to equity
shareholders/ equity shareholders
fund*100
net income attributable to equity
shareholders 12929 43707
equity shareholders fund 777536 477948
Return on ordinary shareholders fund ratio 1.66 9.14
Return on Asset ratio Net income/total asset*100
Total asset 1679747 806259
Return on Asset ratio 0.88 5.65
The profitability ratio of the company shows that overall financial position of the company
(Uechi & et al. 2015). From the above calculation, it has been seen that the Mantra Group
limited was more profitable as compared with the Banyan Tree Holding Limited. However
the Gross Profit Ratio of the Banyan Tree Holding Limited was more than the mantra Group
Limited, but due to the increased non-operating expenses of the Banyan Tree Holding
Limited, the overall profitability reduced in comparison with the other company (Wahlen,
Baginski, and Bradshaw, 2014).
Dividend Ratio
Earnings per
share
net income attributable to equity
shareholders/ number of equity share
Earnings per share 1.67 15.3
P/E ratio market price per share/earning per share
Market price per share 0.58 2.96
P/E ratio 0.34 0.19
Dividend yield
ratio
dividend per share/ market price per
share*100 1.90% 3.15%
dividend per share
Dividend Payout
Ratio
The total dividend paid to the
shareholders/ net income 23.25% 67.34%
The total dividend paid to the
shareholders
The above dividend ratio shows that the shareholders of the mantra group limited receive
higher profit as compared with the Banyan Tree Holding limited since the earning per share
of the Mantra group Limited was significantly higher than the other company (Jabbouri, and
Paraphrase This Document
Need a fresh take? Get an instant paraphrase of this document with our AI Paraphraser
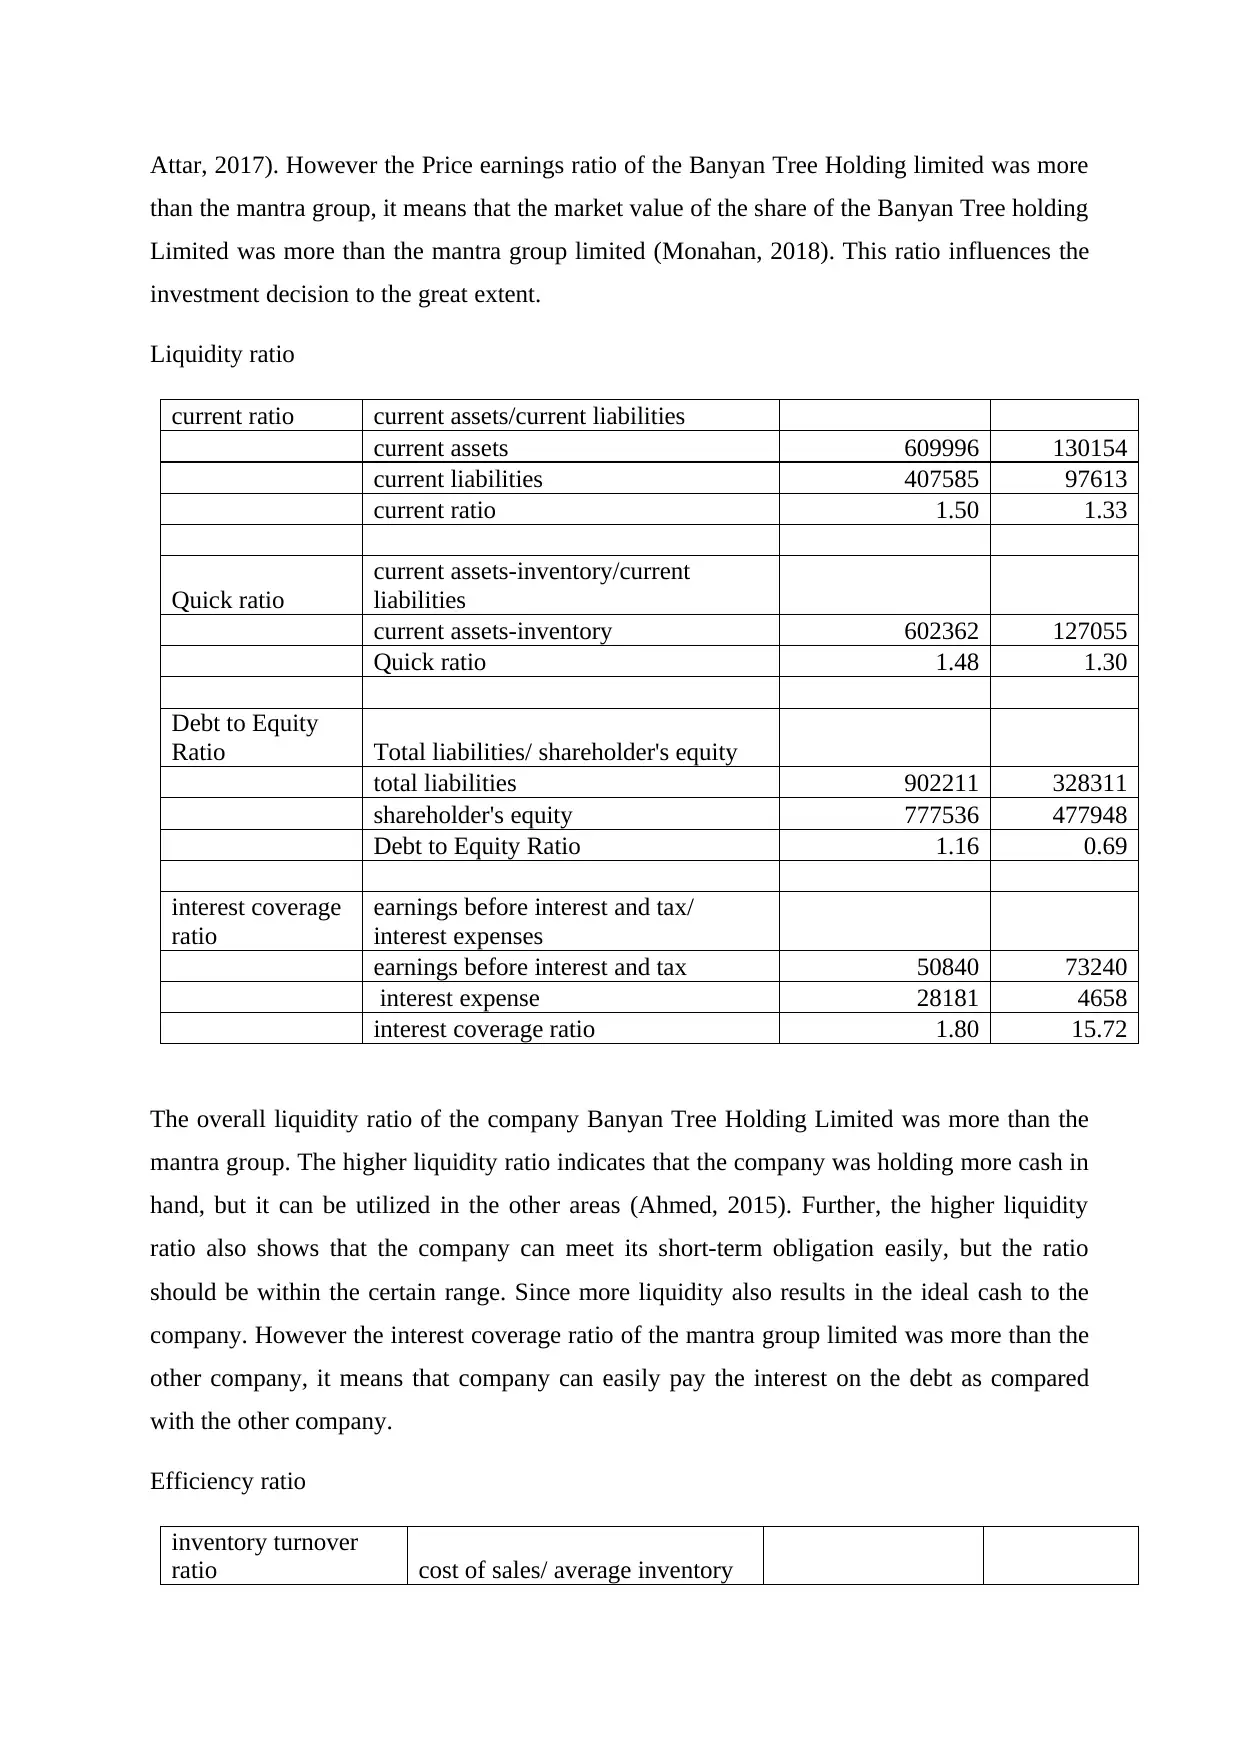
Attar, 2017). However the Price earnings ratio of the Banyan Tree Holding limited was more
than the mantra group, it means that the market value of the share of the Banyan Tree holding
Limited was more than the mantra group limited (Monahan, 2018). This ratio influences the
investment decision to the great extent.
Liquidity ratio
current ratio current assets/current liabilities
current assets 609996 130154
current liabilities 407585 97613
current ratio 1.50 1.33
Quick ratio
current assets-inventory/current
liabilities
current assets-inventory 602362 127055
Quick ratio 1.48 1.30
Debt to Equity
Ratio Total liabilities/ shareholder's equity
total liabilities 902211 328311
shareholder's equity 777536 477948
Debt to Equity Ratio 1.16 0.69
interest coverage
ratio
earnings before interest and tax/
interest expenses
earnings before interest and tax 50840 73240
interest expense 28181 4658
interest coverage ratio 1.80 15.72
The overall liquidity ratio of the company Banyan Tree Holding Limited was more than the
mantra group. The higher liquidity ratio indicates that the company was holding more cash in
hand, but it can be utilized in the other areas (Ahmed, 2015). Further, the higher liquidity
ratio also shows that the company can meet its short-term obligation easily, but the ratio
should be within the certain range. Since more liquidity also results in the ideal cash to the
company. However the interest coverage ratio of the mantra group limited was more than the
other company, it means that company can easily pay the interest on the debt as compared
with the other company.
Efficiency ratio
inventory turnover
ratio cost of sales/ average inventory
average inventory
opening stock+ closing
inventory/2
cost of sales 85815 233364
opening inventory 9398 2826
closing inventory 7634 3099
average inventory 8516 2962.5
inventory turnover ratio 10.07 78.77265823
assets turnover ratio total sales/total assets
total assets 1679747 806259
assets turnover ratio 0.22 0.85
receivable turnover
ratio
credit sales/ average account
receivables
average account
receivables
opening debtors +closing
debtors/2
credit sales 368439 688973
opening trade receivables 43155 45678
closing trade receivables 37122 54125
average account receivables 40138.5 49901.5
receivable turnover ratio 9.18 13.81
payable ratio
cost of sales/ average account
payable
average account
payable
opening creditors +closing
creditors/2
opening trade payables 19368 44785
closing trade payables 25311 52595
average account payables 22339.5 48690
payable ratio 3.84 4.79
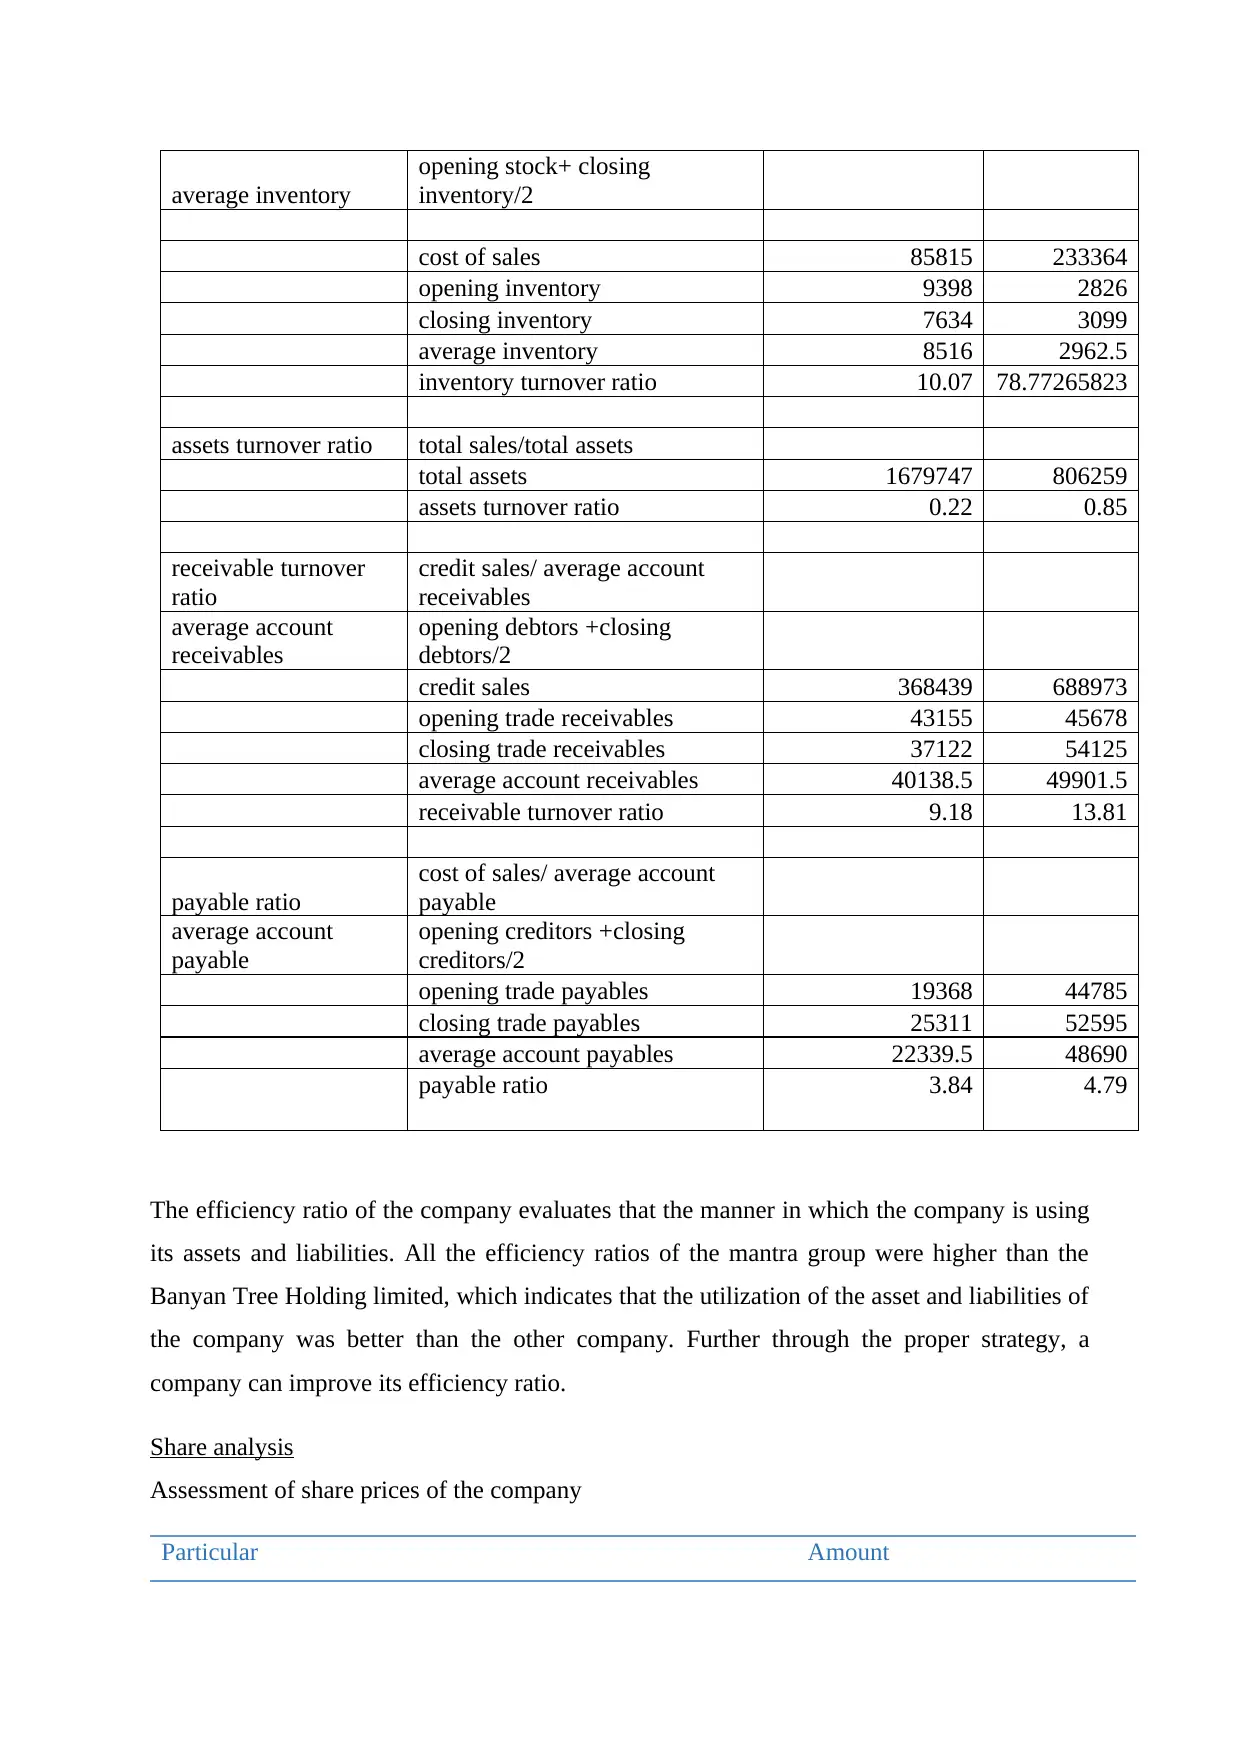
The efficiency ratio of the company evaluates that the manner in which the company is using
its assets and liabilities. All the efficiency ratios of the mantra group were higher than the
Banyan Tree Holding limited, which indicates that the utilization of the asset and liabilities of
the company was better than the other company. Further through the proper strategy, a
company can improve its efficiency ratio.
Share analysis
Assessment of share prices of the company
Particular Amount
opening stock+ closing
inventory/2
cost of sales 85815 233364
opening inventory 9398 2826
closing inventory 7634 3099
average inventory 8516 2962.5
inventory turnover ratio 10.07 78.77265823
assets turnover ratio total sales/total assets
total assets 1679747 806259
assets turnover ratio 0.22 0.85
receivable turnover
ratio
credit sales/ average account
receivables
average account
receivables
opening debtors +closing
debtors/2
credit sales 368439 688973
opening trade receivables 43155 45678
closing trade receivables 37122 54125
average account receivables 40138.5 49901.5
receivable turnover ratio 9.18 13.81
payable ratio
cost of sales/ average account
payable
average account
payable
opening creditors +closing
creditors/2
opening trade payables 19368 44785
closing trade payables 25311 52595
average account payables 22339.5 48690
payable ratio 3.84 4.79
The efficiency ratio of the company evaluates that the manner in which the company is using
its assets and liabilities. All the efficiency ratios of the mantra group were higher than the
Banyan Tree Holding limited, which indicates that the utilization of the asset and liabilities of
the company was better than the other company. Further through the proper strategy, a
company can improve its efficiency ratio.
Share analysis
Assessment of share prices of the company
Particular Amount
⊘ This is a preview!⊘
Do you want full access?
Subscribe today to unlock all pages.
Trusted by 1+ million students worldwide
1 out of 18
Related Documents


Your All-in-One AI-Powered Toolkit for Academic Success.
+13062052269
info@desklib.com
Available 24*7 on WhatsApp / Email
![[object Object]](/_next/static/media/star-bottom.7253800d.svg)
Unlock your academic potential
Copyright © 2020–2026 A2Z Services. All Rights Reserved. Developed and managed by ZUCOL.