University: Financial Management and Control Report on Bitmap plc
VerifiedAdded on 2023/01/23
|33
|7137
|62
Report
AI Summary
This report presents a comprehensive financial analysis of Bitmap plc, a London-based furniture manufacturer, evaluating its performance over two years. Part A assesses profitability, liquidity, gearing, asset utilization, and investor potential through ratio analysis of the income statement and balance sheet. It also includes an evaluation of the working capital cycle. Part B delves into capital budgeting, applying techniques such as payback period, NPV, and IRR, followed by an evaluation of suitable financing sources. Finally, Part C examines the budgeting process and the interlinking of various budgets within a business. The report provides a detailed assessment of Bitmap plc's financial health and strategic decisions, supported by relevant financial data and calculations.
Running Head: Financial Management and Control
FINANCIAL MANAGEMENT AND
CONTROL
STUDENT NAME
UNIVERSITY NAME
FINANCIAL MANAGEMENT AND
CONTROL
STUDENT NAME
UNIVERSITY NAME
Paraphrase This Document
Need a fresh take? Get an instant paraphrase of this document with our AI Paraphraser
Financial Management and Control
Contents
Part A..........................................................................................................................................................2
Introduction.............................................................................................................................................2
Evaluation of the financial performance of Bitmap plc on the basis of past two year’s financial
statements...............................................................................................................................................3
Asset utilisation:......................................................................................................................................9
Investor’s potential:...............................................................................................................................11
A brief evaluation of Bitmap plc’s working capital cycle........................................................................12
Conclusion:............................................................................................................................................14
Part B.........................................................................................................................................................15
Capital Budgeting Analysis:....................................................................................................................15
Cash-flow details:..............................................................................................................................15
1) The Payback Period...................................................................................................................17
2) The Discounted Payback Period................................................................................................18
3) The Accounting Rate of Return.................................................................................................19
4) The Net Present Value...............................................................................................................21
5) The Internal Rate of Return.......................................................................................................22
Evaluation of different investment appraisal techniques:.....................................................................23
Evaluation of two suitable sources of finance to fund this investment:................................................25
Part C.........................................................................................................................................................27
Budgeting..............................................................................................................................................27
Evaluation of the budgeting process and the interlinking of various budgets used within a business.. 28
References:................................................................................................................................................31
1
Financial Management and Control
Part A
Introduction
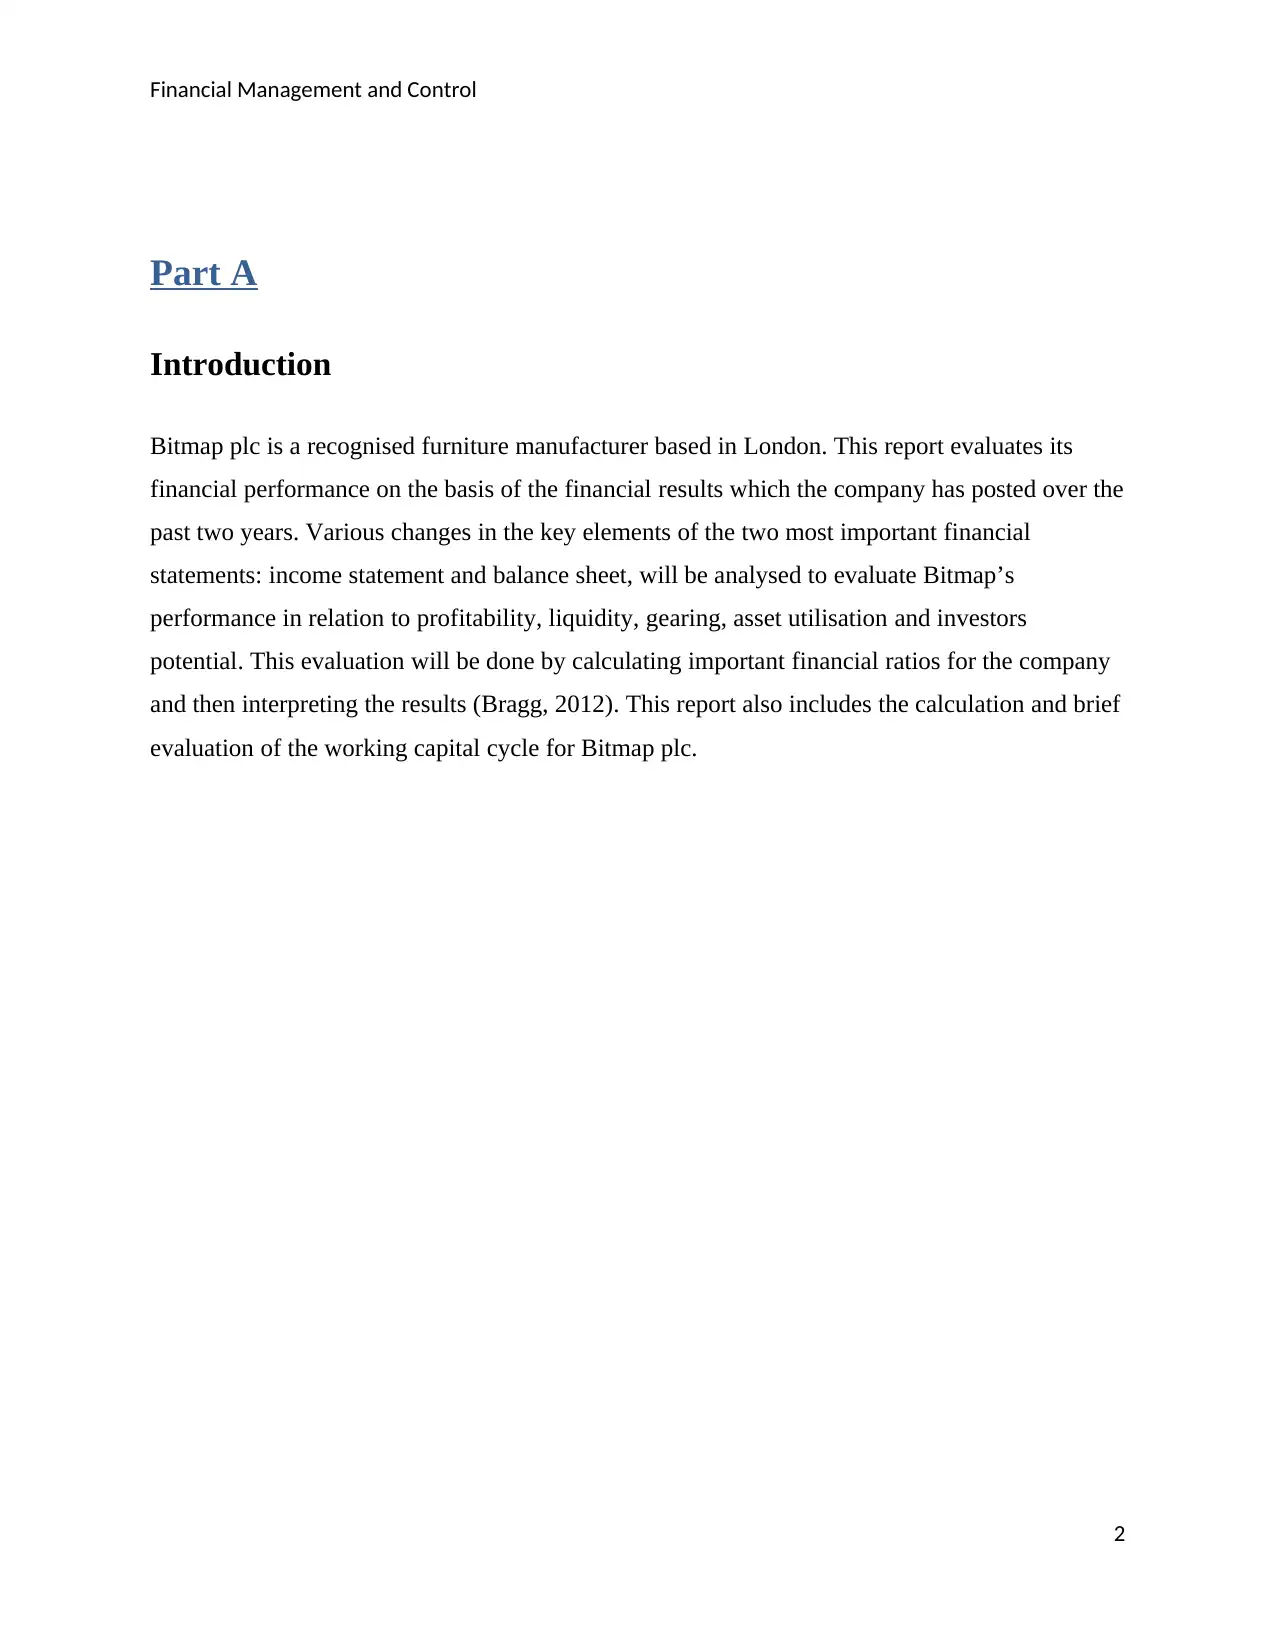
Bitmap plc is a recognised furniture manufacturer based in London. This report evaluates its
financial performance on the basis of the financial results which the company has posted over the
past two years. Various changes in the key elements of the two most important financial
statements: income statement and balance sheet, will be analysed to evaluate Bitmap’s
performance in relation to profitability, liquidity, gearing, asset utilisation and investors
potential. This evaluation will be done by calculating important financial ratios for the company
and then interpreting the results (Bragg, 2012). This report also includes the calculation and brief
evaluation of the working capital cycle for Bitmap plc.
2
Part A
Introduction
Bitmap plc is a recognised furniture manufacturer based in London. This report evaluates its
financial performance on the basis of the financial results which the company has posted over the
past two years. Various changes in the key elements of the two most important financial
statements: income statement and balance sheet, will be analysed to evaluate Bitmap’s
performance in relation to profitability, liquidity, gearing, asset utilisation and investors
potential. This evaluation will be done by calculating important financial ratios for the company
and then interpreting the results (Bragg, 2012). This report also includes the calculation and brief
evaluation of the working capital cycle for Bitmap plc.
2
⊘ This is a preview!⊘
Do you want full access?
Subscribe today to unlock all pages.
Trusted by 1+ million students worldwide
Financial Management and Control
Evaluation of the financial performance of Bitmap plc on the basis
of past two year’s financial statements
Bitmap plc’s financial statements
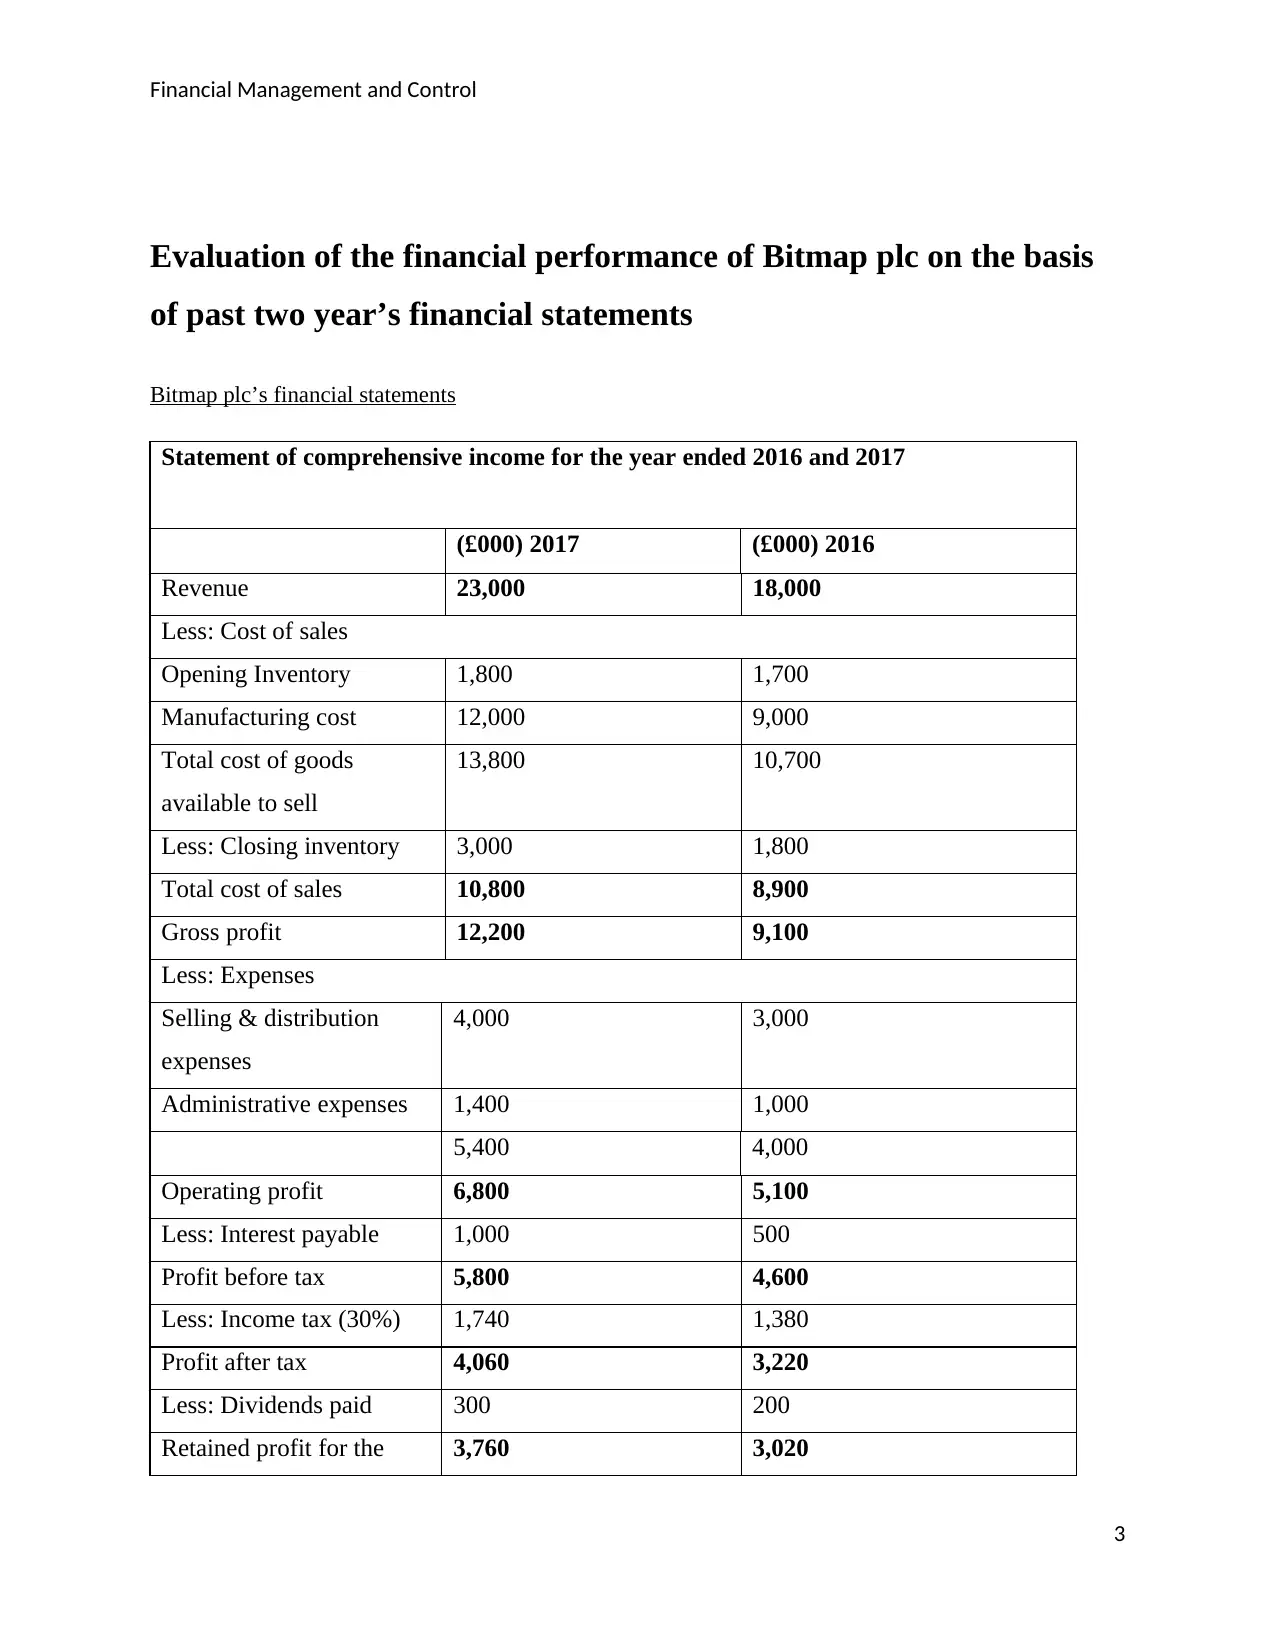
Statement of comprehensive income for the year ended 2016 and 2017
(£000) 2017 (£000) 2016
Revenue 23,000 18,000
Less: Cost of sales
Opening Inventory 1,800 1,700
Manufacturing cost 12,000 9,000
Total cost of goods
available to sell
13,800 10,700
Less: Closing inventory 3,000 1,800
Total cost of sales 10,800 8,900
Gross profit 12,200 9,100
Less: Expenses
Selling & distribution
expenses
4,000 3,000
Administrative expenses 1,400 1,000
5,400 4,000
Operating profit 6,800 5,100
Less: Interest payable 1,000 500
Profit before tax 5,800 4,600
Less: Income tax (30%) 1,740 1,380
Profit after tax 4,060 3,220
Less: Dividends paid 300 200
Retained profit for the 3,760 3,020
3
Evaluation of the financial performance of Bitmap plc on the basis
of past two year’s financial statements
Bitmap plc’s financial statements
Statement of comprehensive income for the year ended 2016 and 2017
(£000) 2017 (£000) 2016
Revenue 23,000 18,000
Less: Cost of sales
Opening Inventory 1,800 1,700
Manufacturing cost 12,000 9,000
Total cost of goods
available to sell
13,800 10,700
Less: Closing inventory 3,000 1,800
Total cost of sales 10,800 8,900
Gross profit 12,200 9,100
Less: Expenses
Selling & distribution
expenses
4,000 3,000
Administrative expenses 1,400 1,000
5,400 4,000
Operating profit 6,800 5,100
Less: Interest payable 1,000 500
Profit before tax 5,800 4,600
Less: Income tax (30%) 1,740 1,380
Profit after tax 4,060 3,220
Less: Dividends paid 300 200
Retained profit for the 3,760 3,020
3
Paraphrase This Document
Need a fresh take? Get an instant paraphrase of this document with our AI Paraphraser
Financial Management and Control
year
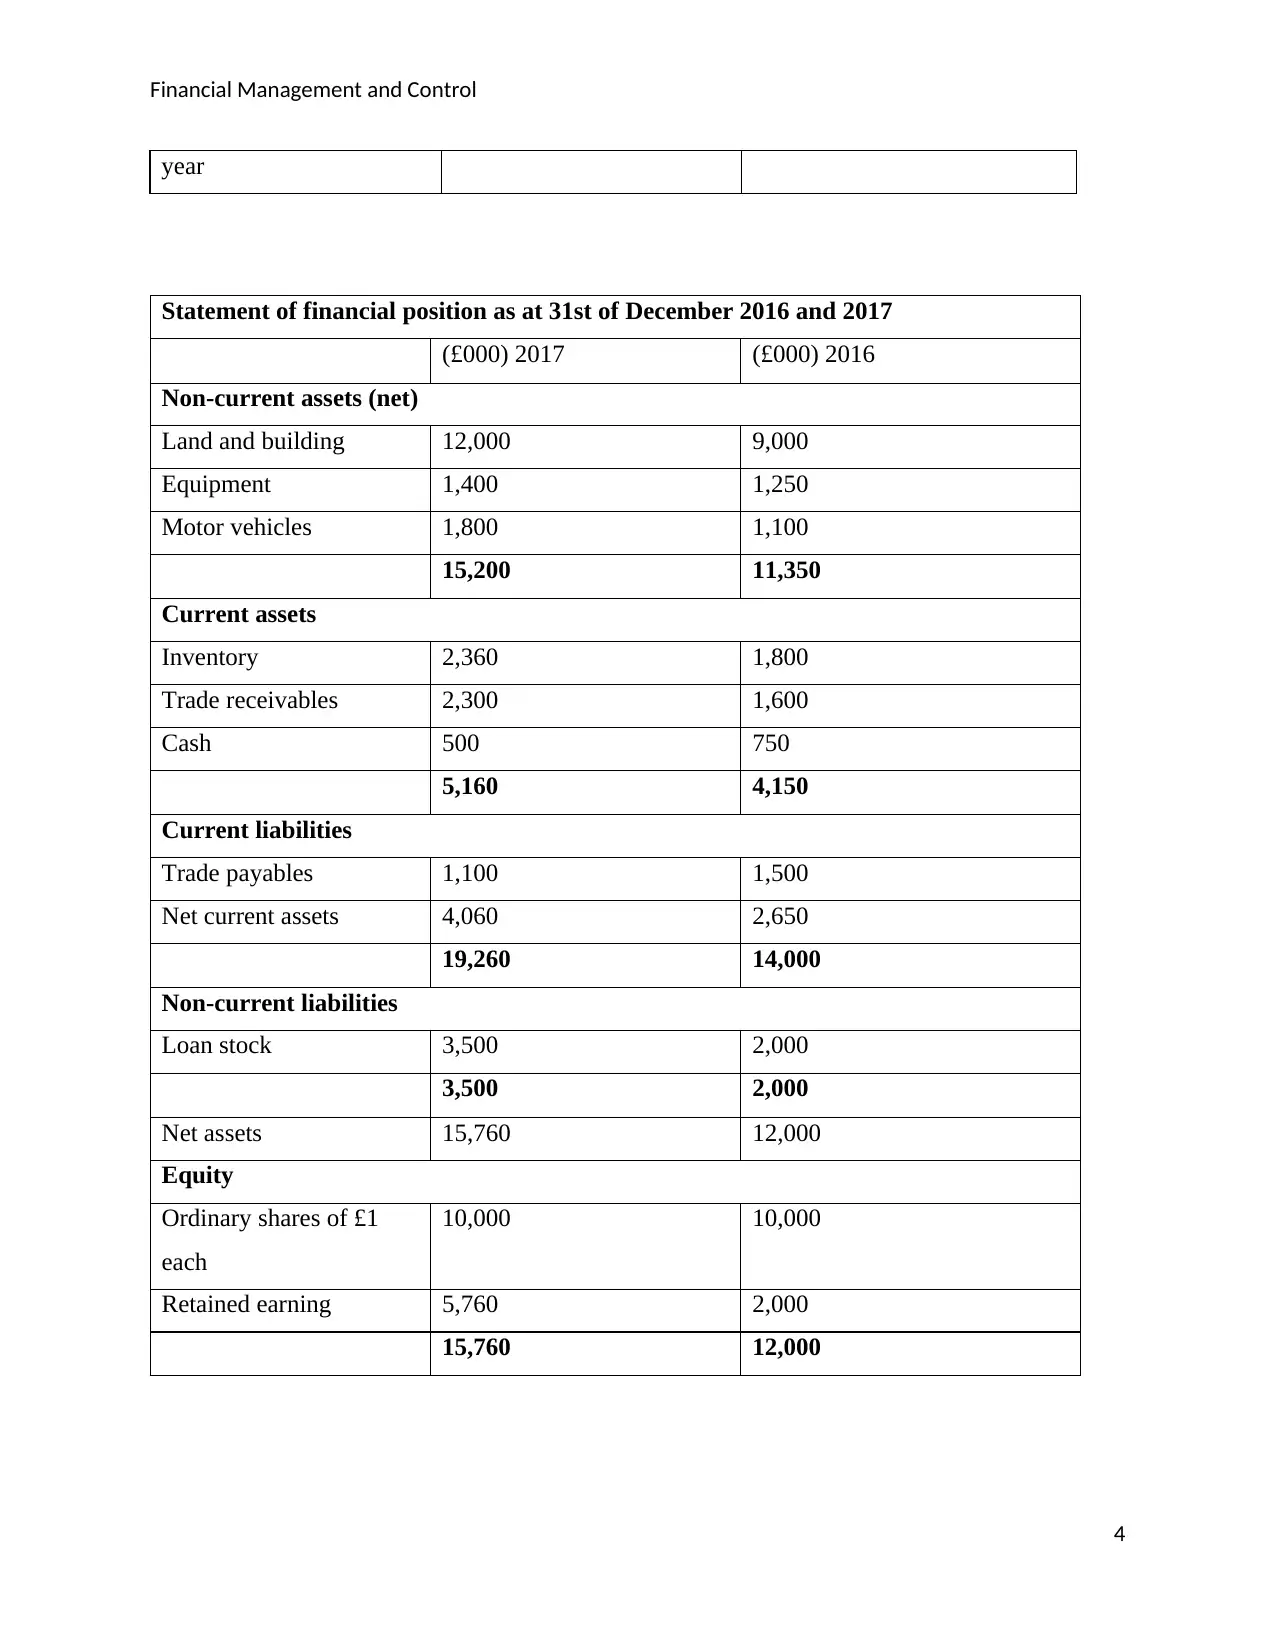
Statement of financial position as at 31st of December 2016 and 2017
(£000) 2017 (£000) 2016
Non-current assets (net)
Land and building 12,000 9,000
Equipment 1,400 1,250
Motor vehicles 1,800 1,100
15,200 11,350
Current assets
Inventory 2,360 1,800
Trade receivables 2,300 1,600
Cash 500 750
5,160 4,150
Current liabilities
Trade payables 1,100 1,500
Net current assets 4,060 2,650
19,260 14,000
Non-current liabilities
Loan stock 3,500 2,000
3,500 2,000
Net assets 15,760 12,000
Equity
Ordinary shares of £1
each
10,000 10,000
Retained earning 5,760 2,000
15,760 12,000
4
year
Statement of financial position as at 31st of December 2016 and 2017
(£000) 2017 (£000) 2016
Non-current assets (net)
Land and building 12,000 9,000
Equipment 1,400 1,250
Motor vehicles 1,800 1,100
15,200 11,350
Current assets
Inventory 2,360 1,800
Trade receivables 2,300 1,600
Cash 500 750
5,160 4,150
Current liabilities
Trade payables 1,100 1,500
Net current assets 4,060 2,650
19,260 14,000
Non-current liabilities
Loan stock 3,500 2,000
3,500 2,000
Net assets 15,760 12,000
Equity
Ordinary shares of £1
each
10,000 10,000
Retained earning 5,760 2,000
15,760 12,000
4
Financial Management and Control
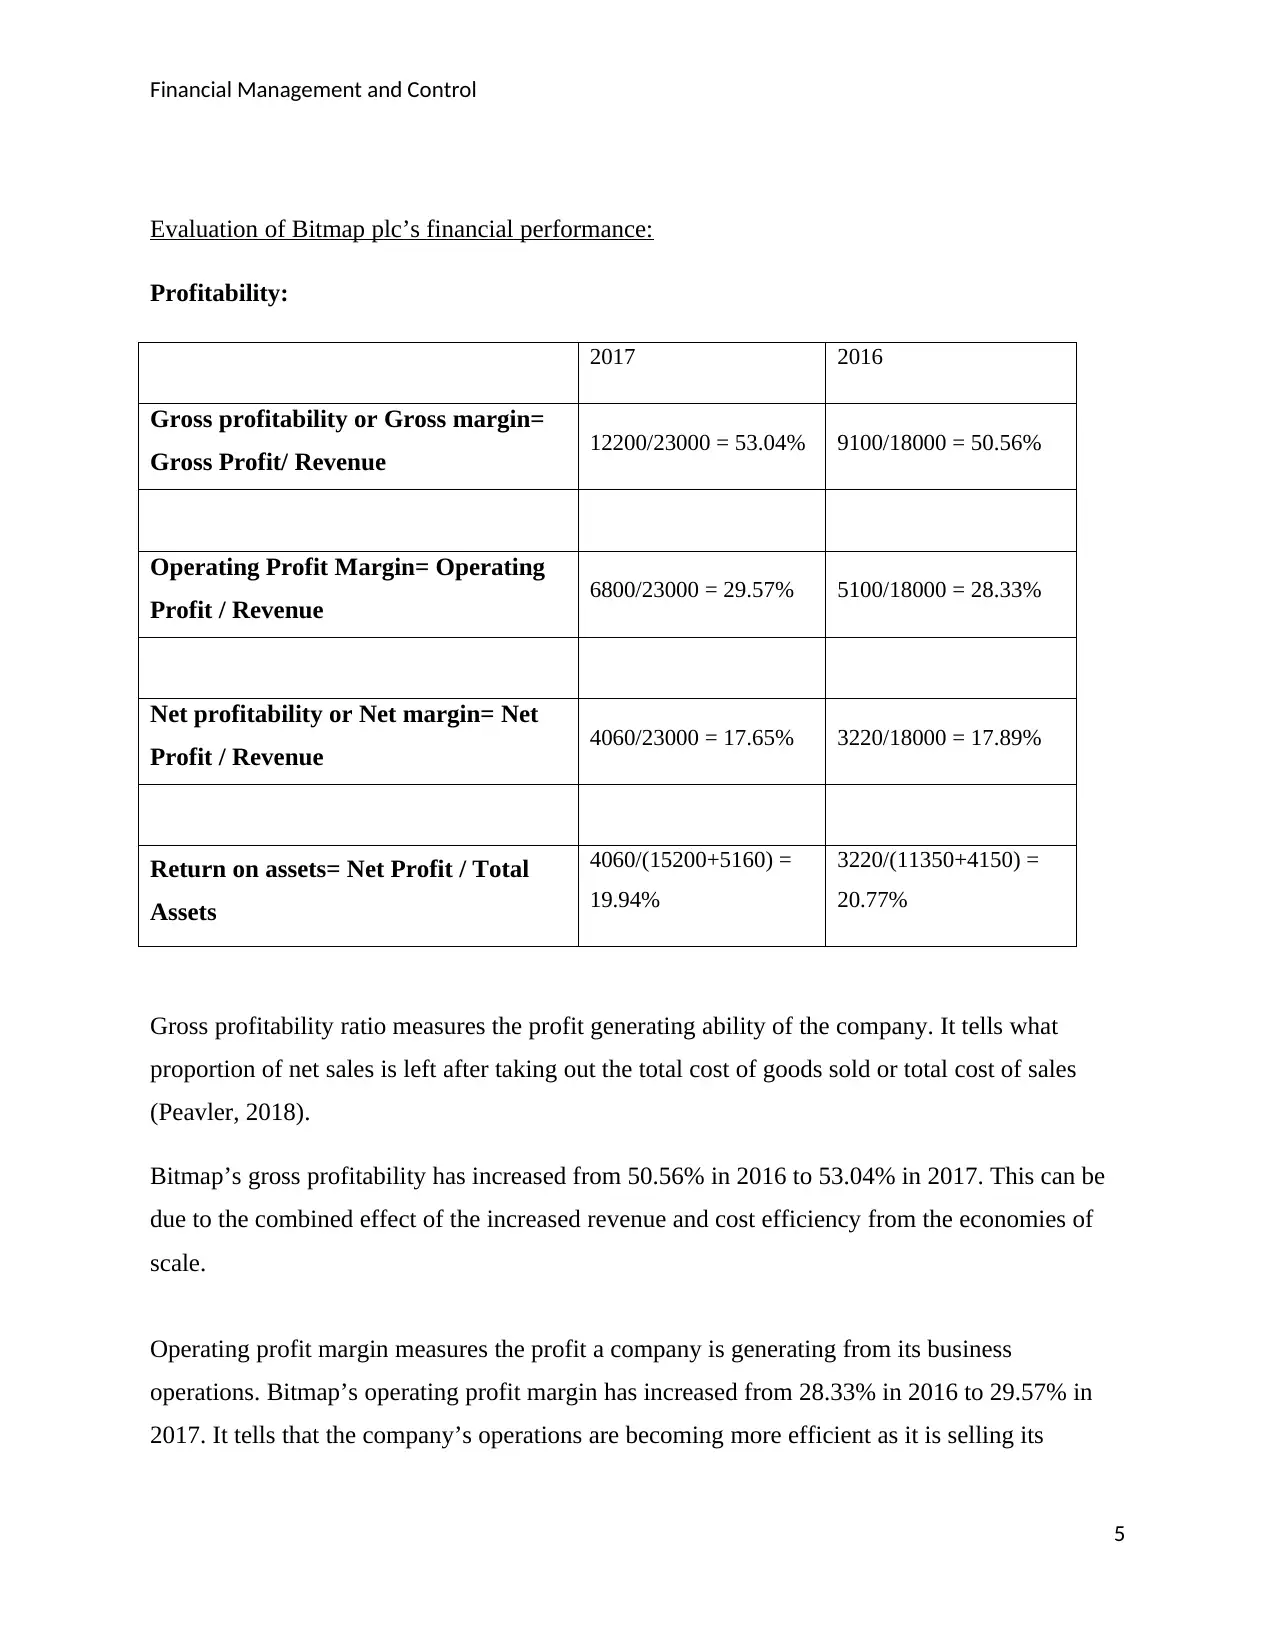
Evaluation of Bitmap plc’s financial performance:
Profitability:
2017 2016
Gross profitability or Gross margin=
Gross Profit/ Revenue 12200/23000 = 53.04% 9100/18000 = 50.56%
Operating Profit Margin= Operating
Profit / Revenue 6800/23000 = 29.57% 5100/18000 = 28.33%
Net profitability or Net margin= Net
Profit / Revenue 4060/23000 = 17.65% 3220/18000 = 17.89%
Return on assets= Net Profit / Total
Assets
4060/(15200+5160) =
19.94%
3220/(11350+4150) =
20.77%
Gross profitability ratio measures the profit generating ability of the company. It tells what
proportion of net sales is left after taking out the total cost of goods sold or total cost of sales
(Peavler, 2018).
Bitmap’s gross profitability has increased from 50.56% in 2016 to 53.04% in 2017. This can be
due to the combined effect of the increased revenue and cost efficiency from the economies of
scale.
Operating profit margin measures the profit a company is generating from its business
operations. Bitmap’s operating profit margin has increased from 28.33% in 2016 to 29.57% in
2017. It tells that the company’s operations are becoming more efficient as it is selling its
5
⊘ This is a preview!⊘
Do you want full access?
Subscribe today to unlock all pages.
Trusted by 1+ million students worldwide
Financial Management and Control
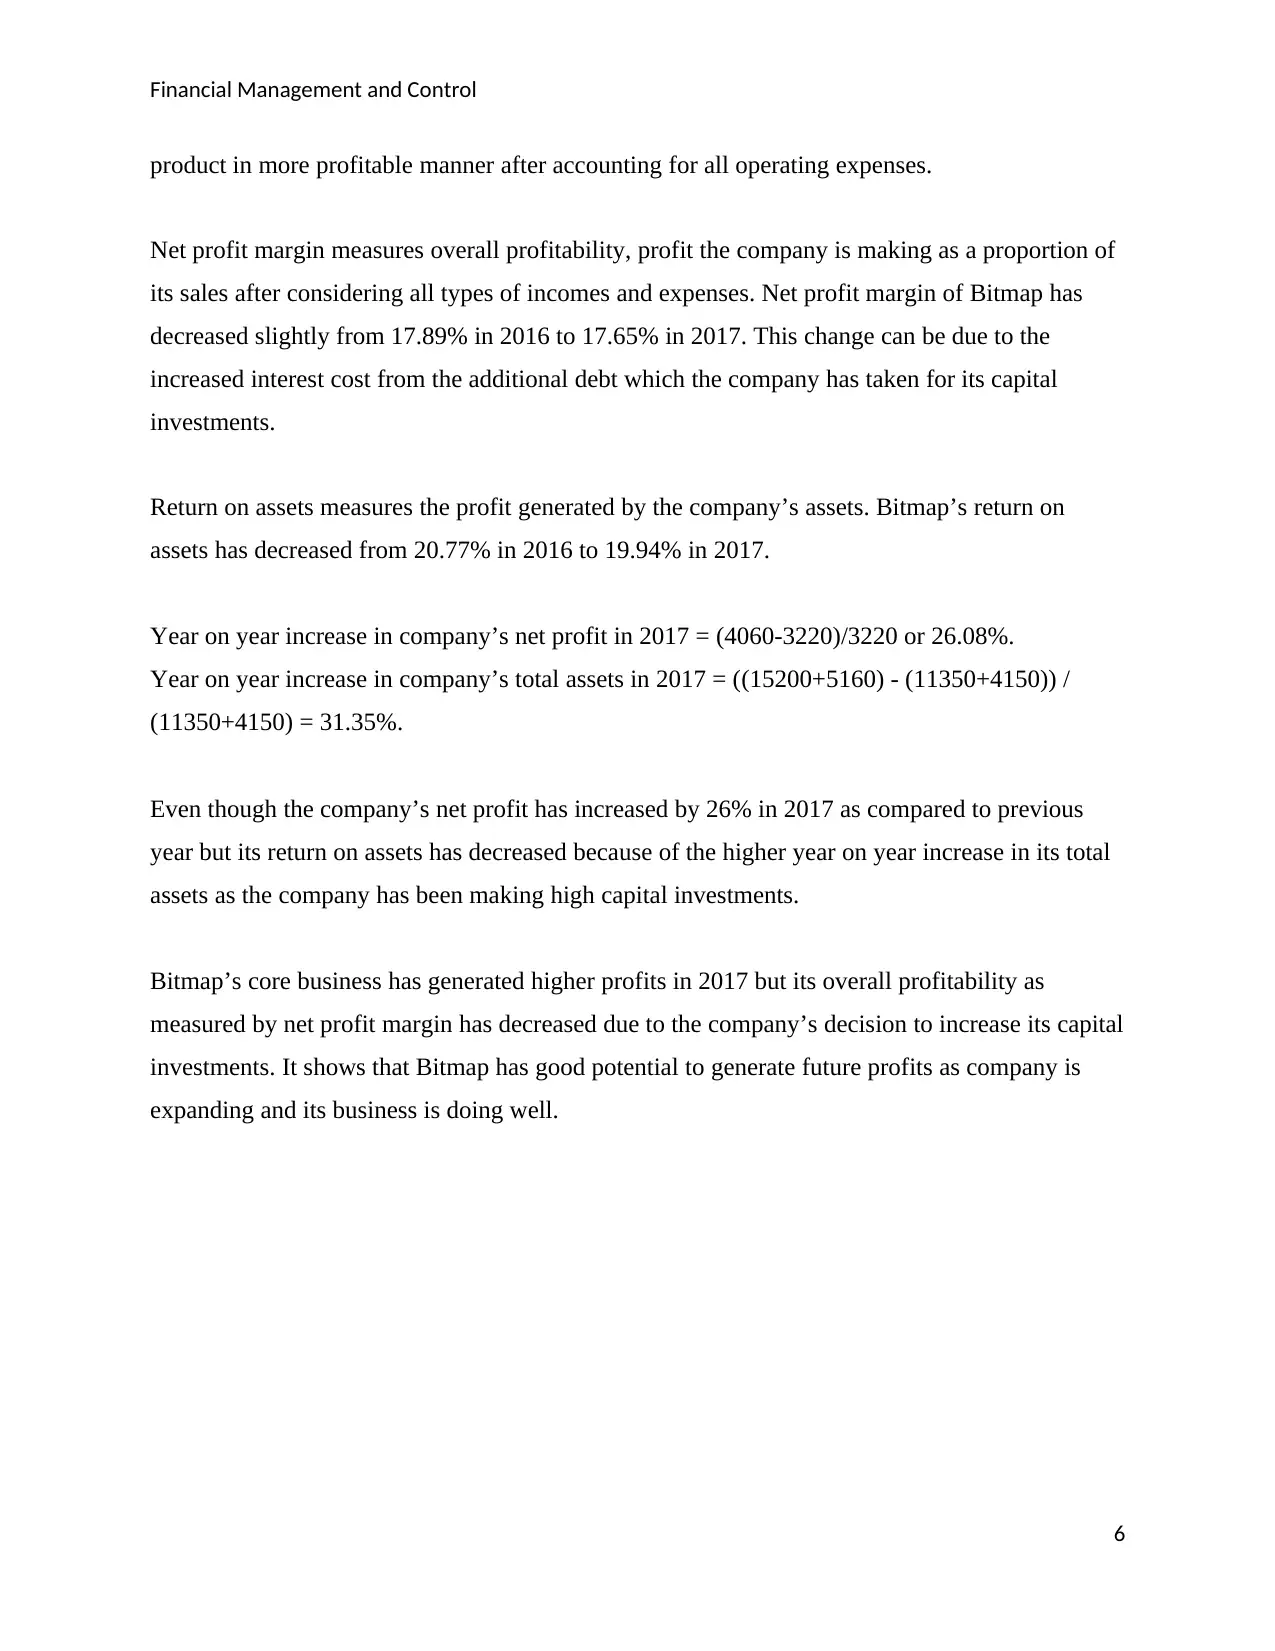
product in more profitable manner after accounting for all operating expenses.
Net profit margin measures overall profitability, profit the company is making as a proportion of
its sales after considering all types of incomes and expenses. Net profit margin of Bitmap has
decreased slightly from 17.89% in 2016 to 17.65% in 2017. This change can be due to the
increased interest cost from the additional debt which the company has taken for its capital
investments.
Return on assets measures the profit generated by the company’s assets. Bitmap’s return on
assets has decreased from 20.77% in 2016 to 19.94% in 2017.
Year on year increase in company’s net profit in 2017 = (4060-3220)/3220 or 26.08%.
Year on year increase in company’s total assets in 2017 = ((15200+5160) - (11350+4150)) /
(11350+4150) = 31.35%.
Even though the company’s net profit has increased by 26% in 2017 as compared to previous
year but its return on assets has decreased because of the higher year on year increase in its total
assets as the company has been making high capital investments.
Bitmap’s core business has generated higher profits in 2017 but its overall profitability as
measured by net profit margin has decreased due to the company’s decision to increase its capital
investments. It shows that Bitmap has good potential to generate future profits as company is
expanding and its business is doing well.
6
Paraphrase This Document
Need a fresh take? Get an instant paraphrase of this document with our AI Paraphraser
Financial Management and Control
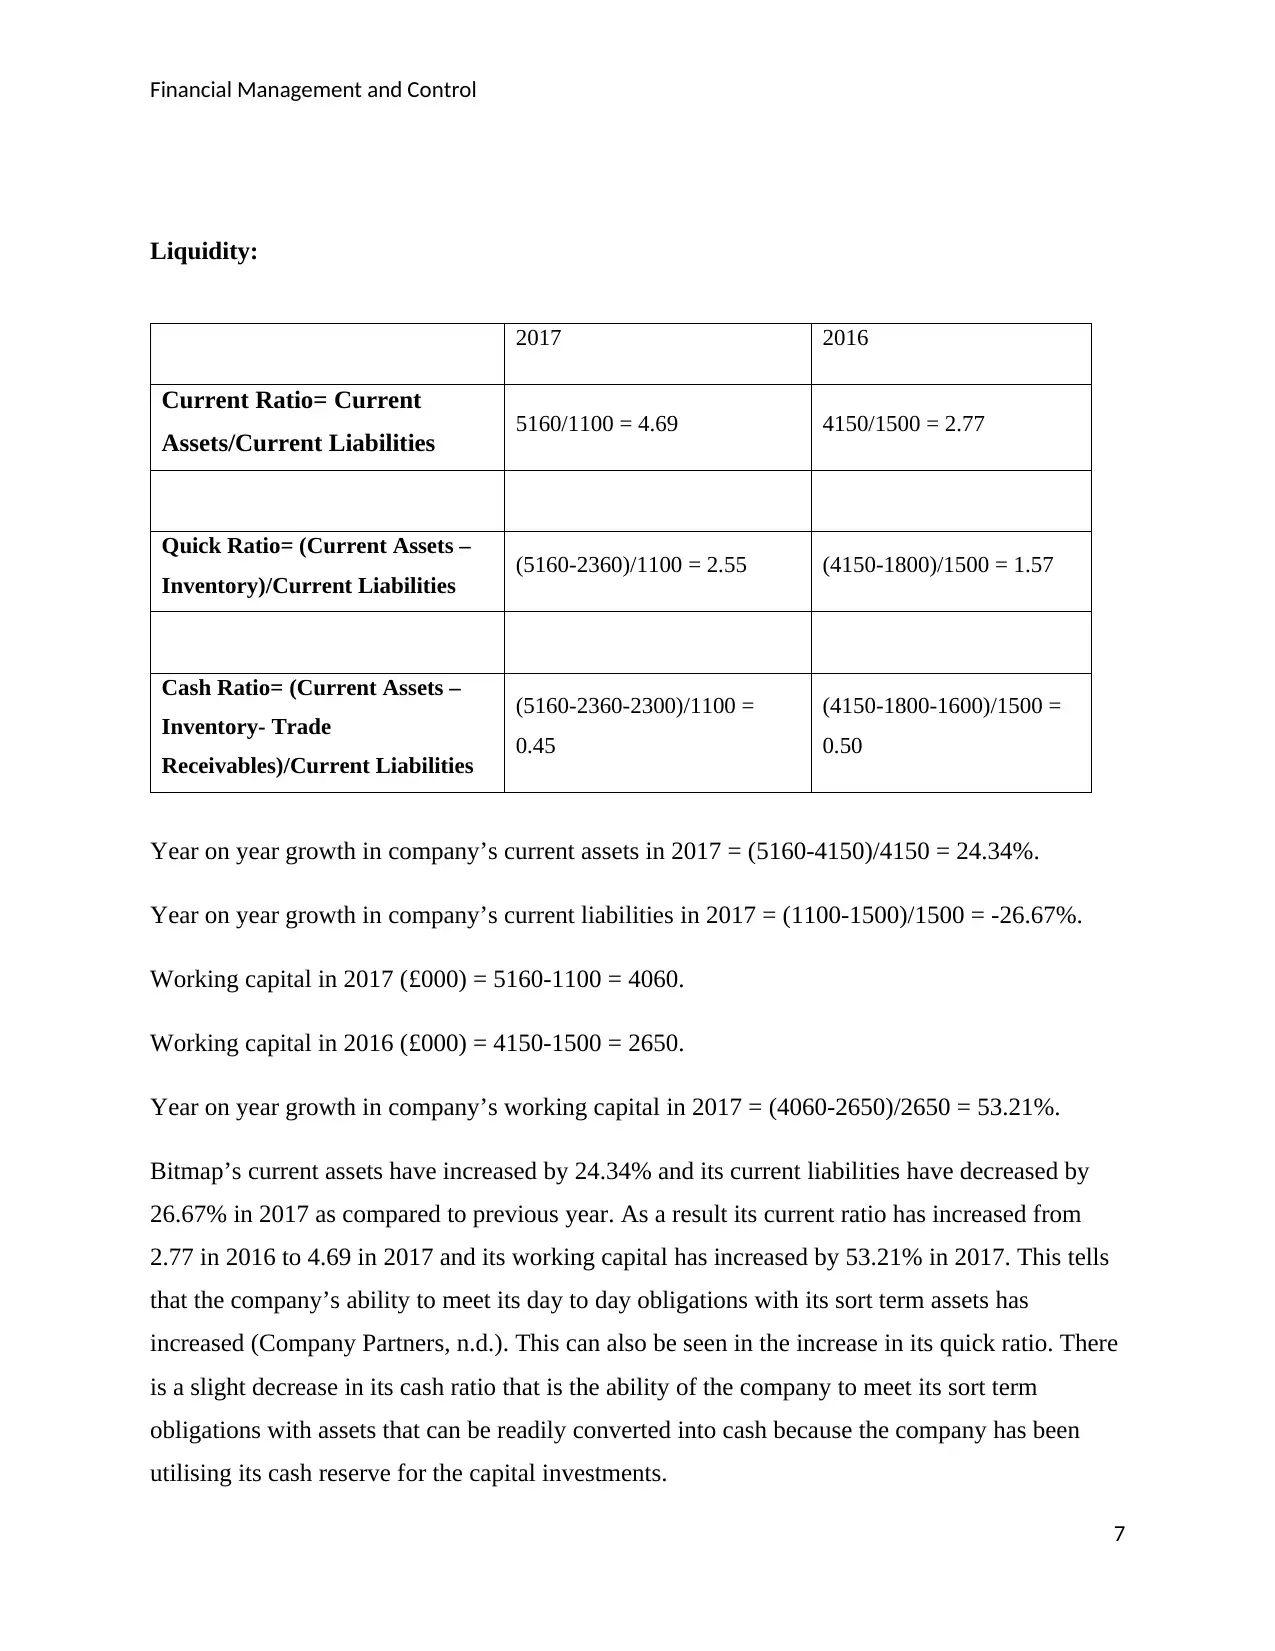
Liquidity:
2017 2016
Current Ratio= Current
Assets/Current Liabilities 5160/1100 = 4.69 4150/1500 = 2.77
Quick Ratio= (Current Assets –
Inventory)/Current Liabilities (5160-2360)/1100 = 2.55 (4150-1800)/1500 = 1.57
Cash Ratio= (Current Assets –
Inventory- Trade
Receivables)/Current Liabilities
(5160-2360-2300)/1100 =
0.45
(4150-1800-1600)/1500 =
0.50
Year on year growth in company’s current assets in 2017 = (5160-4150)/4150 = 24.34%.
Year on year growth in company’s current liabilities in 2017 = (1100-1500)/1500 = -26.67%.
Working capital in 2017 (£000) = 5160-1100 = 4060.
Working capital in 2016 (£000) = 4150-1500 = 2650.
Year on year growth in company’s working capital in 2017 = (4060-2650)/2650 = 53.21%.
Bitmap’s current assets have increased by 24.34% and its current liabilities have decreased by
26.67% in 2017 as compared to previous year. As a result its current ratio has increased from
2.77 in 2016 to 4.69 in 2017 and its working capital has increased by 53.21% in 2017. This tells
that the company’s ability to meet its day to day obligations with its sort term assets has
increased (Company Partners, n.d.). This can also be seen in the increase in its quick ratio. There
is a slight decrease in its cash ratio that is the ability of the company to meet its sort term
obligations with assets that can be readily converted into cash because the company has been
utilising its cash reserve for the capital investments.
7
Financial Management and Control
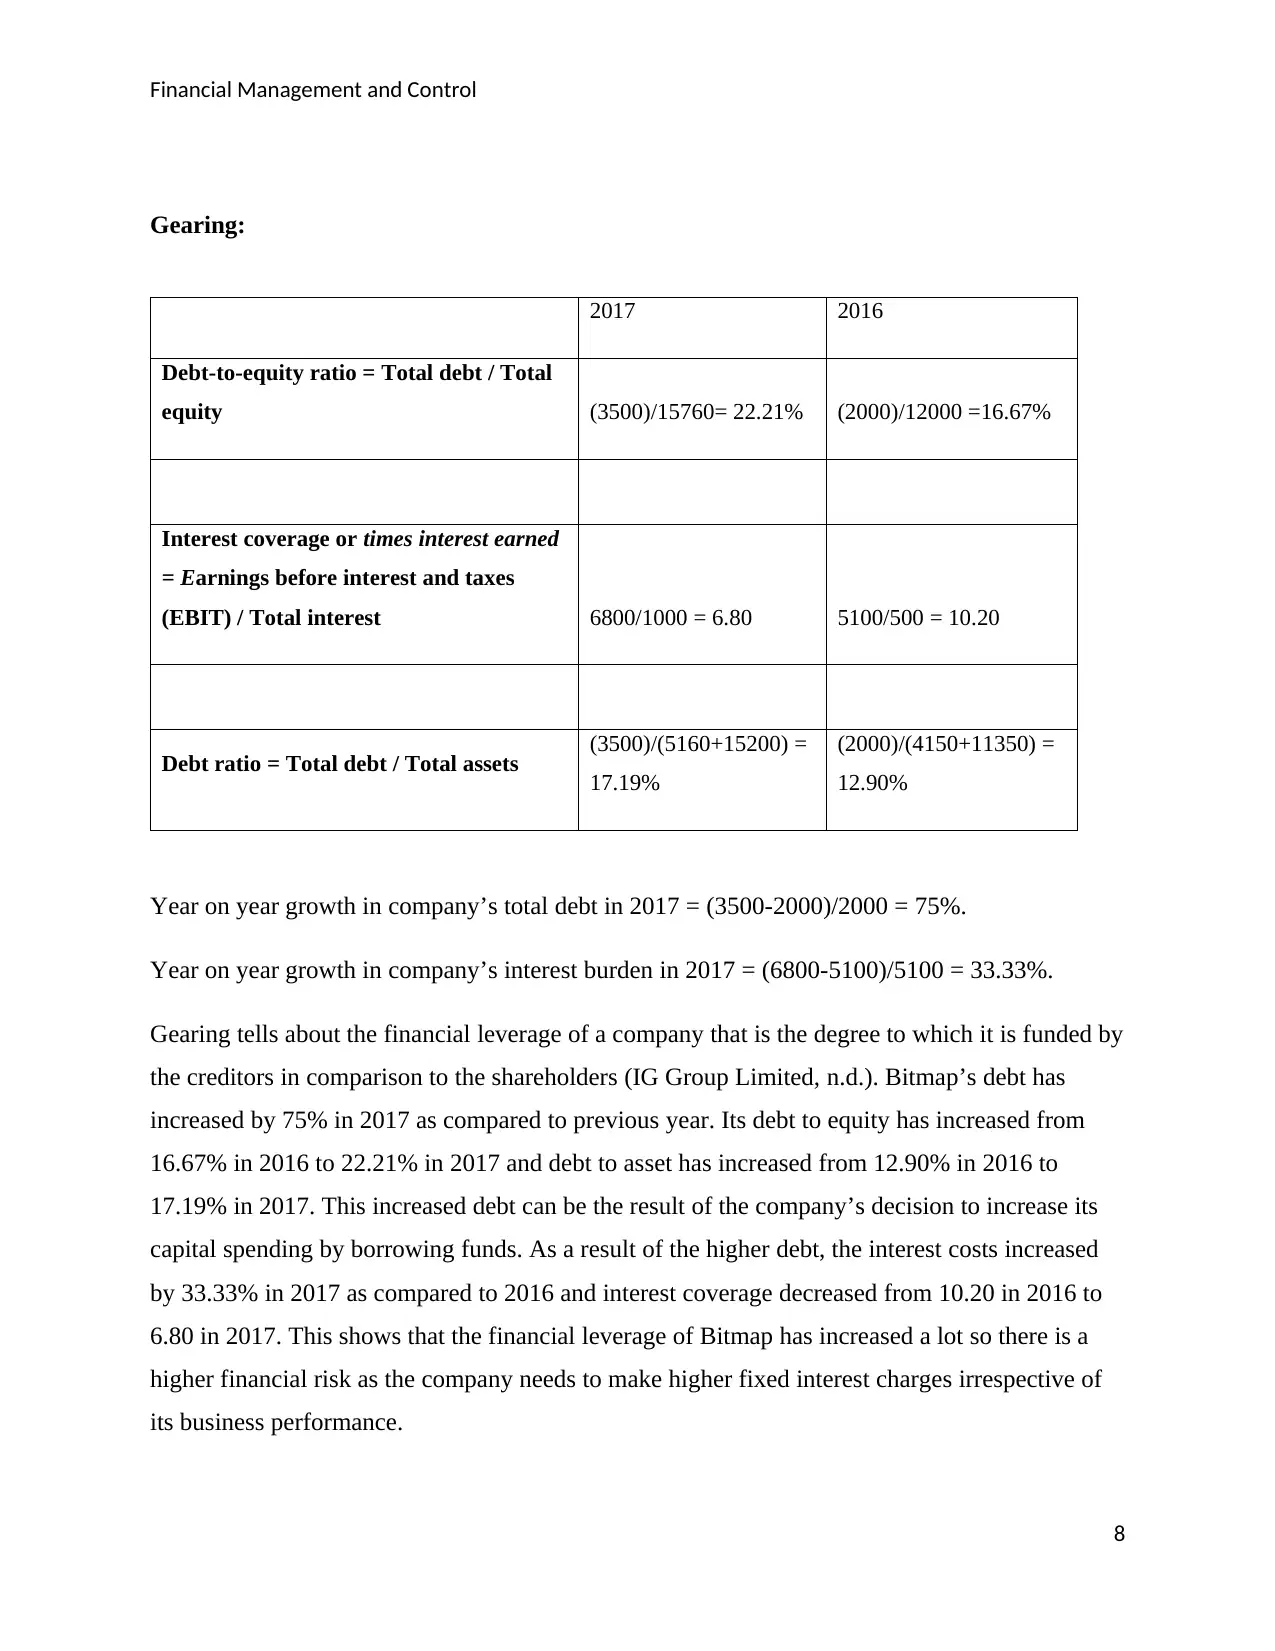
Gearing:
2017 2016
Debt-to-equity ratio = Total debt / Total
equity (3500)/15760= 22.21% (2000)/12000 =16.67%
Interest coverage or times interest earned
= Earnings before interest and taxes
(EBIT) / Total interest 6800/1000 = 6.80 5100/500 = 10.20
Debt ratio = Total debt / Total assets (3500)/(5160+15200) =
17.19%
(2000)/(4150+11350) =
12.90%
Year on year growth in company’s total debt in 2017 = (3500-2000)/2000 = 75%.
Year on year growth in company’s interest burden in 2017 = (6800-5100)/5100 = 33.33%.
Gearing tells about the financial leverage of a company that is the degree to which it is funded by
the creditors in comparison to the shareholders (IG Group Limited, n.d.). Bitmap’s debt has
increased by 75% in 2017 as compared to previous year. Its debt to equity has increased from
16.67% in 2016 to 22.21% in 2017 and debt to asset has increased from 12.90% in 2016 to
17.19% in 2017. This increased debt can be the result of the company’s decision to increase its
capital spending by borrowing funds. As a result of the higher debt, the interest costs increased
by 33.33% in 2017 as compared to 2016 and interest coverage decreased from 10.20 in 2016 to
6.80 in 2017. This shows that the financial leverage of Bitmap has increased a lot so there is a
higher financial risk as the company needs to make higher fixed interest charges irrespective of
its business performance.
8
⊘ This is a preview!⊘
Do you want full access?
Subscribe today to unlock all pages.
Trusted by 1+ million students worldwide
Financial Management and Control
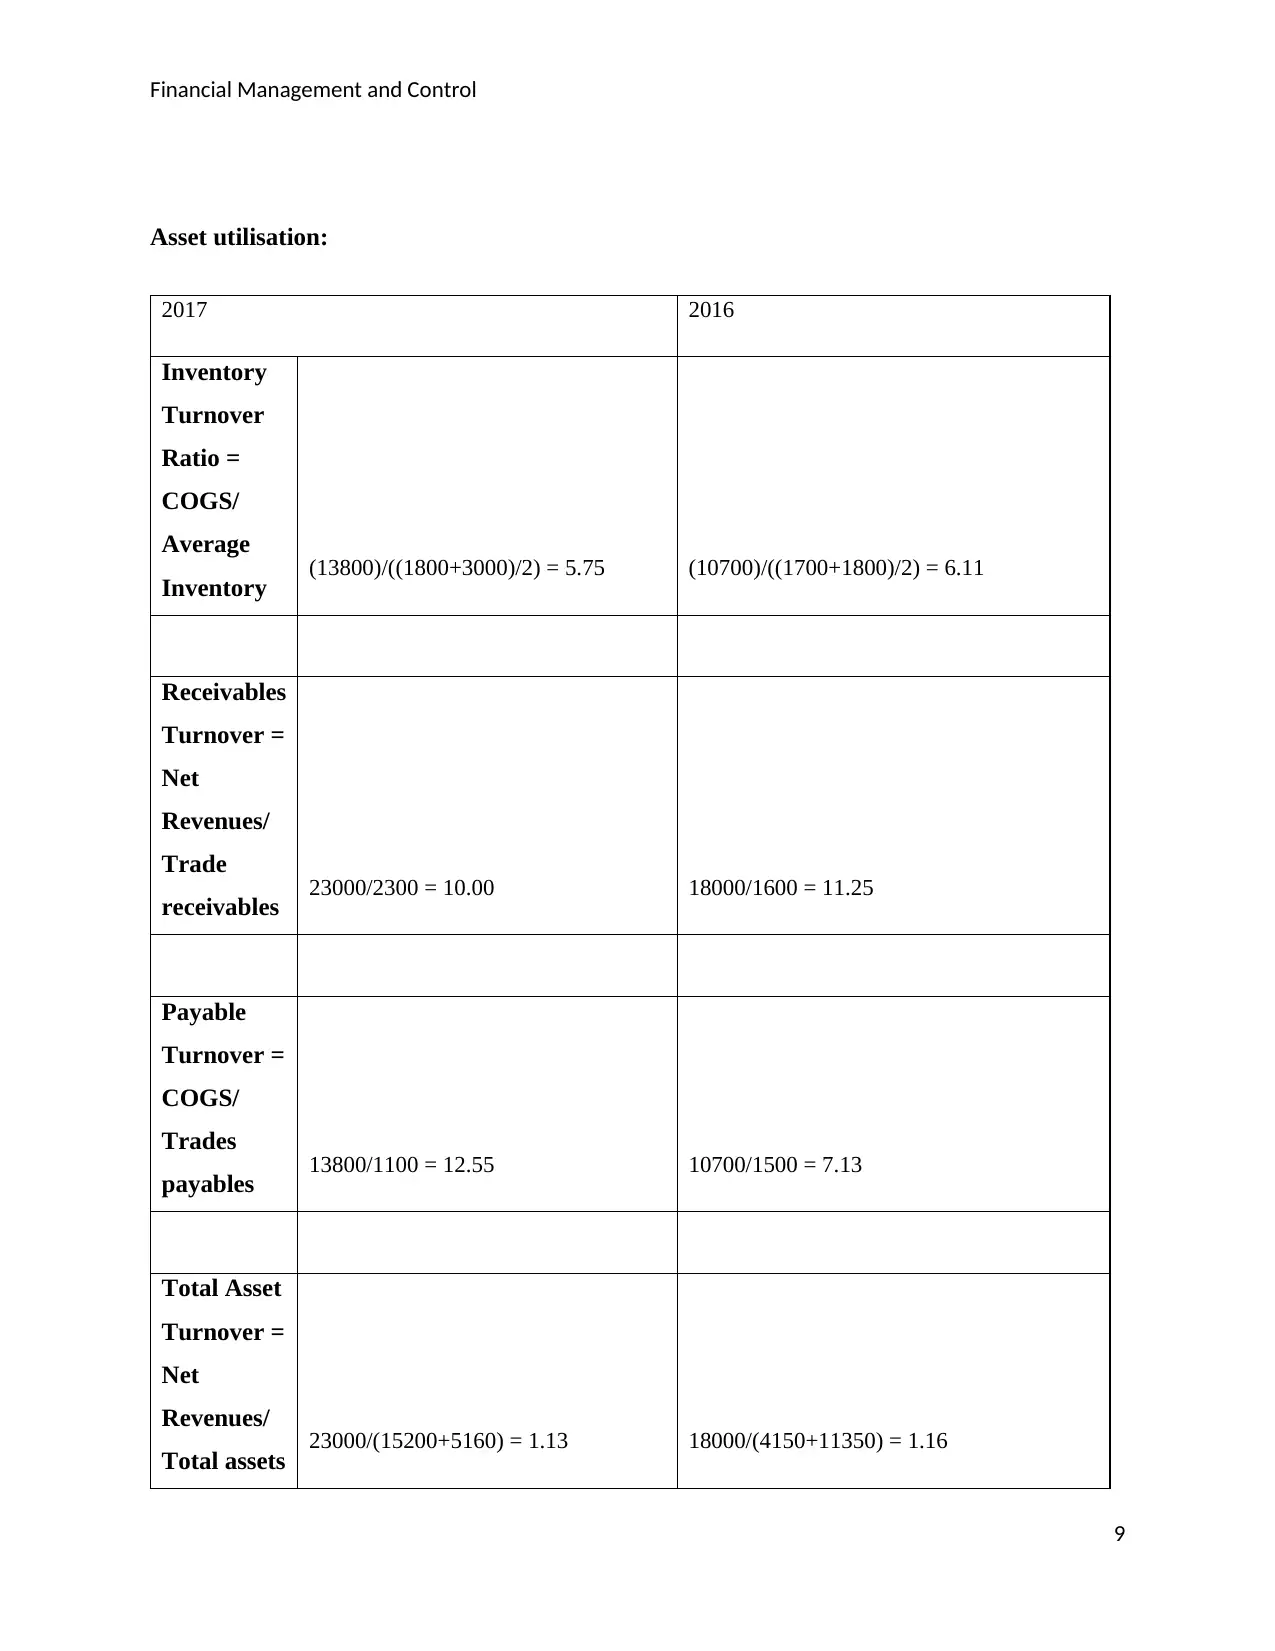
Asset utilisation:
2017 2016
Inventory
Turnover
Ratio =
COGS/
Average
Inventory (13800)/((1800+3000)/2) = 5.75 (10700)/((1700+1800)/2) = 6.11
Receivables
Turnover =
Net
Revenues/
Trade
receivables 23000/2300 = 10.00 18000/1600 = 11.25
Payable
Turnover =
COGS/
Trades
payables 13800/1100 = 12.55 10700/1500 = 7.13
Total Asset
Turnover =
Net
Revenues/
Total assets 23000/(15200+5160) = 1.13 18000/(4150+11350) = 1.16
9
Paraphrase This Document
Need a fresh take? Get an instant paraphrase of this document with our AI Paraphraser
Financial Management and Control
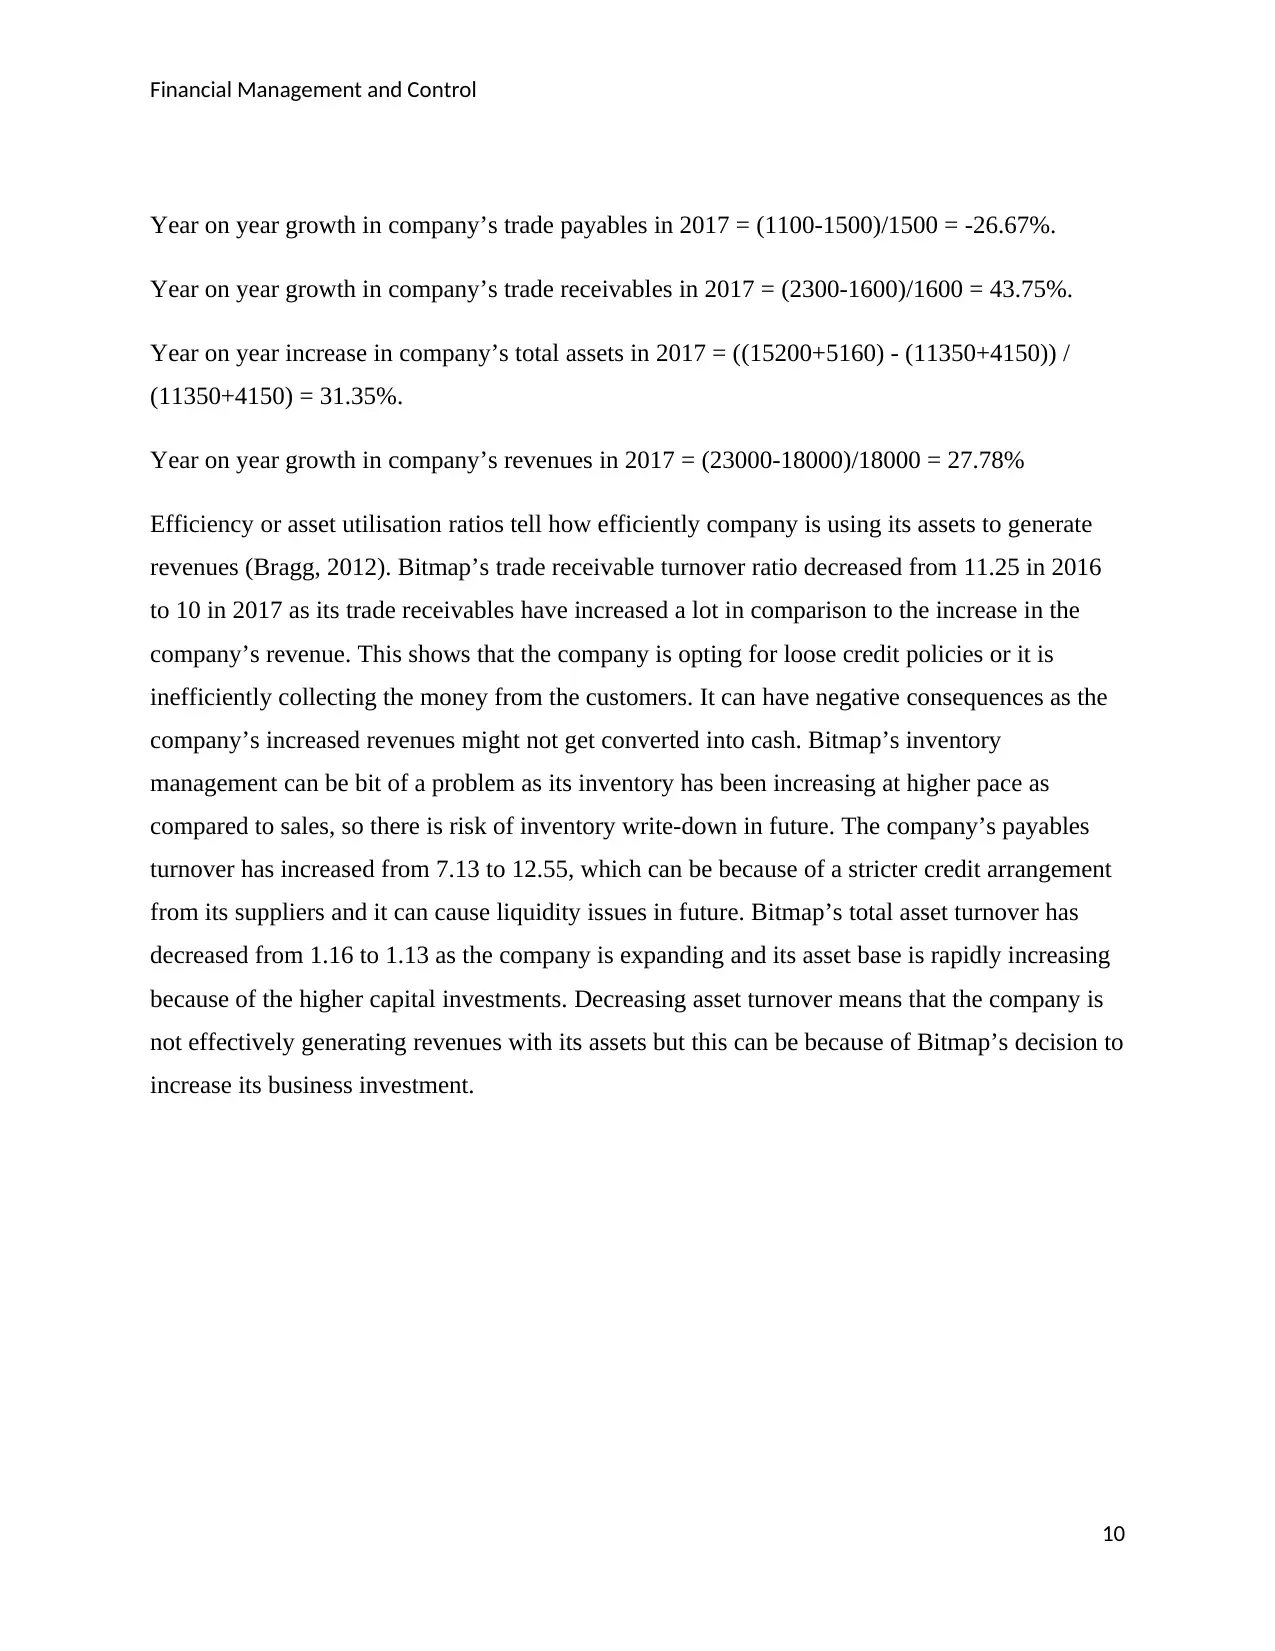
Year on year growth in company’s trade payables in 2017 = (1100-1500)/1500 = -26.67%.
Year on year growth in company’s trade receivables in 2017 = (2300-1600)/1600 = 43.75%.
Year on year increase in company’s total assets in 2017 = ((15200+5160) - (11350+4150)) /
(11350+4150) = 31.35%.
Year on year growth in company’s revenues in 2017 = (23000-18000)/18000 = 27.78%
Efficiency or asset utilisation ratios tell how efficiently company is using its assets to generate
revenues (Bragg, 2012). Bitmap’s trade receivable turnover ratio decreased from 11.25 in 2016
to 10 in 2017 as its trade receivables have increased a lot in comparison to the increase in the
company’s revenue. This shows that the company is opting for loose credit policies or it is
inefficiently collecting the money from the customers. It can have negative consequences as the
company’s increased revenues might not get converted into cash. Bitmap’s inventory
management can be bit of a problem as its inventory has been increasing at higher pace as
compared to sales, so there is risk of inventory write-down in future. The company’s payables
turnover has increased from 7.13 to 12.55, which can be because of a stricter credit arrangement
from its suppliers and it can cause liquidity issues in future. Bitmap’s total asset turnover has
decreased from 1.16 to 1.13 as the company is expanding and its asset base is rapidly increasing
because of the higher capital investments. Decreasing asset turnover means that the company is
not effectively generating revenues with its assets but this can be because of Bitmap’s decision to
increase its business investment.
10
Financial Management and Control
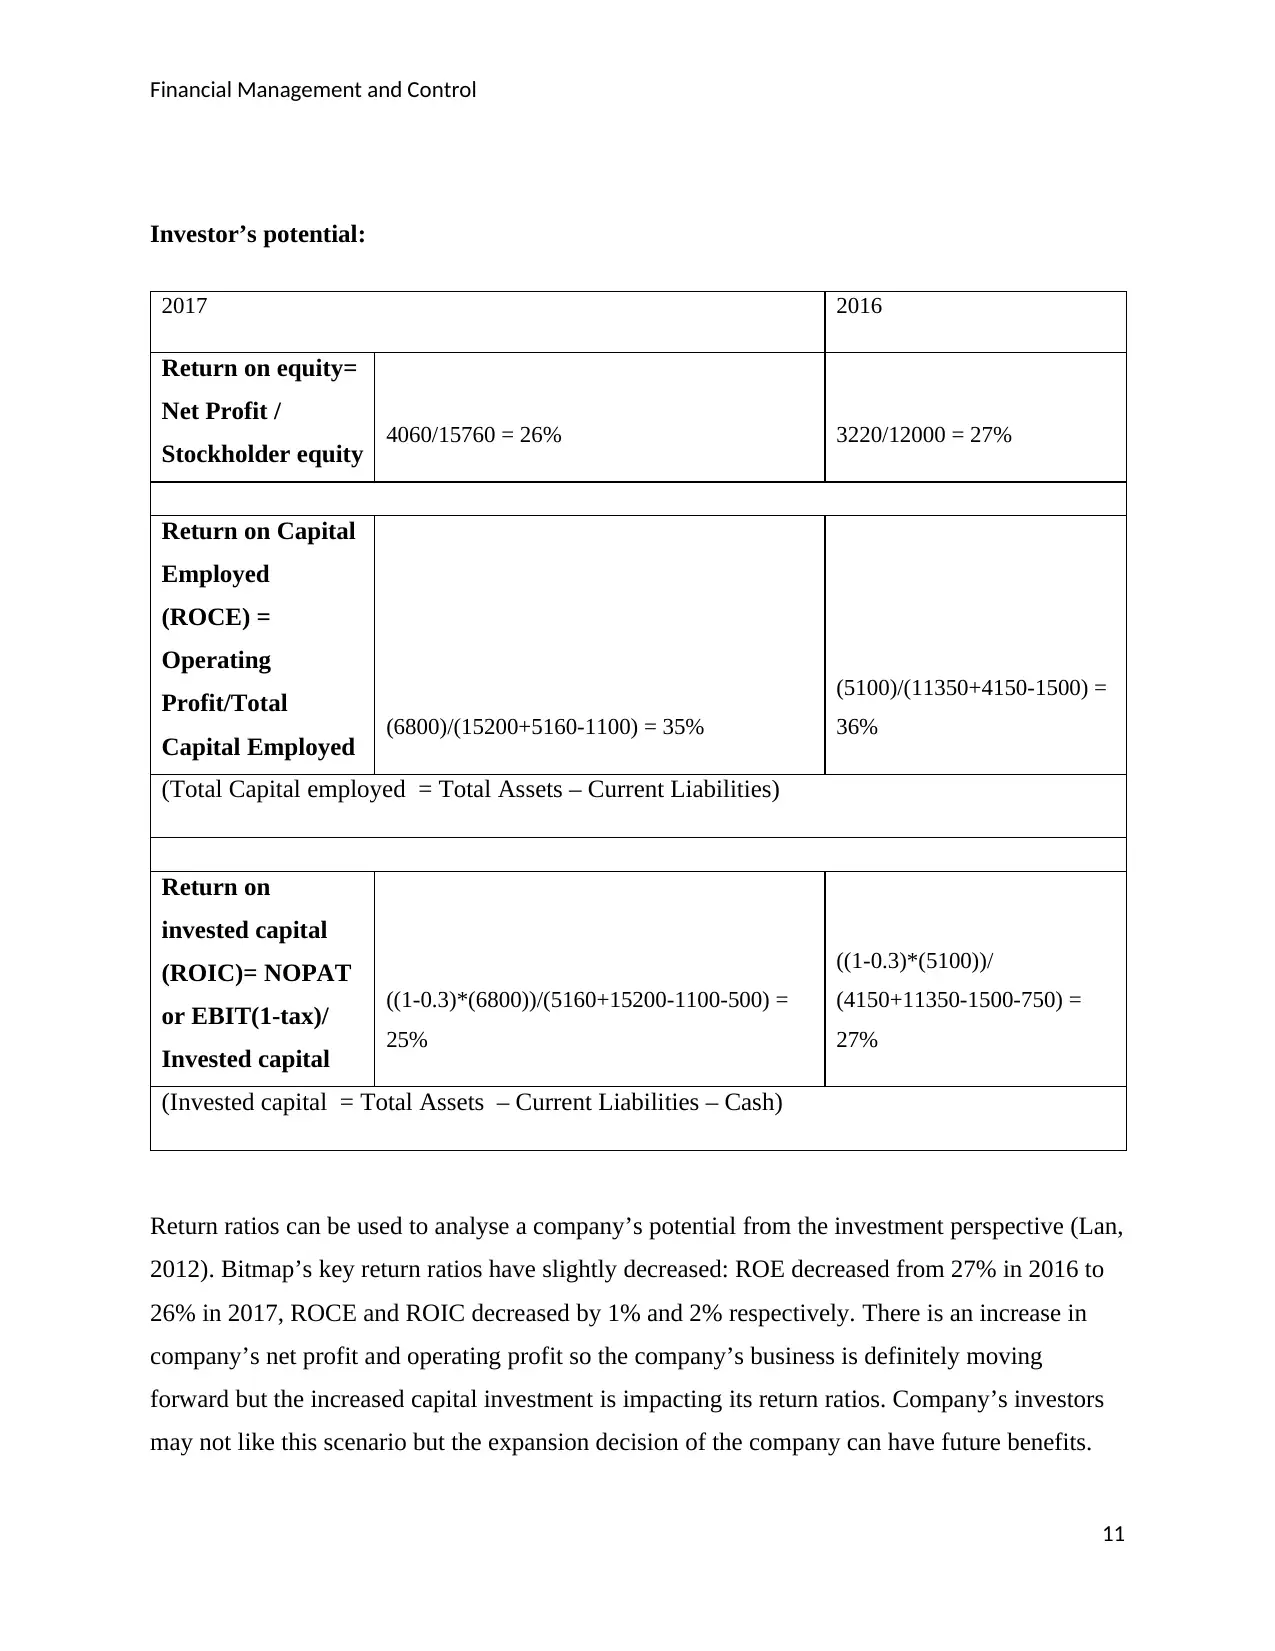
Investor’s potential:
2017 2016
Return on equity=
Net Profit /
Stockholder equity 4060/15760 = 26% 3220/12000 = 27%
Return on Capital
Employed
(ROCE) =
Operating
Profit/Total
Capital Employed (6800)/(15200+5160-1100) = 35%
(5100)/(11350+4150-1500) =
36%
(Total Capital employed = Total Assets – Current Liabilities)
Return on
invested capital
(ROIC)= NOPAT
or EBIT(1-tax)/
Invested capital
((1-0.3)*(6800))/(5160+15200-1100-500) =
25%
((1-0.3)*(5100))/
(4150+11350-1500-750) =
27%
(Invested capital = Total Assets – Current Liabilities – Cash)
Return ratios can be used to analyse a company’s potential from the investment perspective (Lan,
2012). Bitmap’s key return ratios have slightly decreased: ROE decreased from 27% in 2016 to
26% in 2017, ROCE and ROIC decreased by 1% and 2% respectively. There is an increase in
company’s net profit and operating profit so the company’s business is definitely moving
forward but the increased capital investment is impacting its return ratios. Company’s investors
may not like this scenario but the expansion decision of the company can have future benefits.
11
⊘ This is a preview!⊘
Do you want full access?
Subscribe today to unlock all pages.
Trusted by 1+ million students worldwide
1 out of 33
Related Documents


Your All-in-One AI-Powered Toolkit for Academic Success.
+13062052269
info@desklib.com
Available 24*7 on WhatsApp / Email
![[object Object]](/_next/static/media/star-bottom.7253800d.svg)
Unlock your academic potential
Copyright © 2020–2026 A2Z Services. All Rights Reserved. Developed and managed by ZUCOL.