Financial Performance Analysis of Boral Limited (BUS106 Report)
VerifiedAdded on 2022/11/07
|9
|1948
|386
Report
AI Summary
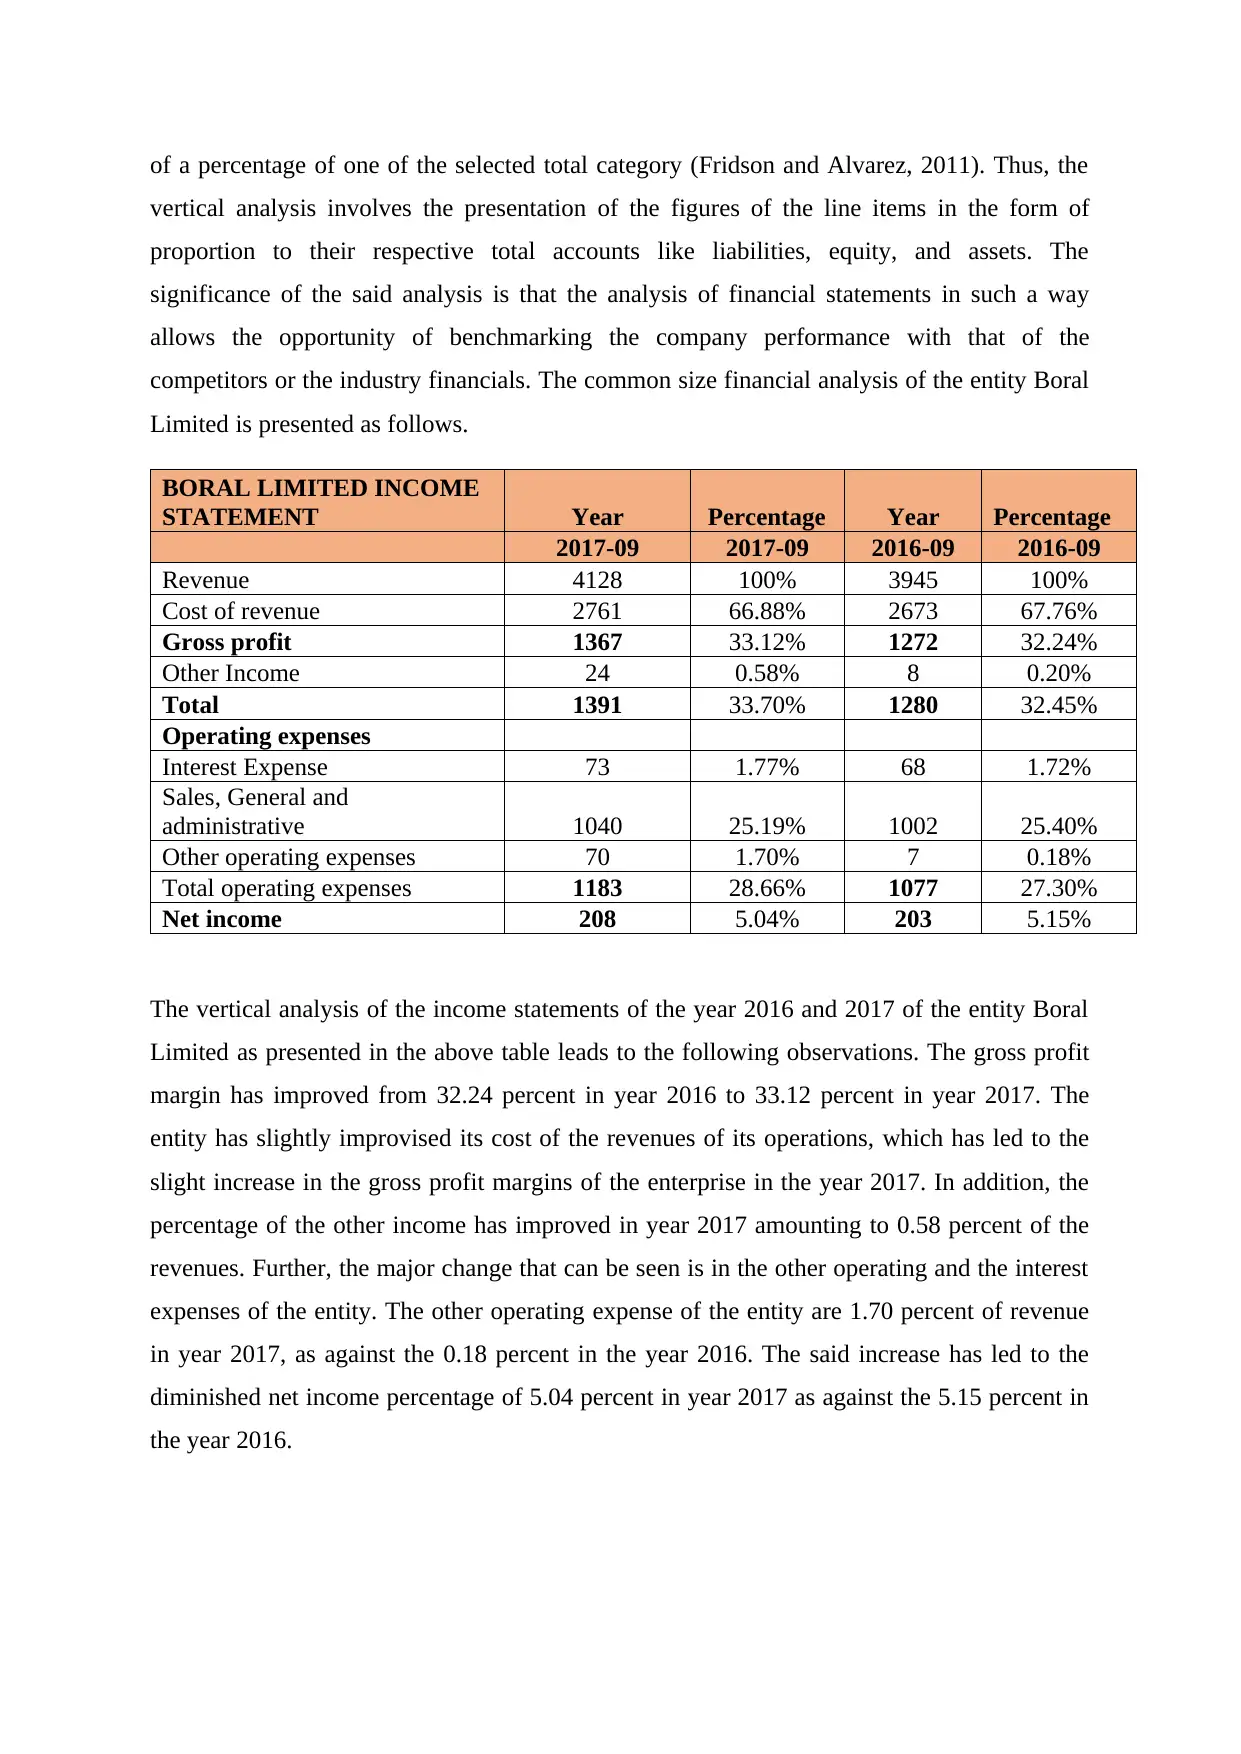
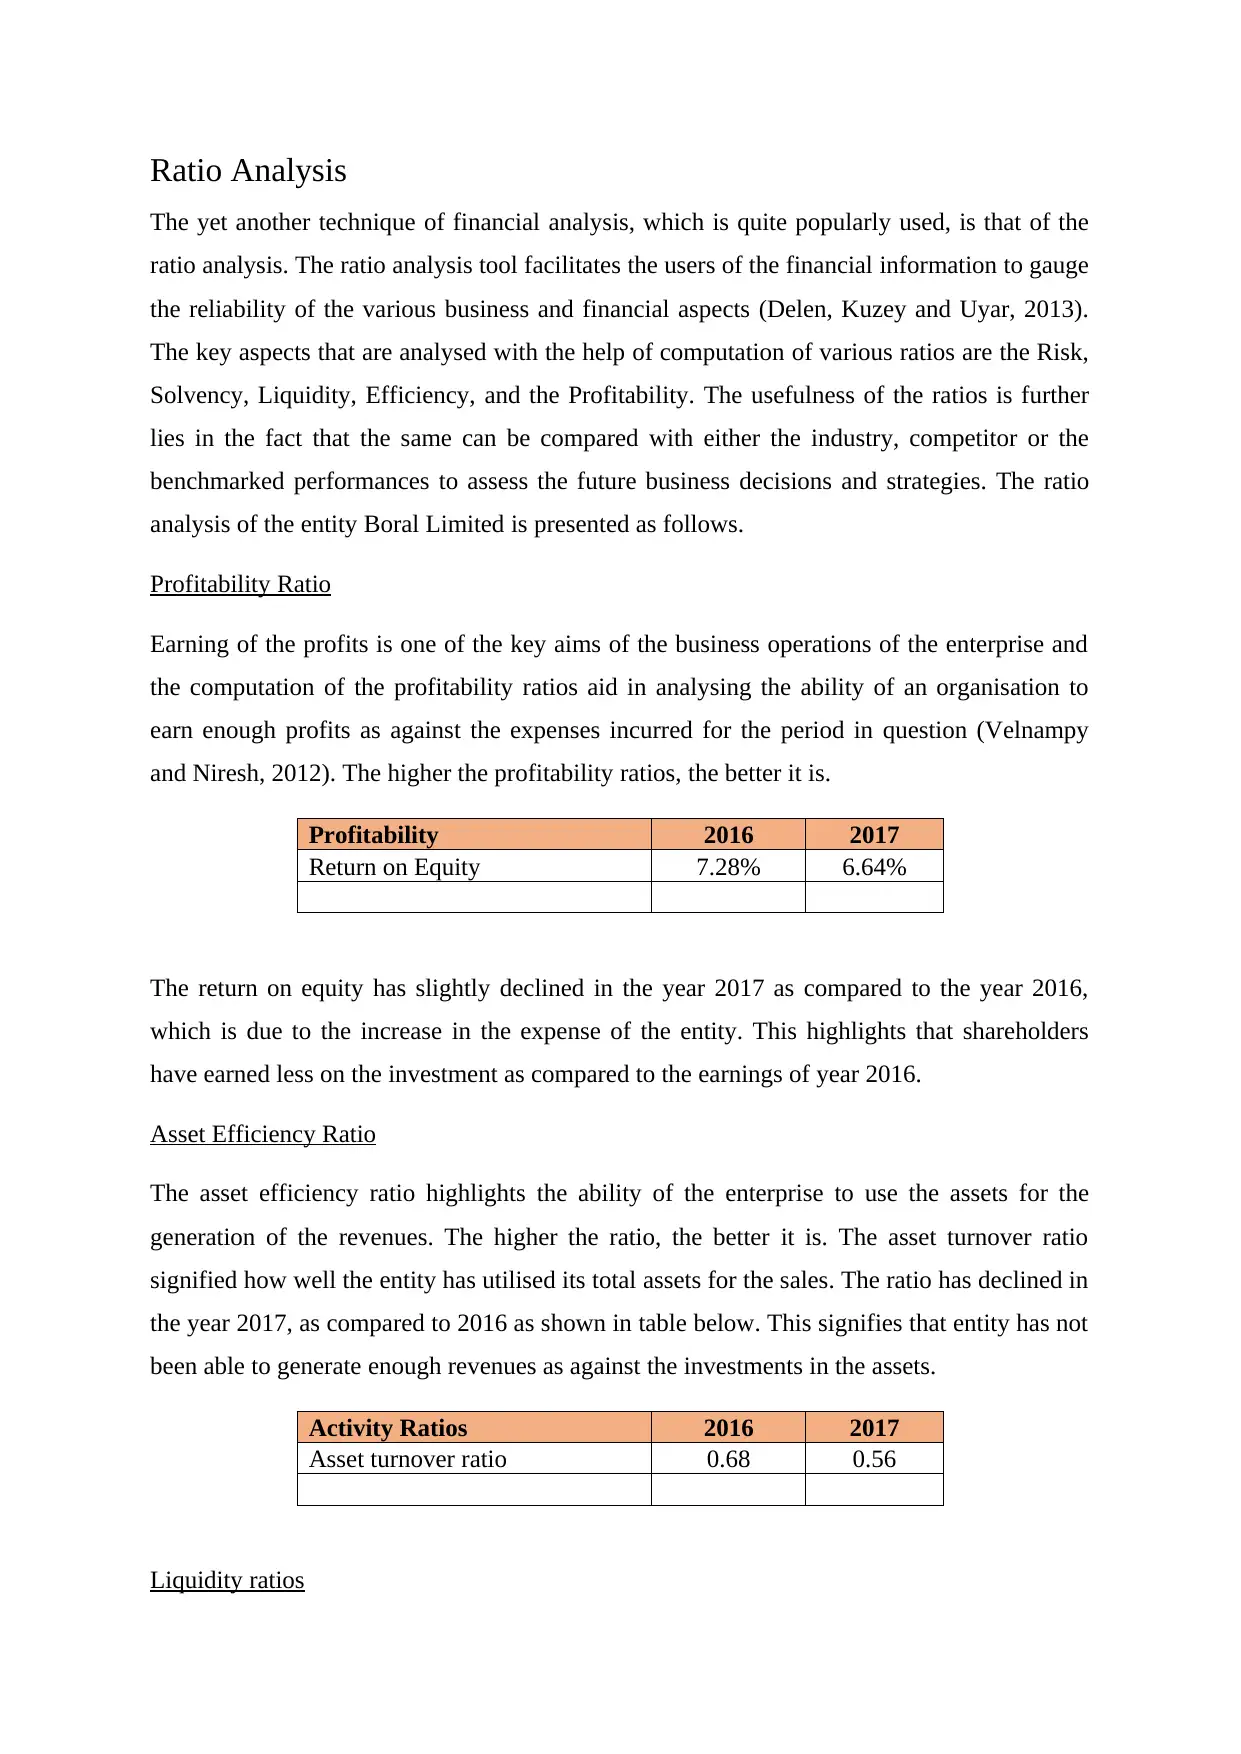
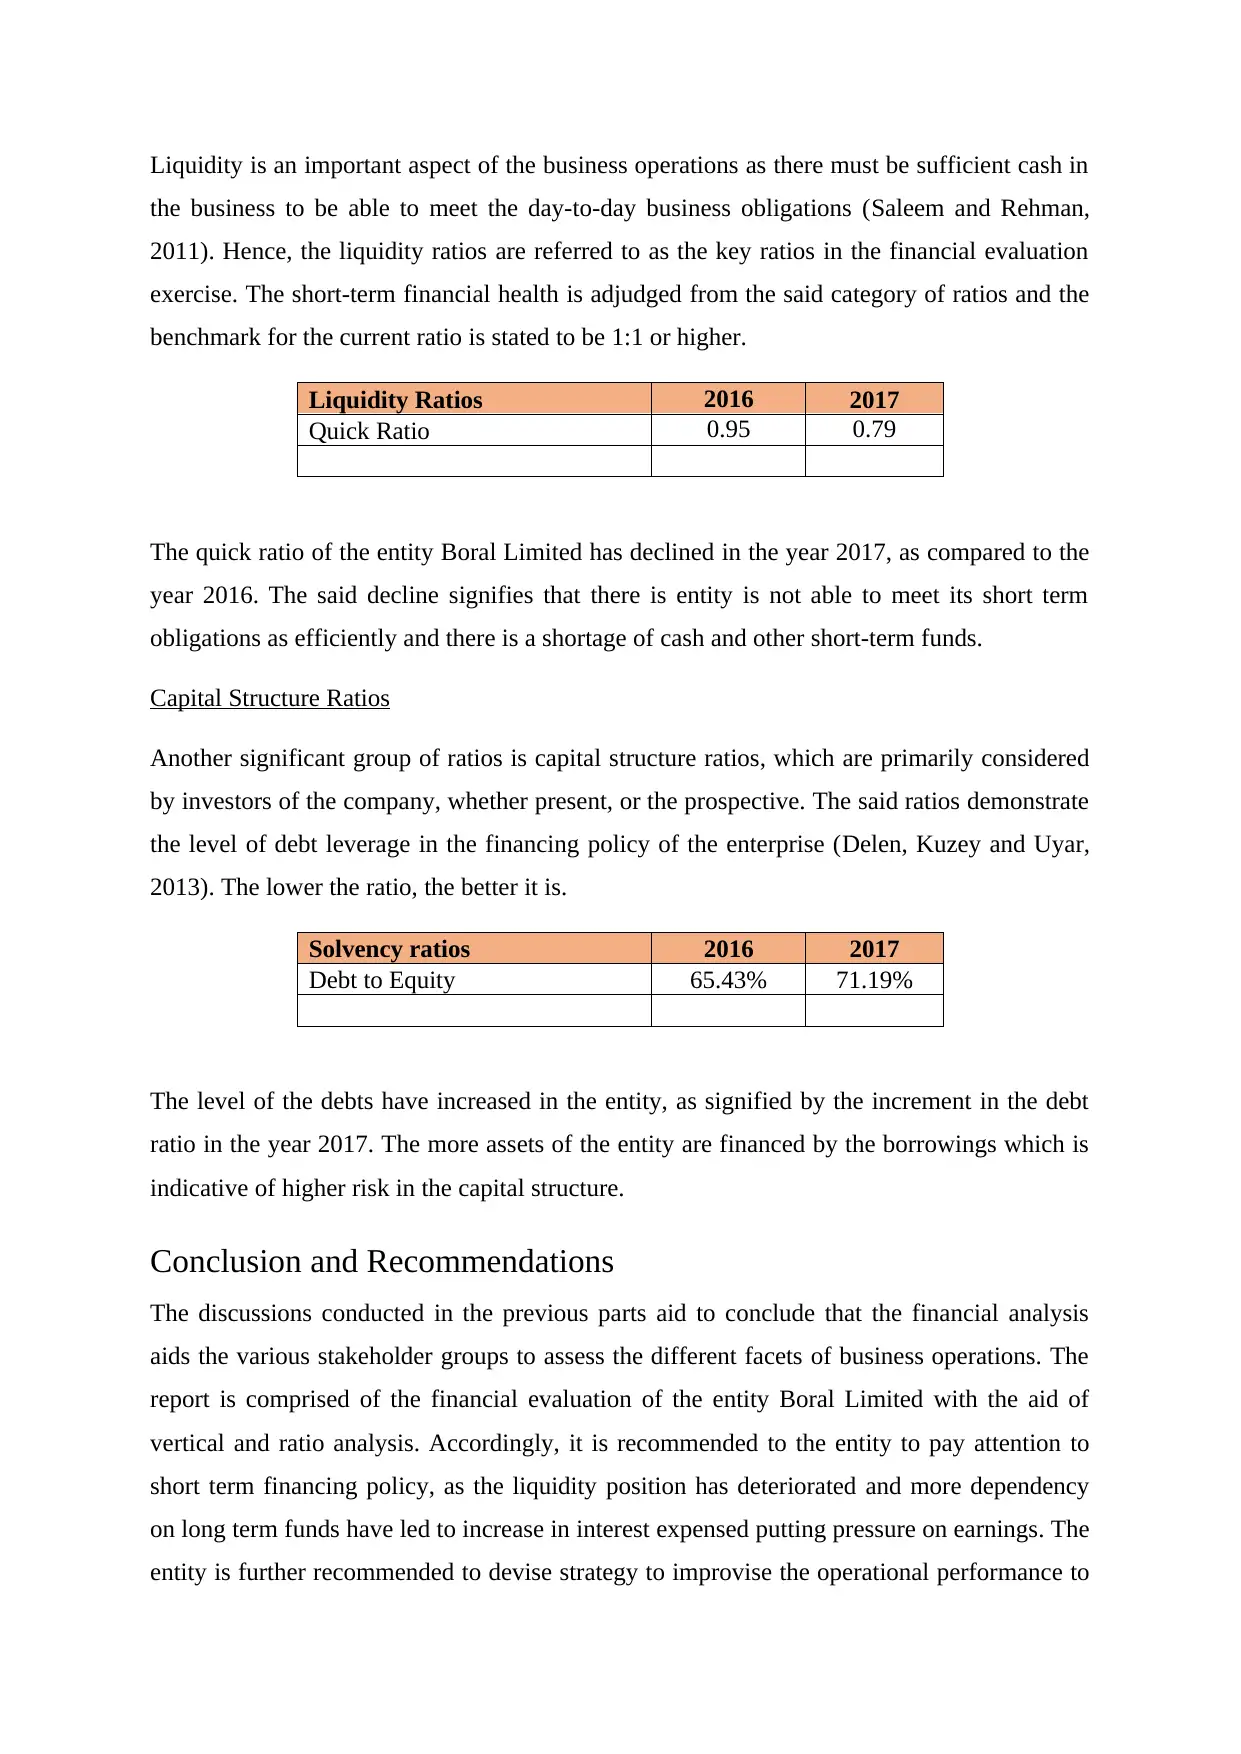
This report presents a financial analysis of Boral Limited, a company in the building and construction material industry. The analysis employs vertical and ratio analysis techniques to evaluate the company's financial performance for the years 2016 and 2017. The vertical analysis, also known as common-size analysis, examines the income statement, revealing changes in gross profit margins and operating expenses. Ratio analysis delves into profitability, asset efficiency, liquidity, and capital structure ratios, providing insights into the company's ability to generate profits, utilize assets effectively, manage short-term obligations, and handle debt. Key findings include a slight decline in return on equity, a decrease in asset turnover, and a decline in the quick ratio, indicating challenges in liquidity. The report concludes with recommendations for Boral Limited, emphasizing the need to improve short-term financing policies, enhance operational performance, and consider strategies for market or product expansion.

ACCOUNTING FOR BUSINESS
Name: _____
Student Id: ______
Company Name: Boral Limited
Name: _____
Student Id: ______
Company Name: Boral Limited
Paraphrase This Document
Need a fresh take? Get an instant paraphrase of this document with our AI Paraphraser

Executive Summary
The financial analysis aids the users of the information to make informative business
decisions with the aid of the insights gained using the various analysis techniques. The report
involves the financial analysis of the company Boral Limited, which is engaged in the
building and construction material industry. The vertical analysis leads to the observation that
the performance of the company has deteriorated in year 2017, as compared to year 2016; and
ratio analysis highlights the challenges in the liquidity position of the entity. Thus, the
organisation is recommended to develop strategies to use the short-term funds more
efficiently to earn the maximum returns from the same.

Contents
Introduction................................................................................................................................3
Overview of the company..........................................................................................................3
Vertical Analysis........................................................................................................................3
Ratio Analysis............................................................................................................................4
Conclusion and Recommendations............................................................................................6
References..................................................................................................................................7
⊘ This is a preview!⊘
Do you want full access?
Subscribe today to unlock all pages.

Trusted by 1+ million students worldwide

Introduction
Over the years, the complexities in the global business environment have enhanced together
with the competition. The result of the same is that the top management of the organisations
are required to consistently formulate and implement business strategies that are suitable to
the developments in the entity’s internal and external business environment. In order to
formulate a sound business strategy, it is imperative for the management of the entities to be
aware of the various financial aspects of the business operations (Higgins, 2012).
The objective of the following report is to examine the various financial aspects of the
business of the entity Boral Limited. Some of the key techniques that would be used for the
said evaluation are the common size or the vertical analysis, and the computation of the ratios
for years 2018 and 2019. The report will conclude with the recommendations as per the
insights gained on financial evaluation. The said evaluation is limited to the financial figures
as presented in the financial statements of the entity.
Overview of the company
The entity Boral Limited was founded in the year 1946 (Boral Limited, 2019a). Presently the
entity is a globally renowned organisation engaged in the business of supplying the building
products and the construction material such as the concrete, blocks, bricks, timber, roof tiles
and other materials. The company has three strong divisions namely Boral Australia; USG
Boral and Boral North America. The company presently employs more than 25000
employees across its divisions and distribution sites globally (Boral Limited, 2019b). The
Australian division of the company is listed on the Australia Stock Exchange under the
symbol “BLD.” The top competitors of the company in the building and construction material
industry are the CalStar Products, Soprema Group, James Hardie, Installed Building Products
and others (Craft, 2019).
There are various financial analysis techniques to evaluate the various aspects of the business.
The financial analysis of the company is presented in the below segment, using the
techniques of the vertical analysis and the ratio analysis.
Vertical Analysis
The Vertical analysis is also referred to as the common-size analysis. The said analysis is
comprised of the representation of the each line item on the financial statements in the form
Paraphrase This Document
Need a fresh take? Get an instant paraphrase of this document with our AI Paraphraser

of a percentage of one of the selected total category (Fridson and Alvarez, 2011). Thus, the
vertical analysis involves the presentation of the figures of the line items in the form of
proportion to their respective total accounts like liabilities, equity, and assets. The
significance of the said analysis is that the analysis of financial statements in such a way
allows the opportunity of benchmarking the company performance with that of the
competitors or the industry financials. The common size financial analysis of the entity Boral
Limited is presented as follows.
BORAL LIMITED INCOME
STATEMENT Year Percentage Year Percentage
2017-09 2017-09 2016-09 2016-09
Revenue 4128 100% 3945 100%
Cost of revenue 2761 66.88% 2673 67.76%
Gross profit 1367 33.12% 1272 32.24%
Other Income 24 0.58% 8 0.20%
Total 1391 33.70% 1280 32.45%
Operating expenses
Interest Expense 73 1.77% 68 1.72%
Sales, General and
administrative 1040 25.19% 1002 25.40%
Other operating expenses 70 1.70% 7 0.18%
Total operating expenses 1183 28.66% 1077 27.30%
Net income 208 5.04% 203 5.15%
The vertical analysis of the income statements of the year 2016 and 2017 of the entity Boral
Limited as presented in the above table leads to the following observations. The gross profit
margin has improved from 32.24 percent in year 2016 to 33.12 percent in year 2017. The
entity has slightly improvised its cost of the revenues of its operations, which has led to the
slight increase in the gross profit margins of the enterprise in the year 2017. In addition, the
percentage of the other income has improved in year 2017 amounting to 0.58 percent of the
revenues. Further, the major change that can be seen is in the other operating and the interest
expenses of the entity. The other operating expense of the entity are 1.70 percent of revenue
in year 2017, as against the 0.18 percent in the year 2016. The said increase has led to the
diminished net income percentage of 5.04 percent in year 2017 as against the 5.15 percent in
the year 2016.

Ratio Analysis
The yet another technique of financial analysis, which is quite popularly used, is that of the
ratio analysis. The ratio analysis tool facilitates the users of the financial information to gauge
the reliability of the various business and financial aspects (Delen, Kuzey and Uyar, 2013).
The key aspects that are analysed with the help of computation of various ratios are the Risk,
Solvency, Liquidity, Efficiency, and the Profitability. The usefulness of the ratios is further
lies in the fact that the same can be compared with either the industry, competitor or the
benchmarked performances to assess the future business decisions and strategies. The ratio
analysis of the entity Boral Limited is presented as follows.
Profitability Ratio
Earning of the profits is one of the key aims of the business operations of the enterprise and
the computation of the profitability ratios aid in analysing the ability of an organisation to
earn enough profits as against the expenses incurred for the period in question (Velnampy
and Niresh, 2012). The higher the profitability ratios, the better it is.
Profitability 2016 2017
Return on Equity 7.28% 6.64%
The return on equity has slightly declined in the year 2017 as compared to the year 2016,
which is due to the increase in the expense of the entity. This highlights that shareholders
have earned less on the investment as compared to the earnings of year 2016.
Asset Efficiency Ratio
The asset efficiency ratio highlights the ability of the enterprise to use the assets for the
generation of the revenues. The higher the ratio, the better it is. The asset turnover ratio
signified how well the entity has utilised its total assets for the sales. The ratio has declined in
the year 2017, as compared to 2016 as shown in table below. This signifies that entity has not
been able to generate enough revenues as against the investments in the assets.
Activity Ratios 2016 2017
Asset turnover ratio 0.68 0.56
Liquidity ratios
⊘ This is a preview!⊘
Do you want full access?
Subscribe today to unlock all pages.

Trusted by 1+ million students worldwide

Liquidity is an important aspect of the business operations as there must be sufficient cash in
the business to be able to meet the day-to-day business obligations (Saleem and Rehman,
2011). Hence, the liquidity ratios are referred to as the key ratios in the financial evaluation
exercise. The short-term financial health is adjudged from the said category of ratios and the
benchmark for the current ratio is stated to be 1:1 or higher.
Liquidity Ratios 2016 2017
Quick Ratio 0.95 0.79
The quick ratio of the entity Boral Limited has declined in the year 2017, as compared to the
year 2016. The said decline signifies that there is entity is not able to meet its short term
obligations as efficiently and there is a shortage of cash and other short-term funds.
Capital Structure Ratios
Another significant group of ratios is capital structure ratios, which are primarily considered
by investors of the company, whether present, or the prospective. The said ratios demonstrate
the level of debt leverage in the financing policy of the enterprise (Delen, Kuzey and Uyar,
2013). The lower the ratio, the better it is.
Solvency ratios 2016 2017
Debt to Equity 65.43% 71.19%
The level of the debts have increased in the entity, as signified by the increment in the debt
ratio in the year 2017. The more assets of the entity are financed by the borrowings which is
indicative of higher risk in the capital structure.
Conclusion and Recommendations
The discussions conducted in the previous parts aid to conclude that the financial analysis
aids the various stakeholder groups to assess the different facets of business operations. The
report is comprised of the financial evaluation of the entity Boral Limited with the aid of
vertical and ratio analysis. Accordingly, it is recommended to the entity to pay attention to
short term financing policy, as the liquidity position has deteriorated and more dependency
on long term funds have led to increase in interest expensed putting pressure on earnings. The
entity is further recommended to devise strategy to improvise the operational performance to
Paraphrase This Document
Need a fresh take? Get an instant paraphrase of this document with our AI Paraphraser

aid in earning more profits as against the assets held in business. The new markets or new
products may be evaluated for the same.

References
Boral Limited (2019a) History [online] Available from: https://www.boral.com/history/1946-
1949 [Accessed on: 19 September 2019].
Boral Limited (2019b) About Boral [online] Available from: https://www.boral.com/about
[Accessed on: 19 September 2019].
Craft (2019) Boral competitors [online] Available from:
https://craft.co/boral-limited/competitors [Accessed on: 19 September 2019].
Delen, D., Kuzey, C., and Uyar, A. (2013) Measuring firm performance using financial
ratios: A decision tree approach. Expert Systems with Applications, 40(10), pp. 3970-3983.
Fridson, M. S., and Alvarez, F. (2011) Financial statement analysis: a practitioner's guide
Vol. 597. UK: John Wiley & Sons.
Higgins, R. C. (2012) Analysis for financial management. UK: McGraw-Hill/Irwin.
Saleem, Q., and Rehman, R. U. (2011) Impacts of liquidity ratios on profitability.
Interdisciplinary journal of research in business, 1(7), pp. 95-98.
Velnampy, T., and Niresh, J. A. (2012) The relationship between capital structure and
profitability. Global Journal of Management and Business Research, 12(13).
⊘ This is a preview!⊘
Do you want full access?
Subscribe today to unlock all pages.

Trusted by 1+ million students worldwide
1 out of 9
Related Documents

Your All-in-One AI-Powered Toolkit for Academic Success.
+13062052269
info@desklib.com
Available 24*7 on WhatsApp / Email
Unlock your academic potential
Copyright © 2020–2025 A2Z Services. All Rights Reserved. Developed and managed by ZUCOL.