HI5002 Finance for Business: Caltex Australia Financial Report
VerifiedAdded on 2023/04/03
|22
|4550
|450
Report
AI Summary
This report analyzes the financial performance of Caltex Australia to provide investment recommendations. It includes a detailed financial analysis using profitability ratios, operating efficiency ratios, and cash management techniques. The report also performs sensitivity analysis, identifies systematic and unsystematic risks, and evaluates the company's dividend policy. The analysis covers the period from 2015 to 2018, providing a comprehensive view of Caltex Australia's financial health. The report concludes with a recommendation to a potential investor, based on the overall evaluation of the company's financial position and future prospects. The assignment follows the guidelines of HI5002 Finance for Business, a group assignment, and aims to examine key financial concepts and performance measures.
1
Unit Code: HI5002
Unit Title: Finance for Business
Group Assignment
Unit Code: HI5002
Unit Title: Finance for Business
Group Assignment
Paraphrase This Document
Need a fresh take? Get an instant paraphrase of this document with our AI Paraphraser
2
Abstract
The report has evaluated the financial performance of Caltex Australia for proving
recommendation to a potential investors regarding investment within the company. The financial
performance has been analyzed with the use of ratio analysis, cash management, and sensitivity
analysis and dividend payout ratio. It is recommended to an investor to hold back the share and
not to invest within the company due to its weak financial position as depicted with ratio
analysis.
3
Contents
Abstract............................................................................................................................................2
Section I: Introduction.....................................................................................................................4
Section II: Detailed financial analysis of Caltex Australia..............................................................4
Section 2.1: Brief description of Caltex Australia...........................................................................4
Section 2.2: Use of ratios to evaluate the performance of Caltex Australia....................................4
Profitability Ratios of Caltex Australia........................................................................................4
Operating Efficiency Ratio..........................................................................................................7
Section 2.3: Use of marketable securities for cash management.....................................................9
Section 2.4: Sensitivity Analysis through using the given data.....................................................10
Section 2.5: Identification and discussion on systematic risk and Unsystematic risk that impacts
the performance of Caltex Australia..............................................................................................16
Systematic Risks associated with Caltex Australia....................................................................16
Unsystematic Risks associated with the Caltex Australia.........................................................16
Section 2.6: Calculation of dividend payout of Caltex Australia for last three years and
interpretation of dividend policy used by Caltex...........................................................................17
Dividend Payout Ratio of Caltex Australia................................................................................17
Section III: Letter of Recommendation to the client.....................................................................19
Section IV: Conclusion..................................................................................................................19
References......................................................................................................................................20
⊘ This is a preview!⊘
Do you want full access?
Subscribe today to unlock all pages.
Trusted by 1+ million students worldwide
4
Section I: Introduction
The purpose of the assignment is to provide recommendation to an institutional investor
aiming to invest within Australian market by undertaking an analysis of the financial
performance of an ASX listed entity. The ASX listed entity selected for the purpose of
conducting financial evaluation is Caltex Australia, a supplier of transport fuel and convenience
retailing products. The financial evaluation of the selected company has been done by analysis of
its performance ratios such as profitability and operational efficiency. This is followed by
analyzing its cash management and performing sensitivity analysis on the data provided. Also, it
has outlined the systematic and unsystematic risks related with the company and also evaluated
its dividend policy. Lastly, it provides recommendation to a potential investor regarding the
financial health of the company to support the investment decisions on the basis of overall
evaluation carried out. It also includes a conclusions section in the last to summarize the overall
findings generated through the report.
Section II: Detailed financial analysis of Caltex Australia
Section 2.1: Brief description of Caltex Australia
Caltex Australia is a publicly listed ASX company involved in supplying of transport fuel
and also operates as a convenient retailer within Australian market. The core segments of the
company includes purchasing, refining,, distributing and marketing of petroleum based products
and also having its own convenience stores in the country. It has established in period of 1990s
and is regarded to be only fuel based company of Australia that is listed on the ASX. It has
presently attained a distinctive position within the oil and gas sector of the country owing to its
leading position in transporting fuels. It is known to supply about one third of transport fuel
needs within Australian market. The leading position has been attained by the company owning
to its agile supply chain that enables it in providing safe and high quality fuel based products to
its diverse customers such as retail, mining, aviation, agriculture, automotive sector and the
government. It has developed its unique position among all the refiner and marketers in Australia
by conducting its operations in an independent manner and all the decisions are taken by the
management and Board members as it is only publicly listed company. It has the presence of
about 3,500 employees working across the country and is known to be one of the biggest
companies developing attractive job opportunities and supporting the development of
employment sector within the country (Caltex Australia: Our Company, 2018).
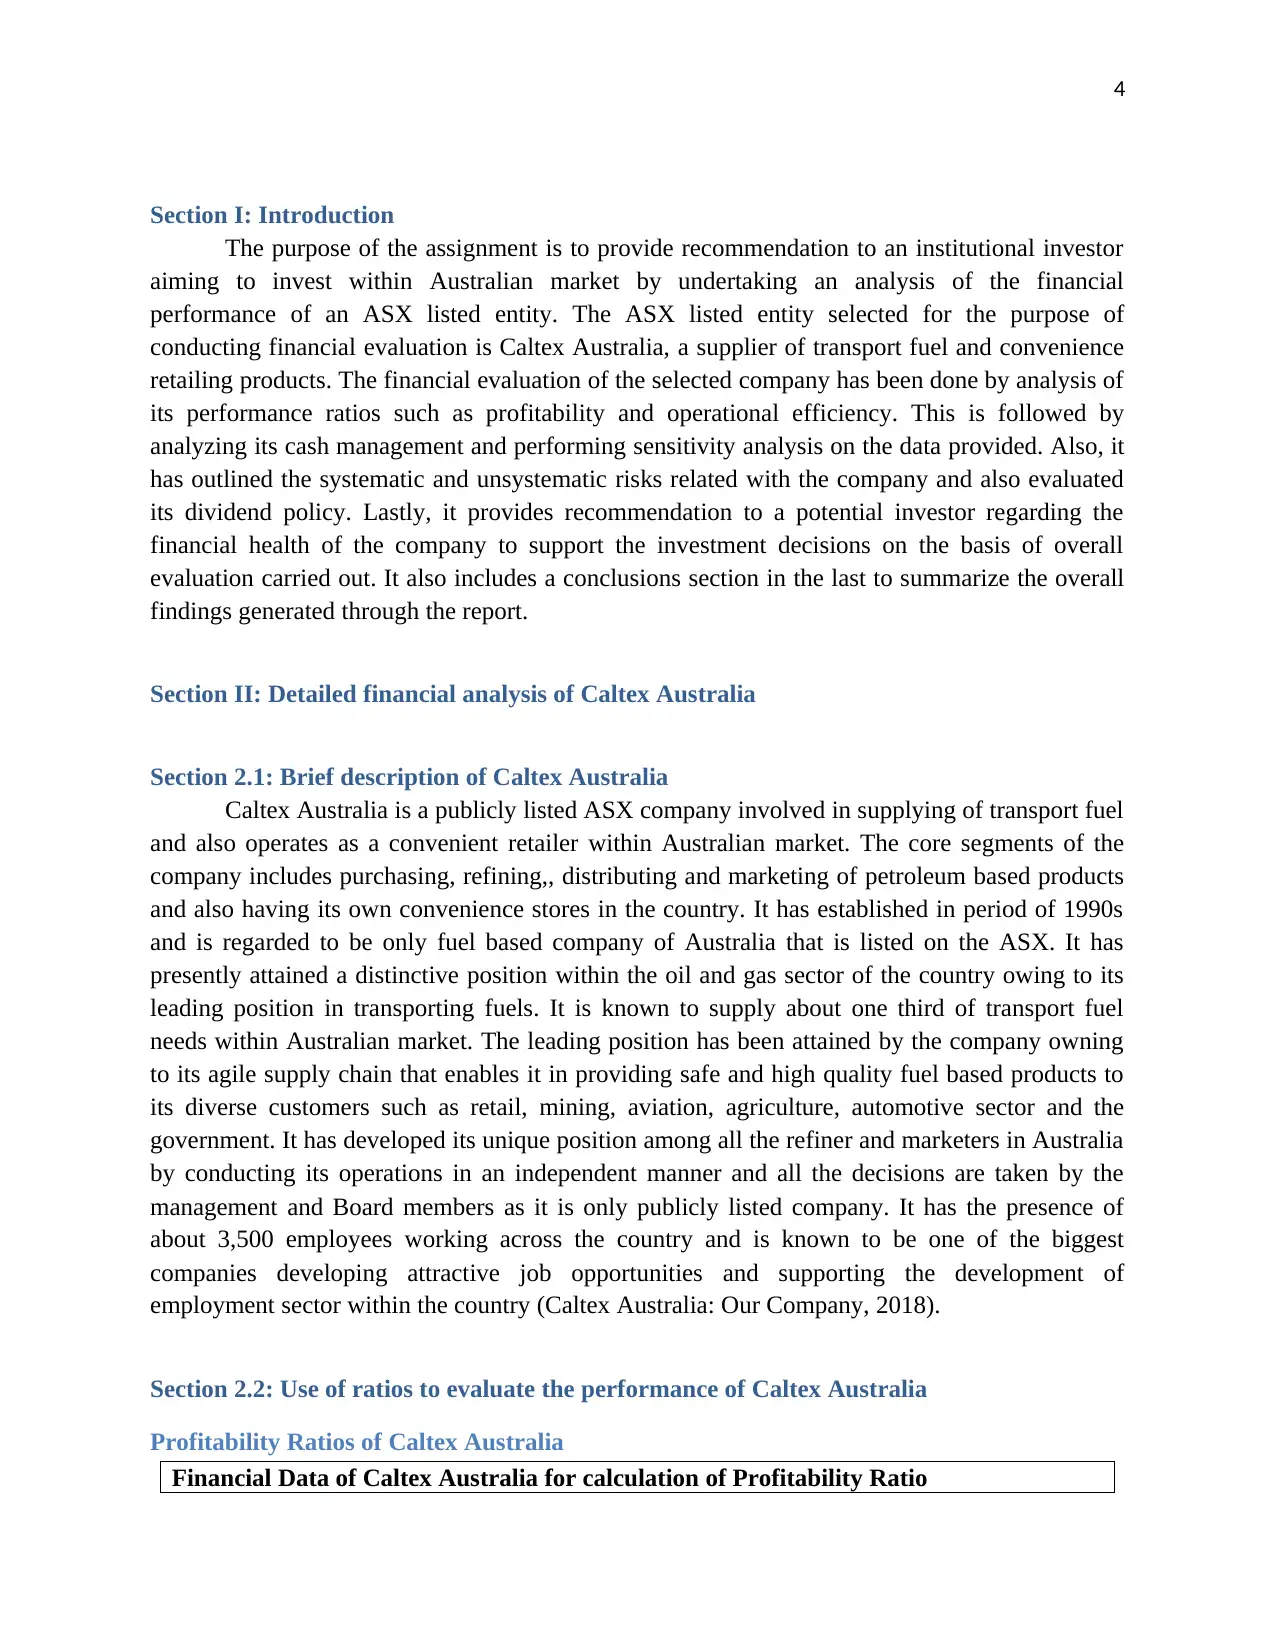
Section 2.2: Use of ratios to evaluate the performance of Caltex Australia
Profitability Ratios of Caltex Australia
Financial Data of Caltex Australia for calculation of Profitability Ratio
Section I: Introduction
The purpose of the assignment is to provide recommendation to an institutional investor
aiming to invest within Australian market by undertaking an analysis of the financial
performance of an ASX listed entity. The ASX listed entity selected for the purpose of
conducting financial evaluation is Caltex Australia, a supplier of transport fuel and convenience
retailing products. The financial evaluation of the selected company has been done by analysis of
its performance ratios such as profitability and operational efficiency. This is followed by
analyzing its cash management and performing sensitivity analysis on the data provided. Also, it
has outlined the systematic and unsystematic risks related with the company and also evaluated
its dividend policy. Lastly, it provides recommendation to a potential investor regarding the
financial health of the company to support the investment decisions on the basis of overall
evaluation carried out. It also includes a conclusions section in the last to summarize the overall
findings generated through the report.
Section II: Detailed financial analysis of Caltex Australia
Section 2.1: Brief description of Caltex Australia
Caltex Australia is a publicly listed ASX company involved in supplying of transport fuel
and also operates as a convenient retailer within Australian market. The core segments of the
company includes purchasing, refining,, distributing and marketing of petroleum based products
and also having its own convenience stores in the country. It has established in period of 1990s
and is regarded to be only fuel based company of Australia that is listed on the ASX. It has
presently attained a distinctive position within the oil and gas sector of the country owing to its
leading position in transporting fuels. It is known to supply about one third of transport fuel
needs within Australian market. The leading position has been attained by the company owning
to its agile supply chain that enables it in providing safe and high quality fuel based products to
its diverse customers such as retail, mining, aviation, agriculture, automotive sector and the
government. It has developed its unique position among all the refiner and marketers in Australia
by conducting its operations in an independent manner and all the decisions are taken by the
management and Board members as it is only publicly listed company. It has the presence of
about 3,500 employees working across the country and is known to be one of the biggest
companies developing attractive job opportunities and supporting the development of
employment sector within the country (Caltex Australia: Our Company, 2018).
Section 2.2: Use of ratios to evaluate the performance of Caltex Australia
Profitability Ratios of Caltex Australia
Financial Data of Caltex Australia for calculation of Profitability Ratio
Paraphrase This Document
Need a fresh take? Get an instant paraphrase of this document with our AI Paraphraser
5
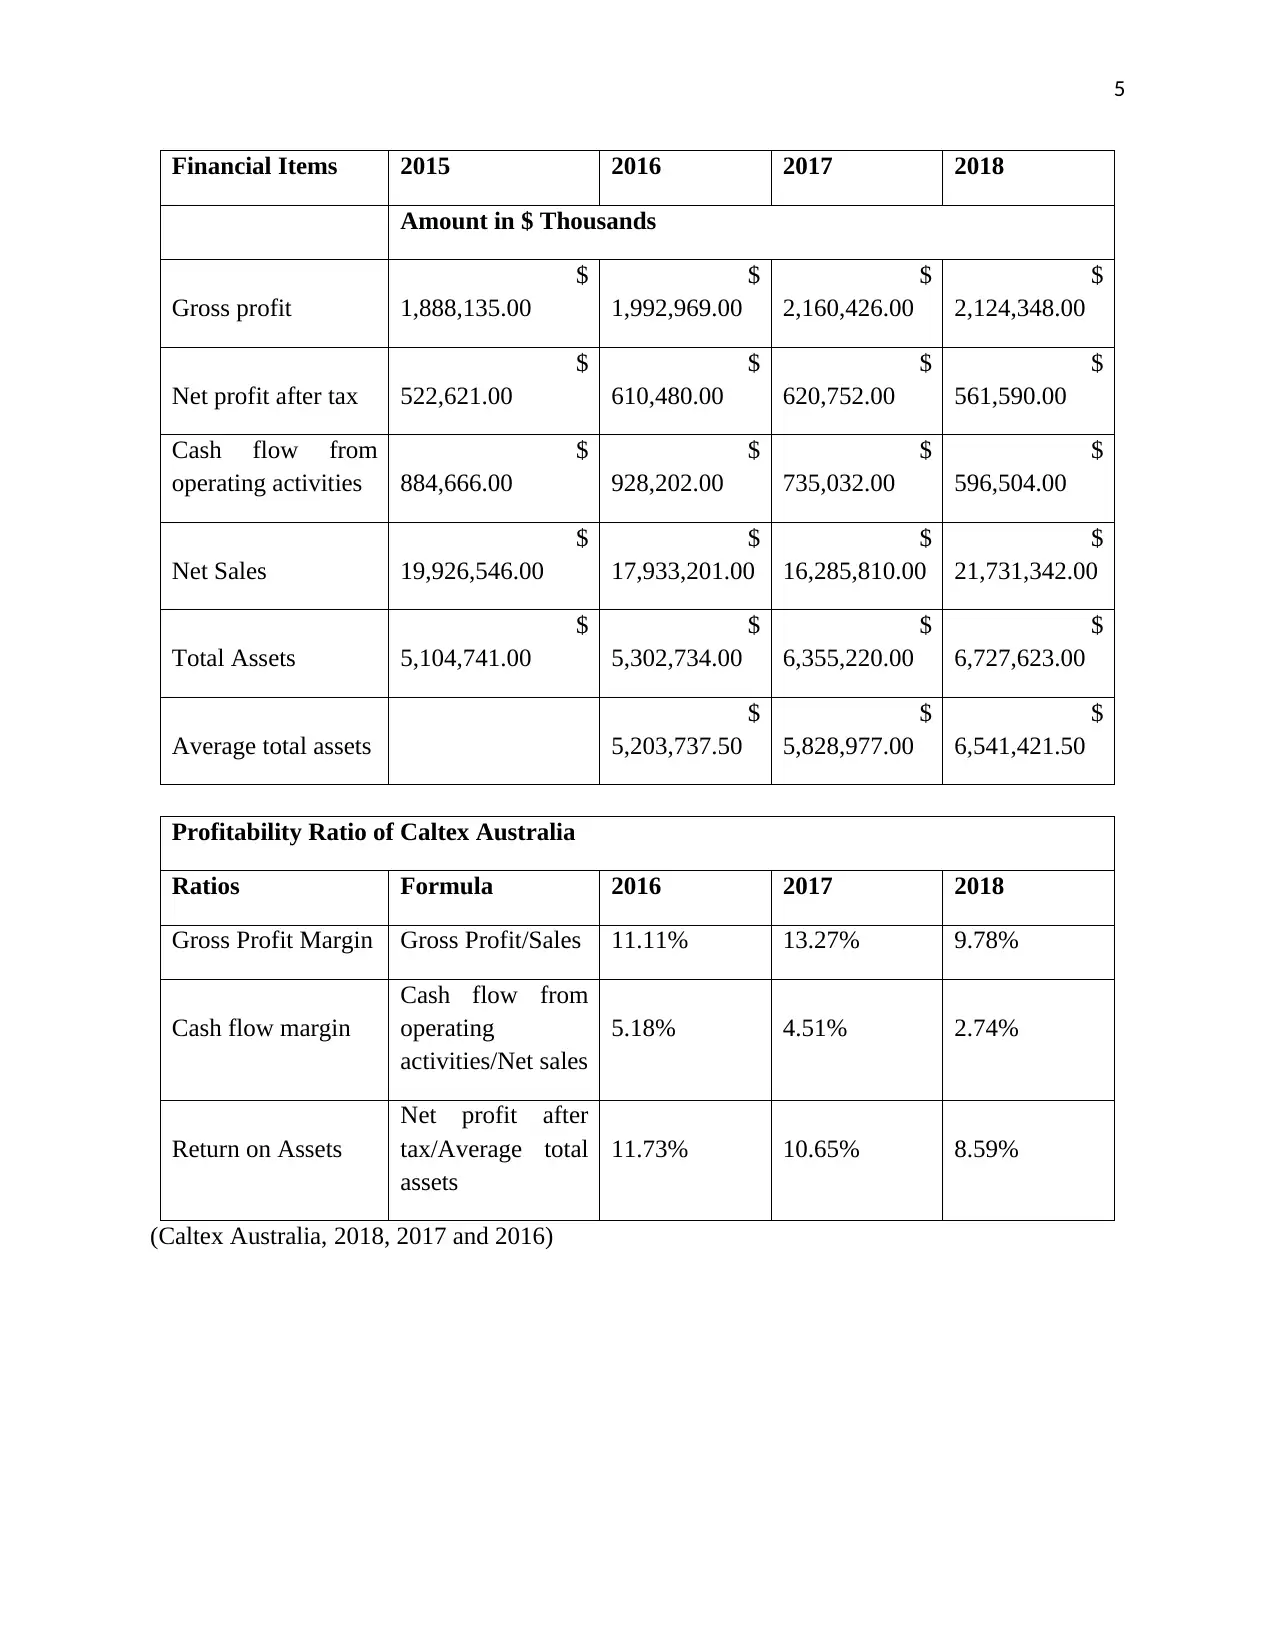
Financial Items 2015 2016 2017 2018
Amount in $ Thousands
Gross profit
$
1,888,135.00
$
1,992,969.00
$
2,160,426.00
$
2,124,348.00
Net profit after tax
$
522,621.00
$
610,480.00
$
620,752.00
$
561,590.00
Cash flow from
operating activities
$
884,666.00
$
928,202.00
$
735,032.00
$
596,504.00
Net Sales
$
19,926,546.00
$
17,933,201.00
$
16,285,810.00
$
21,731,342.00
Total Assets
$
5,104,741.00
$
5,302,734.00
$
6,355,220.00
$
6,727,623.00
Average total assets
$
5,203,737.50
$
5,828,977.00
$
6,541,421.50
Profitability Ratio of Caltex Australia
Ratios Formula 2016 2017 2018
Gross Profit Margin Gross Profit/Sales 11.11% 13.27% 9.78%
Cash flow margin
Cash flow from
operating
activities/Net sales
5.18% 4.51% 2.74%
Return on Assets
Net profit after
tax/Average total
assets
11.73% 10.65% 8.59%
(Caltex Australia, 2018, 2017 and 2016)
6
2016 2017 2018
0.00%
2.00%
4.00%
6.00%
8.00%
10.00%
12.00%
14.00%
11.11%
13.27%
9.78%
5.18%
4.51%
2.74%
11.73%
10.65%
8.59%
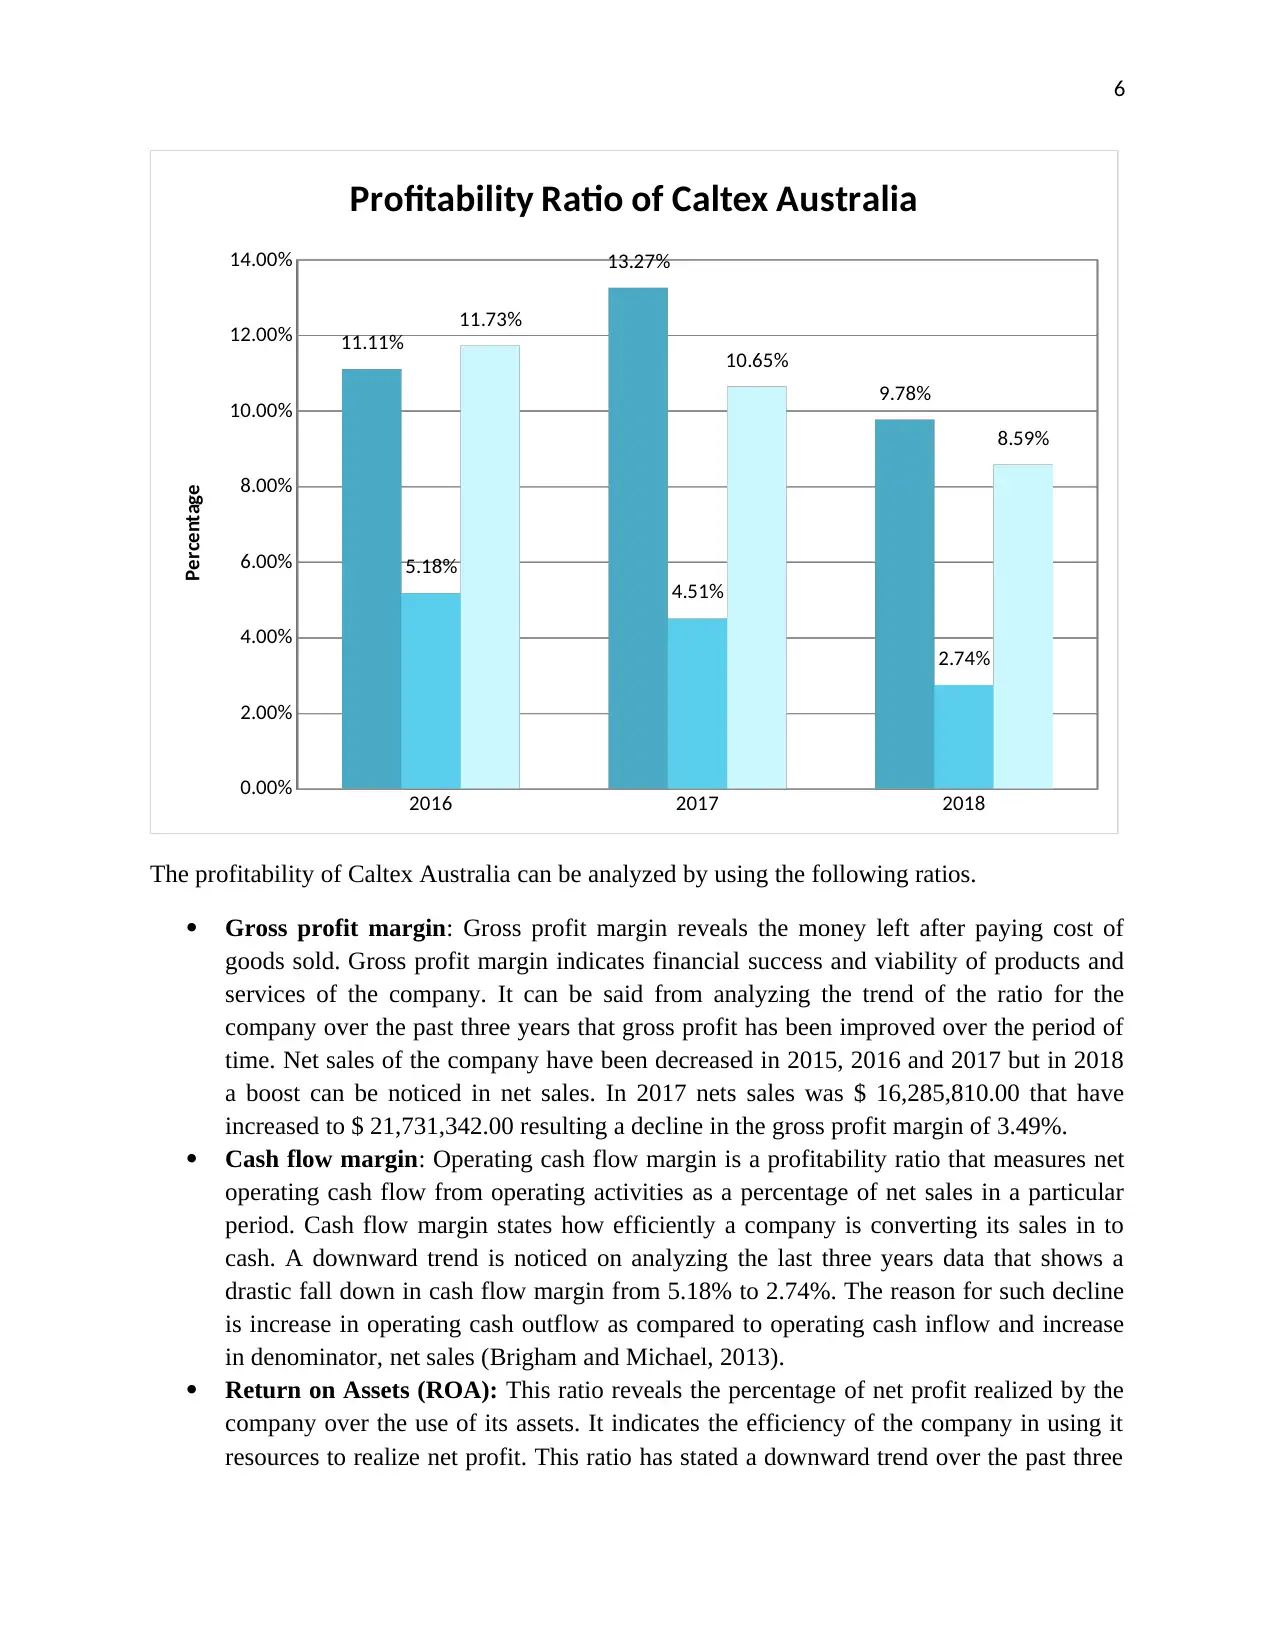
Profitability Ratio of Caltex Australia
Percentage
The profitability of Caltex Australia can be analyzed by using the following ratios.
Gross profit margin: Gross profit margin reveals the money left after paying cost of
goods sold. Gross profit margin indicates financial success and viability of products and
services of the company. It can be said from analyzing the trend of the ratio for the
company over the past three years that gross profit has been improved over the period of
time. Net sales of the company have been decreased in 2015, 2016 and 2017 but in 2018
a boost can be noticed in net sales. In 2017 nets sales was $ 16,285,810.00 that have
increased to $ 21,731,342.00 resulting a decline in the gross profit margin of 3.49%.
Cash flow margin: Operating cash flow margin is a profitability ratio that measures net
operating cash flow from operating activities as a percentage of net sales in a particular
period. Cash flow margin states how efficiently a company is converting its sales in to
cash. A downward trend is noticed on analyzing the last three years data that shows a
drastic fall down in cash flow margin from 5.18% to 2.74%. The reason for such decline
is increase in operating cash outflow as compared to operating cash inflow and increase
in denominator, net sales (Brigham and Michael, 2013).
Return on Assets (ROA): This ratio reveals the percentage of net profit realized by the
company over the use of its assets. It indicates the efficiency of the company in using it
resources to realize net profit. This ratio has stated a downward trend over the past three
2016 2017 2018
0.00%
2.00%
4.00%
6.00%
8.00%
10.00%
12.00%
14.00%
11.11%
13.27%
9.78%
5.18%
4.51%
2.74%
11.73%
10.65%
8.59%
Profitability Ratio of Caltex Australia
Percentage
The profitability of Caltex Australia can be analyzed by using the following ratios.
Gross profit margin: Gross profit margin reveals the money left after paying cost of
goods sold. Gross profit margin indicates financial success and viability of products and
services of the company. It can be said from analyzing the trend of the ratio for the
company over the past three years that gross profit has been improved over the period of
time. Net sales of the company have been decreased in 2015, 2016 and 2017 but in 2018
a boost can be noticed in net sales. In 2017 nets sales was $ 16,285,810.00 that have
increased to $ 21,731,342.00 resulting a decline in the gross profit margin of 3.49%.
Cash flow margin: Operating cash flow margin is a profitability ratio that measures net
operating cash flow from operating activities as a percentage of net sales in a particular
period. Cash flow margin states how efficiently a company is converting its sales in to
cash. A downward trend is noticed on analyzing the last three years data that shows a
drastic fall down in cash flow margin from 5.18% to 2.74%. The reason for such decline
is increase in operating cash outflow as compared to operating cash inflow and increase
in denominator, net sales (Brigham and Michael, 2013).
Return on Assets (ROA): This ratio reveals the percentage of net profit realized by the
company over the use of its assets. It indicates the efficiency of the company in using it
resources to realize net profit. This ratio has stated a downward trend over the past three
⊘ This is a preview!⊘
Do you want full access?
Subscribe today to unlock all pages.
Trusted by 1+ million students worldwide
7
years. Return on assets has been declined from 11.73% to 8.59% that shows company has
not been able to use it resources properly. The reason for the same is decreasing profit
and an increase in net sales in the year 2018 (Damodaran, 2011).
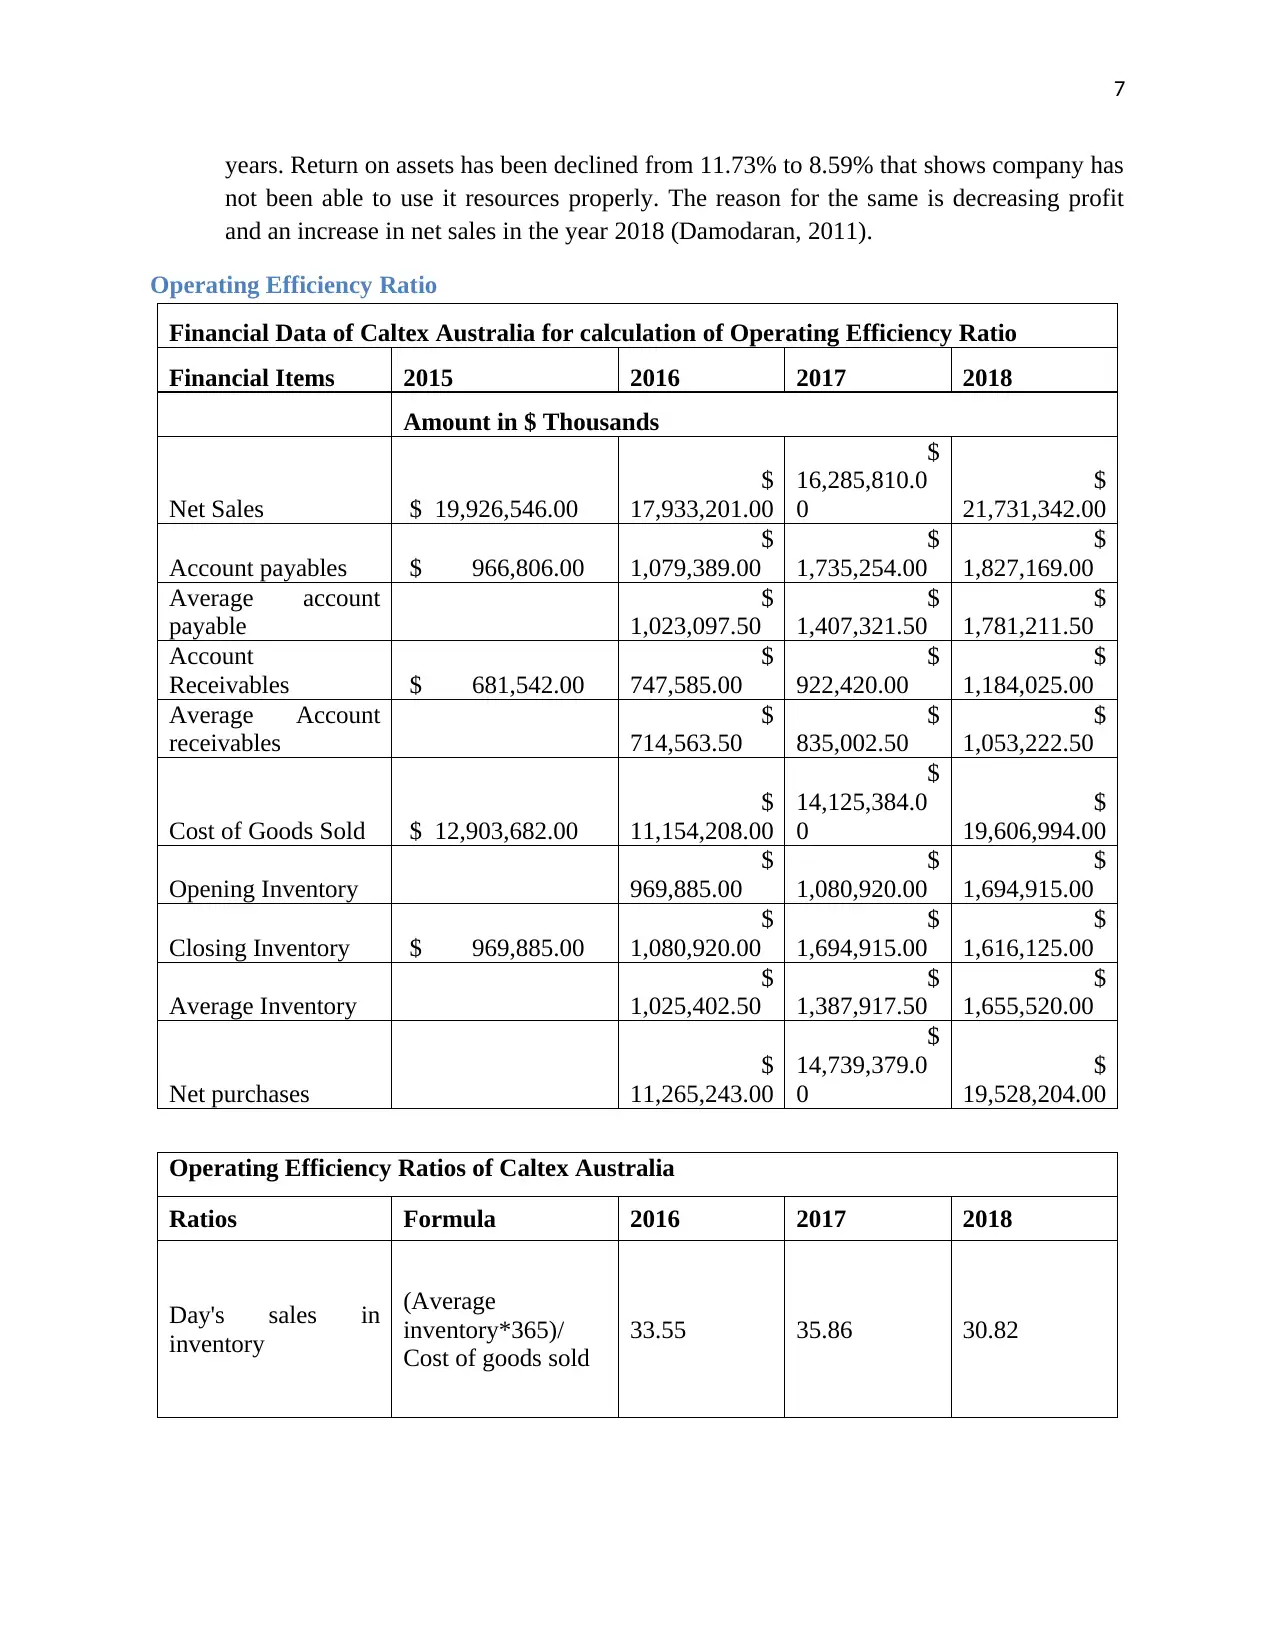
Operating Efficiency Ratio
Financial Data of Caltex Australia for calculation of Operating Efficiency Ratio
Financial Items 2015 2016 2017 2018
Amount in $ Thousands
Net Sales $ 19,926,546.00
$
17,933,201.00
$
16,285,810.0
0
$
21,731,342.00
Account payables $ 966,806.00
$
1,079,389.00
$
1,735,254.00
$
1,827,169.00
Average account
payable
$
1,023,097.50
$
1,407,321.50
$
1,781,211.50
Account
Receivables $ 681,542.00
$
747,585.00
$
922,420.00
$
1,184,025.00
Average Account
receivables
$
714,563.50
$
835,002.50
$
1,053,222.50
Cost of Goods Sold $ 12,903,682.00
$
11,154,208.00
$
14,125,384.0
0
$
19,606,994.00
Opening Inventory
$
969,885.00
$
1,080,920.00
$
1,694,915.00
Closing Inventory $ 969,885.00
$
1,080,920.00
$
1,694,915.00
$
1,616,125.00
Average Inventory
$
1,025,402.50
$
1,387,917.50
$
1,655,520.00
Net purchases
$
11,265,243.00
$
14,739,379.0
0
$
19,528,204.00
Operating Efficiency Ratios of Caltex Australia
Ratios Formula 2016 2017 2018
Day's sales in
inventory
(Average
inventory*365)/
Cost of goods sold
33.55 35.86 30.82
years. Return on assets has been declined from 11.73% to 8.59% that shows company has
not been able to use it resources properly. The reason for the same is decreasing profit
and an increase in net sales in the year 2018 (Damodaran, 2011).
Operating Efficiency Ratio
Financial Data of Caltex Australia for calculation of Operating Efficiency Ratio
Financial Items 2015 2016 2017 2018
Amount in $ Thousands
Net Sales $ 19,926,546.00
$
17,933,201.00
$
16,285,810.0
0
$
21,731,342.00
Account payables $ 966,806.00
$
1,079,389.00
$
1,735,254.00
$
1,827,169.00
Average account
payable
$
1,023,097.50
$
1,407,321.50
$
1,781,211.50
Account
Receivables $ 681,542.00
$
747,585.00
$
922,420.00
$
1,184,025.00
Average Account
receivables
$
714,563.50
$
835,002.50
$
1,053,222.50
Cost of Goods Sold $ 12,903,682.00
$
11,154,208.00
$
14,125,384.0
0
$
19,606,994.00
Opening Inventory
$
969,885.00
$
1,080,920.00
$
1,694,915.00
Closing Inventory $ 969,885.00
$
1,080,920.00
$
1,694,915.00
$
1,616,125.00
Average Inventory
$
1,025,402.50
$
1,387,917.50
$
1,655,520.00
Net purchases
$
11,265,243.00
$
14,739,379.0
0
$
19,528,204.00
Operating Efficiency Ratios of Caltex Australia
Ratios Formula 2016 2017 2018
Day's sales in
inventory
(Average
inventory*365)/
Cost of goods sold
33.55 35.86 30.82
Paraphrase This Document
Need a fresh take? Get an instant paraphrase of this document with our AI Paraphraser
8
Account payable
turnover ratio in
days
(Average account
payables*365)/Net
purchases
33.15 34.85 33.29
Account receivable
turnover ratio in
days
(Average account
receivable*365)/Net
Sales
14.54 18.71 17.69
(Caltex Australia, 2018, 2017 and 2016)
2016 2017 2018
0.00
5.00
10.00
15.00
20.00
25.00
30.00
35.00
40.00
33.55
35.86
30.82
33.15 34.85 33.29
14.54
18.71 17.69
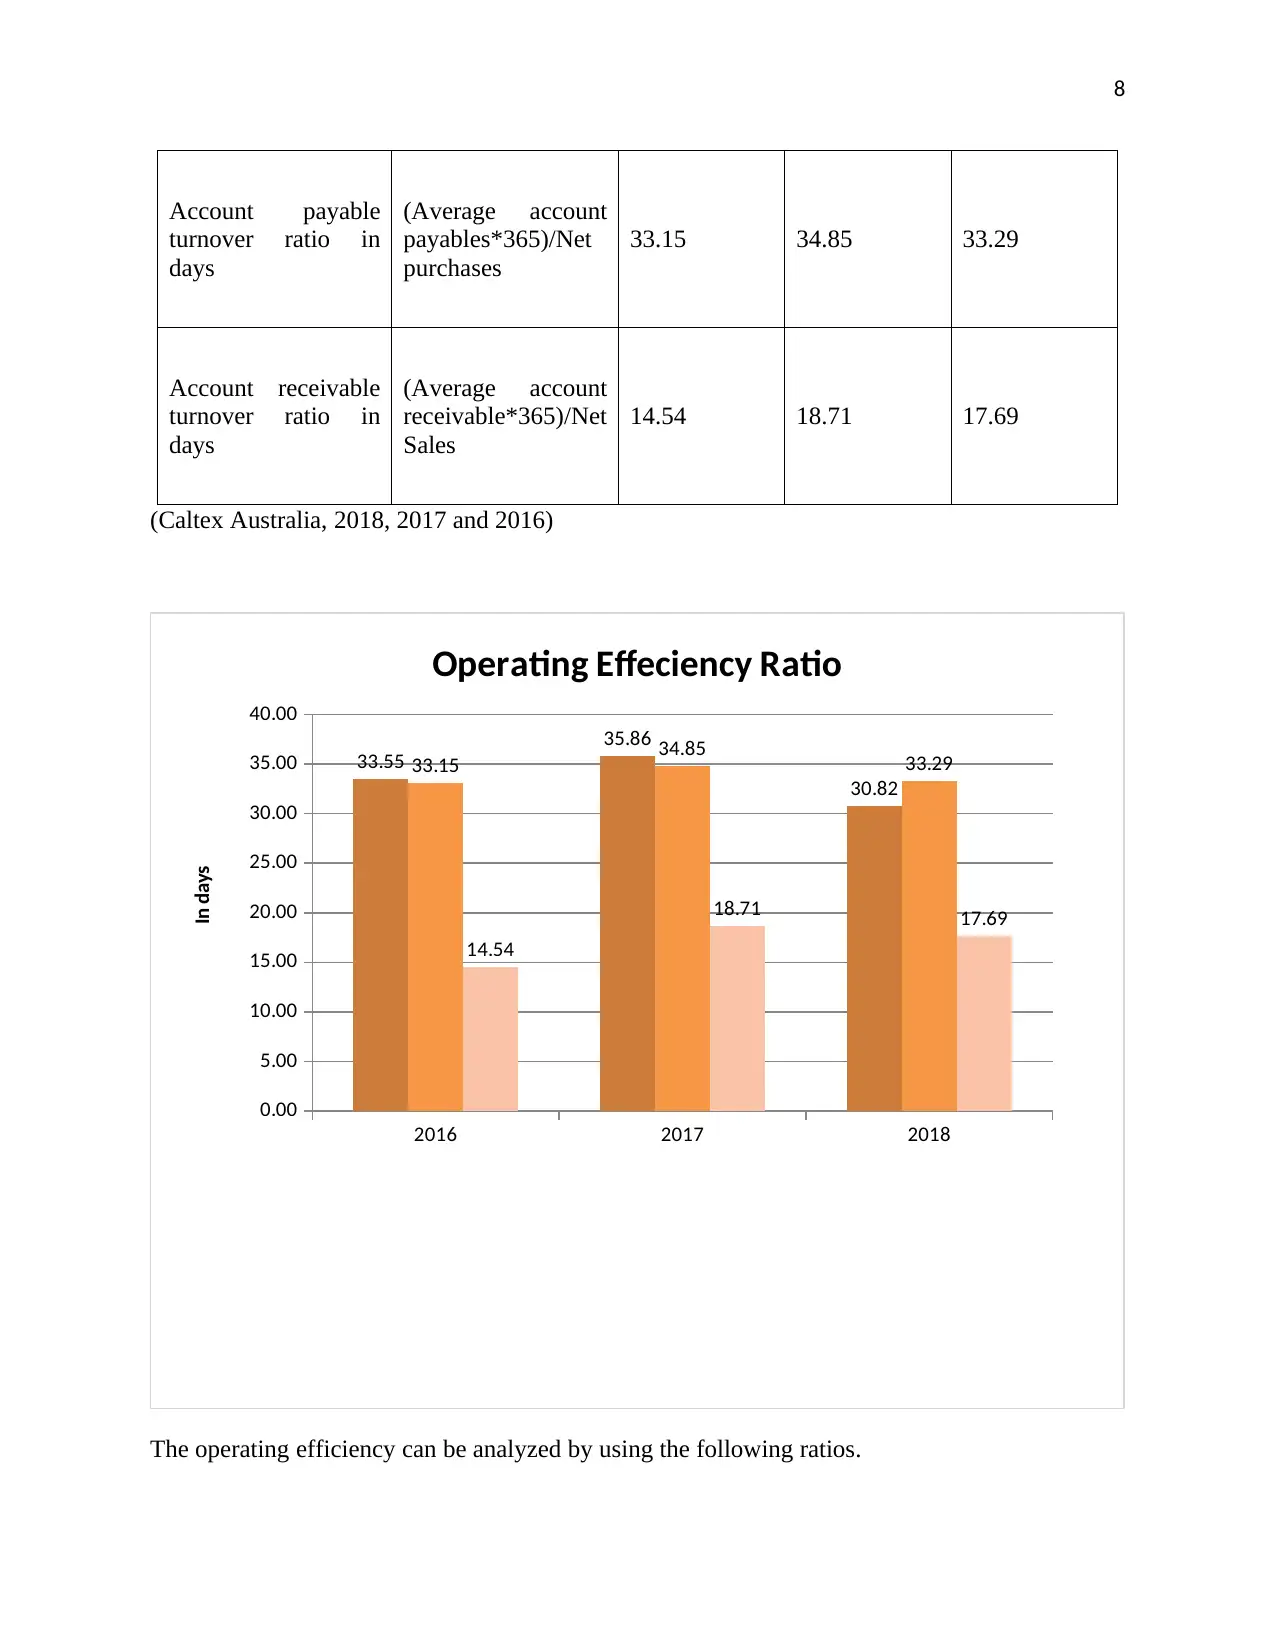
Operating Effeciency Ratio
In days
The operating efficiency can be analyzed by using the following ratios.
Account payable
turnover ratio in
days
(Average account
payables*365)/Net
purchases
33.15 34.85 33.29
Account receivable
turnover ratio in
days
(Average account
receivable*365)/Net
Sales
14.54 18.71 17.69
(Caltex Australia, 2018, 2017 and 2016)
2016 2017 2018
0.00
5.00
10.00
15.00
20.00
25.00
30.00
35.00
40.00
33.55
35.86
30.82
33.15 34.85 33.29
14.54
18.71 17.69
Operating Effeciency Ratio
In days
The operating efficiency can be analyzed by using the following ratios.
9
Day’s sales in inventory: This financial ratio depicts the average number of days a
company took to sell its inventory in an accounting year. The less the number of days,
better the ratio is. It shows company is efficiently selling its inventory. The past three
years data of Caltex Australia shows that company has worked upon its efficiency and
made it. Caltex has successfully decreased the number of days to convert its inventory
into sales. In 2016 the ratio was 33.55 days that has decreased to 30.82 days despite
increase in average inventory and net sales.
Account payable turnover ratio in days: This ratio states company’s efficiency in
paying off its creditors for outstanding invoices measured in number of days. Account
payable turnover ratio of Caltex Australia stated a stable trend over the past three years.
Company has taken approx. 33 days to pay off its payables. Company has taken 34.85
days in 2017 to pay off its creditors but in 2018 it covered it up (Davies and Crawford,
2011).
Account receivables turnover ratio in days: This ratio states the number of days a
company took to collect its debtors in an accounting year. The shorter the number of
days, better the ratio is. In the past three years Caltex Australia has not efficiently
collecting its debtors. Caltex Australia has taken 14.54 days in 2016 to collect its debtors
and in 2018 it took 17.69 days to collect the debtors. This is not a good sign for the
company as it is not able to liquidate its credit sales in cash easily (Krantz, 2016).
Section 2.3: Use of marketable securities for cash management
Marketable securities refer to the securities or investments that have been made by the
company to have enough cash and cash equivalents within the year. These investments are used
with the purpose to receive the company within one year. Marketable securities are being listed
under heading the current assets section of the balance sheet and it is valued at current fair value.
On looking at the balance sheet and notes to accounts of Caltex Australia, it has been
found that company has used only cash and cash equivalents and accounts receivables as
marketable securities to have enough cash resources to pay the current liabilities (Caltex
Australia. 2018).
⊘ This is a preview!⊘
Do you want full access?
Subscribe today to unlock all pages.
Trusted by 1+ million students worldwide

10
Section 2.4: Sensitivity Analysis through using the given data
Life of project consider by the company 4 Years
Cost of Equipment 2,000,000.00$
Reisdual Value 200,000.00$
Depreciation Method Straight Line
Life of Equipment 4 years
Depreciation of Equipment per year 450,000.00$
Working Capital 600,000.00$
Recovery of working capital 600,000.00$
Selling Units per year 300000 per year
Selling Price 20.00$
Variable Cost 12.00$
Fixed Cost 300,000.00$
Discount Rate 10%
Tax Rate 30%
Information given in the question
Paraphrase This Document
Need a fresh take? Get an instant paraphrase of this document with our AI Paraphraser
11
0 1 2 3 4
Cash Inflows
Units sold 300000 300000 300000 300000
Selling price 20.00$ 20.00$ 20.00$ 20.00$
Net Cash Inflows 6,000,000.00$ 6,000,000.00$ 6,000,000.00$ 6,000,000.00$
Cash Outflows
Variable Cost 3,600,000.00$ 3,600,000.00$ 3,600,000.00$ 3,600,000.00$
Fixed Cost 300,000.00$ 300,000.00$ 300,000.00$ 300,000.00$
Depreciation 450,000.00$ 450,000.00$ 450,000.00$ 450,000.00$
Total Cash outflows 4,350,000.00$ 4,350,000.00$ 4,350,000.00$ 4,350,000.00$
Cash flows before tax 1,650,000.00$ 1,650,000.00$ 1,650,000.00$ 1,650,000.00$
Less: Tax @ 30% 495,000.00$ 495,000.00$ 495,000.00$ 495,000.00$
Cash Flows after tax 1,155,000.00$ 1,155,000.00$ 1,155,000.00$ 1,155,000.00$
Add: Depreciation 450,000.00$ 450,000.00$ 450,000.00$ 450,000.00$
Cash Flows before
depreciation after tax 1,605,000.00$ 1,605,000.00$ 1,605,000.00$ 1,605,000.00$
Initial Equiment Cost (2,000,000.00)$
Salvage Value 200,000.00$
Working Capital
Initial Requirement (600,000.00)$
Recovery 600,000.00$
Net Cash Flows (2,600,000.00)$ 1,605,000.00$ 1,605,000.00$ 1,605,000.00$ 2,405,000.00$
PVF @ 10% 1.000 0.909 0.826 0.751 0.683
(2,600,000.00)$ 1,459,090.91$ 1,326,446.28$ 1,205,860.26$ 1,642,647.36$
Net Present Value 3,034,044.81$
Cash Flows during the life of the project in normal Case
Years
Particulars
(Reilly and Brown, 2011)
12
0 1 2 3 4
Cash Inflows
Selling Units 270000 270000 270000 270000
Selling price 20.00$ 20.00$ 20.00$ 20.00$
Net Cash Inflows 5,400,000.00$ 5,400,000.00$ 5,400,000.00$ 5,400,000.00$
Cash Outflows
Variable Cost 3,240,000.00$ 3,240,000.00$ 3,240,000.00$ 3,240,000.00$
Fixed Cost 300,000.00$ 300,000.00$ 300,000.00$ 300,000.00$
Depreciation 450,000.00$ 450,000.00$ 450,000.00$ 450,000.00$
Total Cash outflows 3,990,000.00$ 3,990,000.00$ 3,990,000.00$ 3,990,000.00$
Cash flows before tax 1,410,000.00$ 1,410,000.00$ 1,410,000.00$ 1,410,000.00$
Less: Tax @ 30% 423,000.00$ 423,000.00$ 423,000.00$ 423,000.00$
Cash Flows after tax 987,000.00$ 987,000.00$ 987,000.00$ 987,000.00$
Add: Depreciation 450,000.00$ 450,000.00$ 450,000.00$ 450,000.00$
Cash Flows before
depreciation after 1,437,000.00$ 1,437,000.00$ 1,437,000.00$ 1,437,000.00$
Initial Equiment Cost (2,000,000.00)$
Salvage Value 200,000.00$
Working Capital
Initial Requirement (600,000.00)$
Recovery 600,000.00$
Net Cash Flows (2,600,000.00)$ 1,437,000.00$ 1,437,000.00$ 1,437,000.00$ 2,237,000.00$
PVF @ 10% 1.000 0.909 0.826 0.751 0.683
(2,600,000.00)$ 1,306,363.64$ 1,187,603.31$ 1,079,639.37$ 1,527,901.10$
Net Present Value 2,501,507.41$
Particulars Years
Statement of Cash flows when Unit sales decrease by 10%
(Schlichting, 2013)
⊘ This is a preview!⊘
Do you want full access?
Subscribe today to unlock all pages.
Trusted by 1+ million students worldwide
1 out of 22
Related Documents


Your All-in-One AI-Powered Toolkit for Academic Success.
+13062052269
info@desklib.com
Available 24*7 on WhatsApp / Email
![[object Object]](/_next/static/media/star-bottom.7253800d.svg)
Unlock your academic potential
Copyright © 2020–2026 A2Z Services. All Rights Reserved. Developed and managed by ZUCOL.