Financial Management Report: Capita PLC vs. Serco Group PLC Analysis
VerifiedAdded on 2021/01/02
|17
|5631
|176
Report
AI Summary
This report provides a comprehensive financial analysis of Capita PLC and Serco Group PLC, two companies bidding for a contract with the NHS. The analysis, spanning from 2015 to 2017, utilizes financial ratios such as current ratio, quick ratio, gross margin ratio, return on capital employed, working capital ratio, debt-to-equity ratio, and equity ratio to assess the liquidity, profitability, and solvency of each company. The report interprets these ratios to determine the financial health and suitability of each company for the contract. The report also includes a case study of the Carillion London-Corby rail electrification contract and discusses financial risk factors, funding sources, and ethical considerations in procurement and supply business operations. The analysis aims to provide insights into financial management practices and inform decision-making regarding contract awarding.
Financial Management for
Purchasers
Purchasers
Paraphrase This Document
Need a fresh take? Get an instant paraphrase of this document with our AI Paraphraser
TABLE OF CONTENTS
INTRODUCTION...........................................................................................................................1
MAIN BODY...................................................................................................................................1
TASK A......................................................................................................................................1
TASK B.......................................................................................................................................8
CONCLUSION..............................................................................................................................13
REFERENCES..............................................................................................................................14
INTRODUCTION
Financial Management is a term which basically deals with the management of available
financial resources of the company in an effective and efficient manner. It is the process which
involves planning, organizing, controlling and monitoring of financial as well as business
resources with objective of achieving the set defined organizational goals and objectives. Timely
and accurate availability of statistical and financial information helps the management of
company in making important investment decision in a cost effective manner. The present report
is based on financial analysis of two companies named Capita PLC and Serco Group PLC, which
are bidding for a contract with NHS. With the help of financial ratios such as profitability,
working capital etc. The financial analysis is done so as to ascertain the best suitable and liquid
company to enter into contract with. With financial analysis, solvency, liquidity as well as
creditability will be determined. Also, the report will shed light on case study of Carillion
London-Corby rail electrification contract. At last factors related to the financial risk, funding
sources and ethical code of conduct in relation to procurement and supply business operations
will be discussed.
MAIN BODY
TASK A
On the basis of cited case scenario, NHS is required financial details of two companies
named Capita PLC and Serco Group PLC, which are bidding for undertaking contract. For
determining the financial background of both the companies, financial analysis has been
performed from the year 2015 to 2017. On the basis of financial ratios calculations such as
current, debt ratio etc. the liquidity, profitability and solvency position of Capita PLC and Serco
Group PLC can be ascertain.
Financial Analysis of Capita PLC -
Capita PLC is one of the International business process outsourcing and professional
service rendering company with headquarter in London. It is also engaged in the business related
to property and infrastructure consultancy division. The financial analysis of Capita PLC is done
by considering the income statement, balance sheet, and cash flow statement of the relevant
accounting period. Here, company's financial analysis is done by using following financial
ratios:
1
⊘ This is a preview!⊘
Do you want full access?
Subscribe today to unlock all pages.
Trusted by 1+ million students worldwide
Capita PLC
Particulars 2015 (in £m) 2016 (in £m) 2017 (in £m)
Liquidity Ratio 1. Current Ratio
Current Assets 1836 2207.2 1817.7
Current Liabilities 2141.2 3413.3 2830.8
Current Ratio = Current Assets/
Current Liabilities 0.857 0.647 0.642
2. Quick Ratio
Quick Asset 1836 2207.2 1817.7
Current Liabilities 2141.2 3413.3 2830.8
Quick Ratio = Current Assets/
Current Liabilities 0.857 0.647 0.642
Profitability Ratio 1. Gross Margin Ratio
Gross Margin 1345.4 901.1 1052.6
Net Sales 4836.9 4368.6 4234.6
Gross Margin Ratio = Gross
Margin/ Net Sales 27.82% 20.63% 24.86%
2. Return on Capital
Employed
Net Operating Profit/ Loss 206.6 -16.1 -420.1
Employed Capital 3202.3 2792.2 1590.4
Return on Capital Employed =
Net Operating Profit/Employed
Capital
6.45% -0.58% -26.41%
2
Paraphrase This Document
Need a fresh take? Get an instant paraphrase of this document with our AI Paraphraser
Working capital
Ratio 1. Working capital Ratio
Current Assets 1836 2207.2 1817.7
Current Liabilities 2141.2 3413.3 2830.8
Working capital Ratio =
Current Assets/Current
Liabilities
0.857 0.647 0.642
2. Inventory Turnover Ratio
Net Sales 4836.9 4368.6 4234.6
Average Inventory at Cost 0 0 0
Inventory Turnover Ratio =
Net Sales/Average Inventory at
Cost
0 0 0
Long term solvency
ratio 1.Debt to equity Ratio
Total Liabilities 4590.2 6758.4 5351
Total Equity 679.3 -621.3 -999
Debt equity Ratio = Total
Liabilities /Total Equity 6.76 -10.88 -5.36
2. Equity Ratio
Total Equity 679.3 -621.3 -999
Total Assets 5343.5 6205.5 4421.2
Equity Ratio = Total
Equity/Total Assets 12.71% -10.01% -22.60%
(Source: Capita PLC Annual Report and Accounts, 2015)
Interpretation:
3
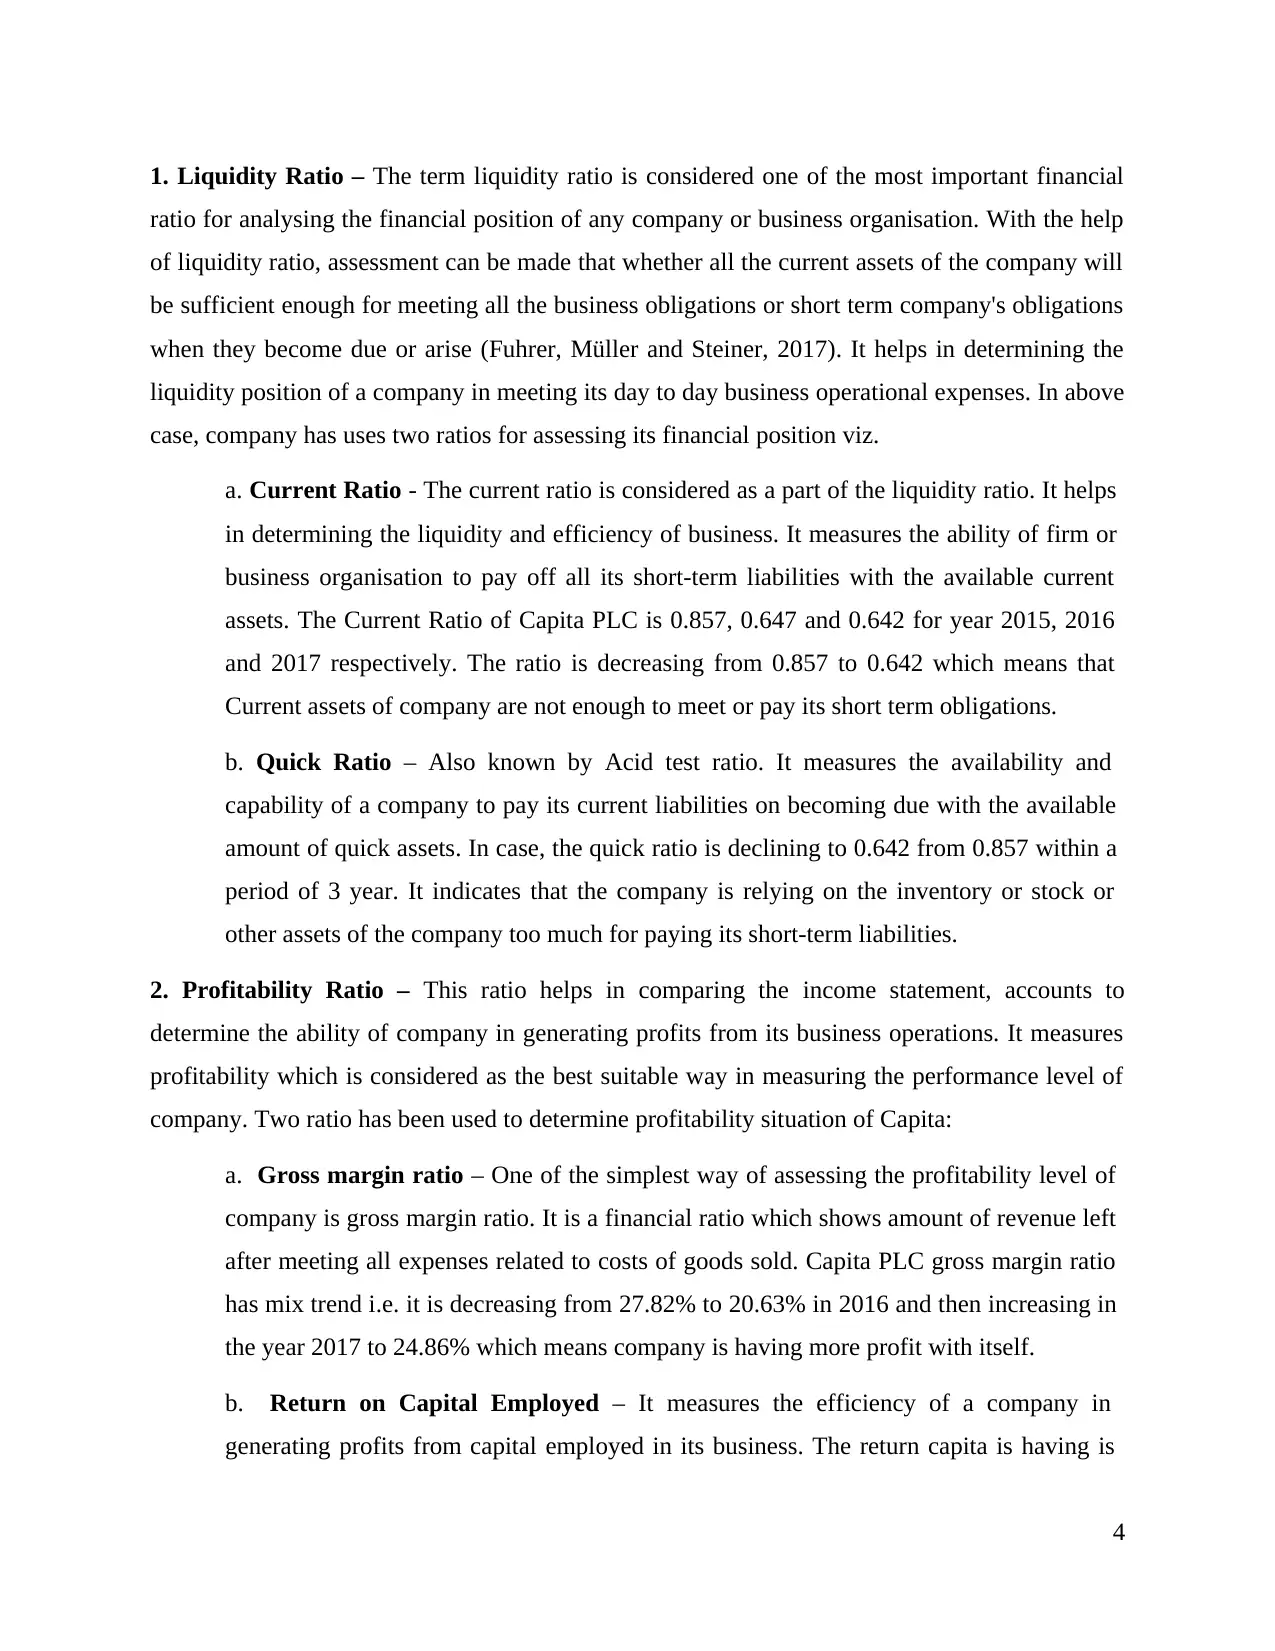
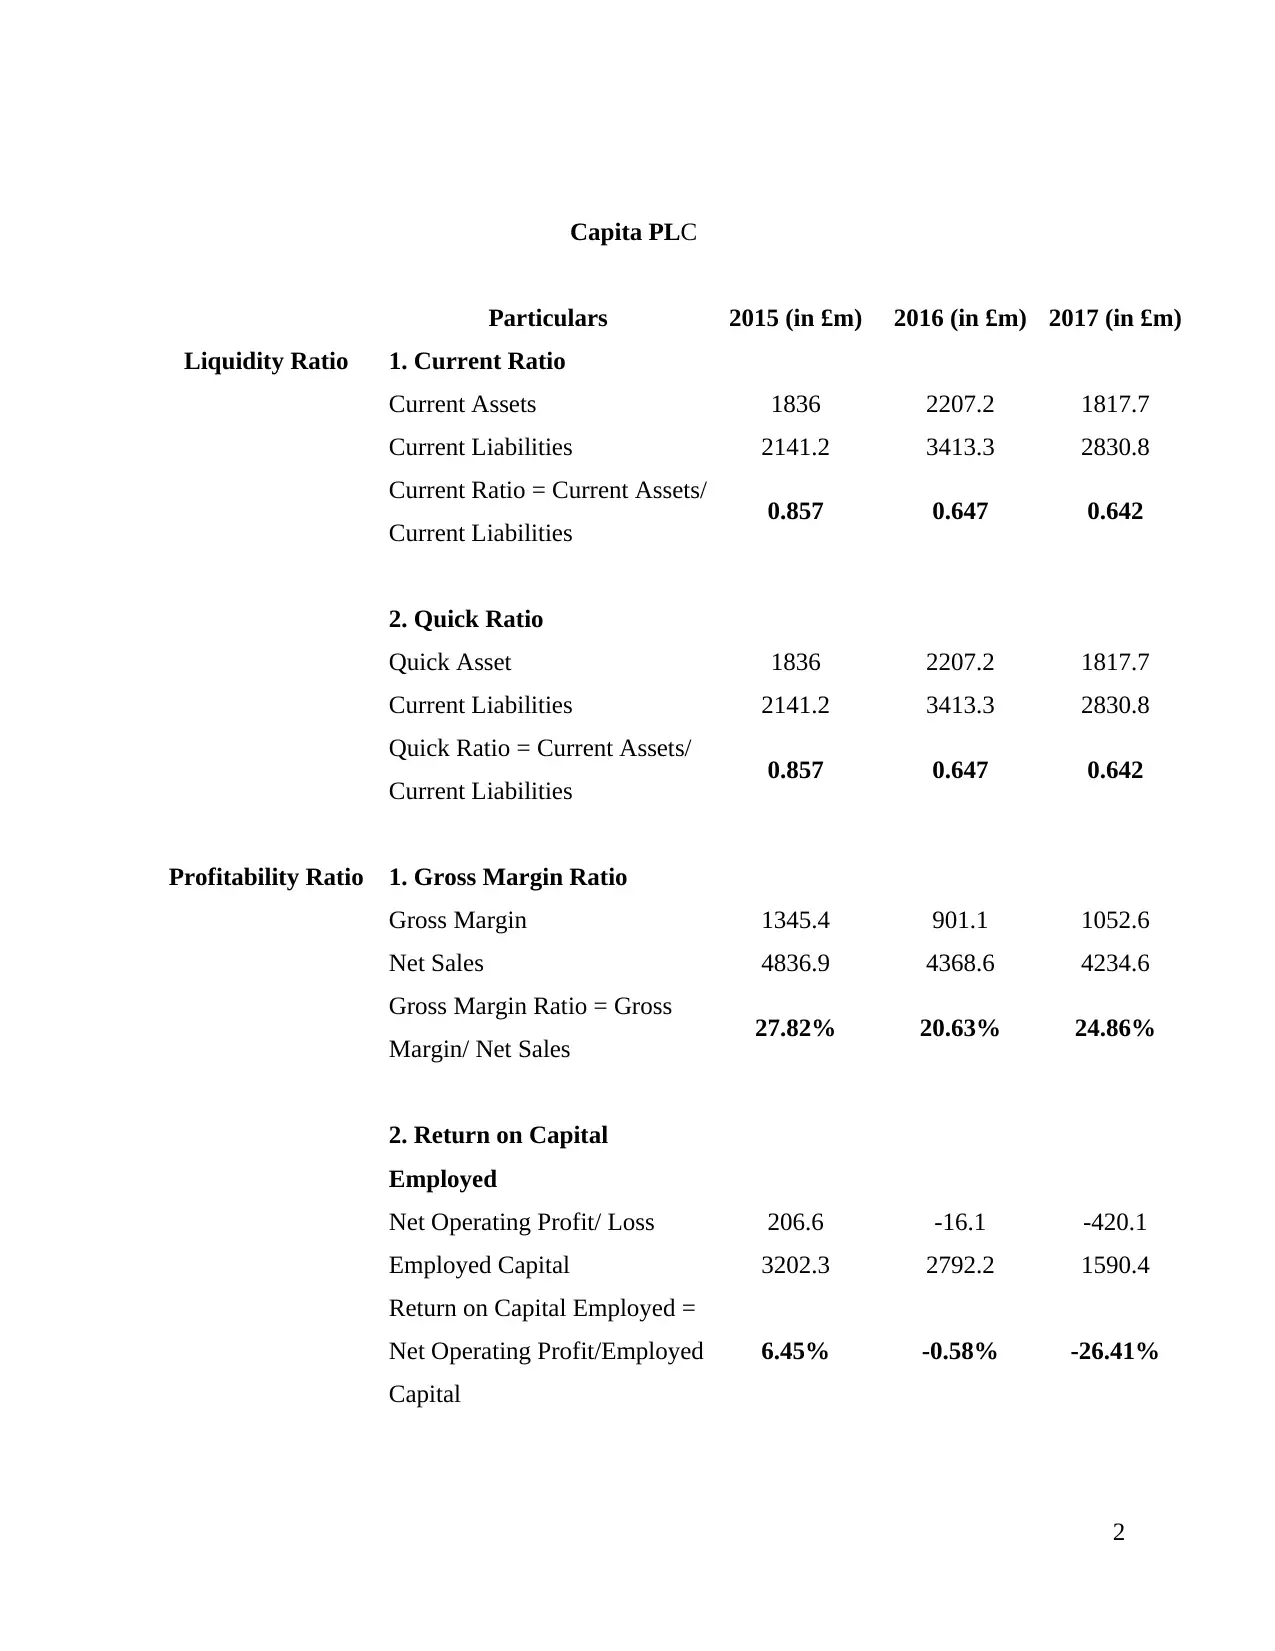
1. Liquidity Ratio – The term liquidity ratio is considered one of the most important financial
ratio for analysing the financial position of any company or business organisation. With the help
of liquidity ratio, assessment can be made that whether all the current assets of the company will
be sufficient enough for meeting all the business obligations or short term company's obligations
when they become due or arise (Fuhrer, Müller and Steiner, 2017). It helps in determining the
liquidity position of a company in meeting its day to day business operational expenses. In above
case, company has uses two ratios for assessing its financial position viz.
a. Current Ratio - The current ratio is considered as a part of the liquidity ratio. It helps
in determining the liquidity and efficiency of business. It measures the ability of firm or
business organisation to pay off all its short-term liabilities with the available current
assets. The Current Ratio of Capita PLC is 0.857, 0.647 and 0.642 for year 2015, 2016
and 2017 respectively. The ratio is decreasing from 0.857 to 0.642 which means that
Current assets of company are not enough to meet or pay its short term obligations.
b. Quick Ratio – Also known by Acid test ratio. It measures the availability and
capability of a company to pay its current liabilities on becoming due with the available
amount of quick assets. In case, the quick ratio is declining to 0.642 from 0.857 within a
period of 3 year. It indicates that the company is relying on the inventory or stock or
other assets of the company too much for paying its short-term liabilities.
2. Profitability Ratio – This ratio helps in comparing the income statement, accounts to
determine the ability of company in generating profits from its business operations. It measures
profitability which is considered as the best suitable way in measuring the performance level of
company. Two ratio has been used to determine profitability situation of Capita:
a. Gross margin ratio – One of the simplest way of assessing the profitability level of
company is gross margin ratio. It is a financial ratio which shows amount of revenue left
after meeting all expenses related to costs of goods sold. Capita PLC gross margin ratio
has mix trend i.e. it is decreasing from 27.82% to 20.63% in 2016 and then increasing in
the year 2017 to 24.86% which means company is having more profit with itself.
b. Return on Capital Employed – It measures the efficiency of a company in
generating profits from capital employed in its business. The return capita is having is
4
⊘ This is a preview!⊘
Do you want full access?
Subscribe today to unlock all pages.
Trusted by 1+ million students worldwide
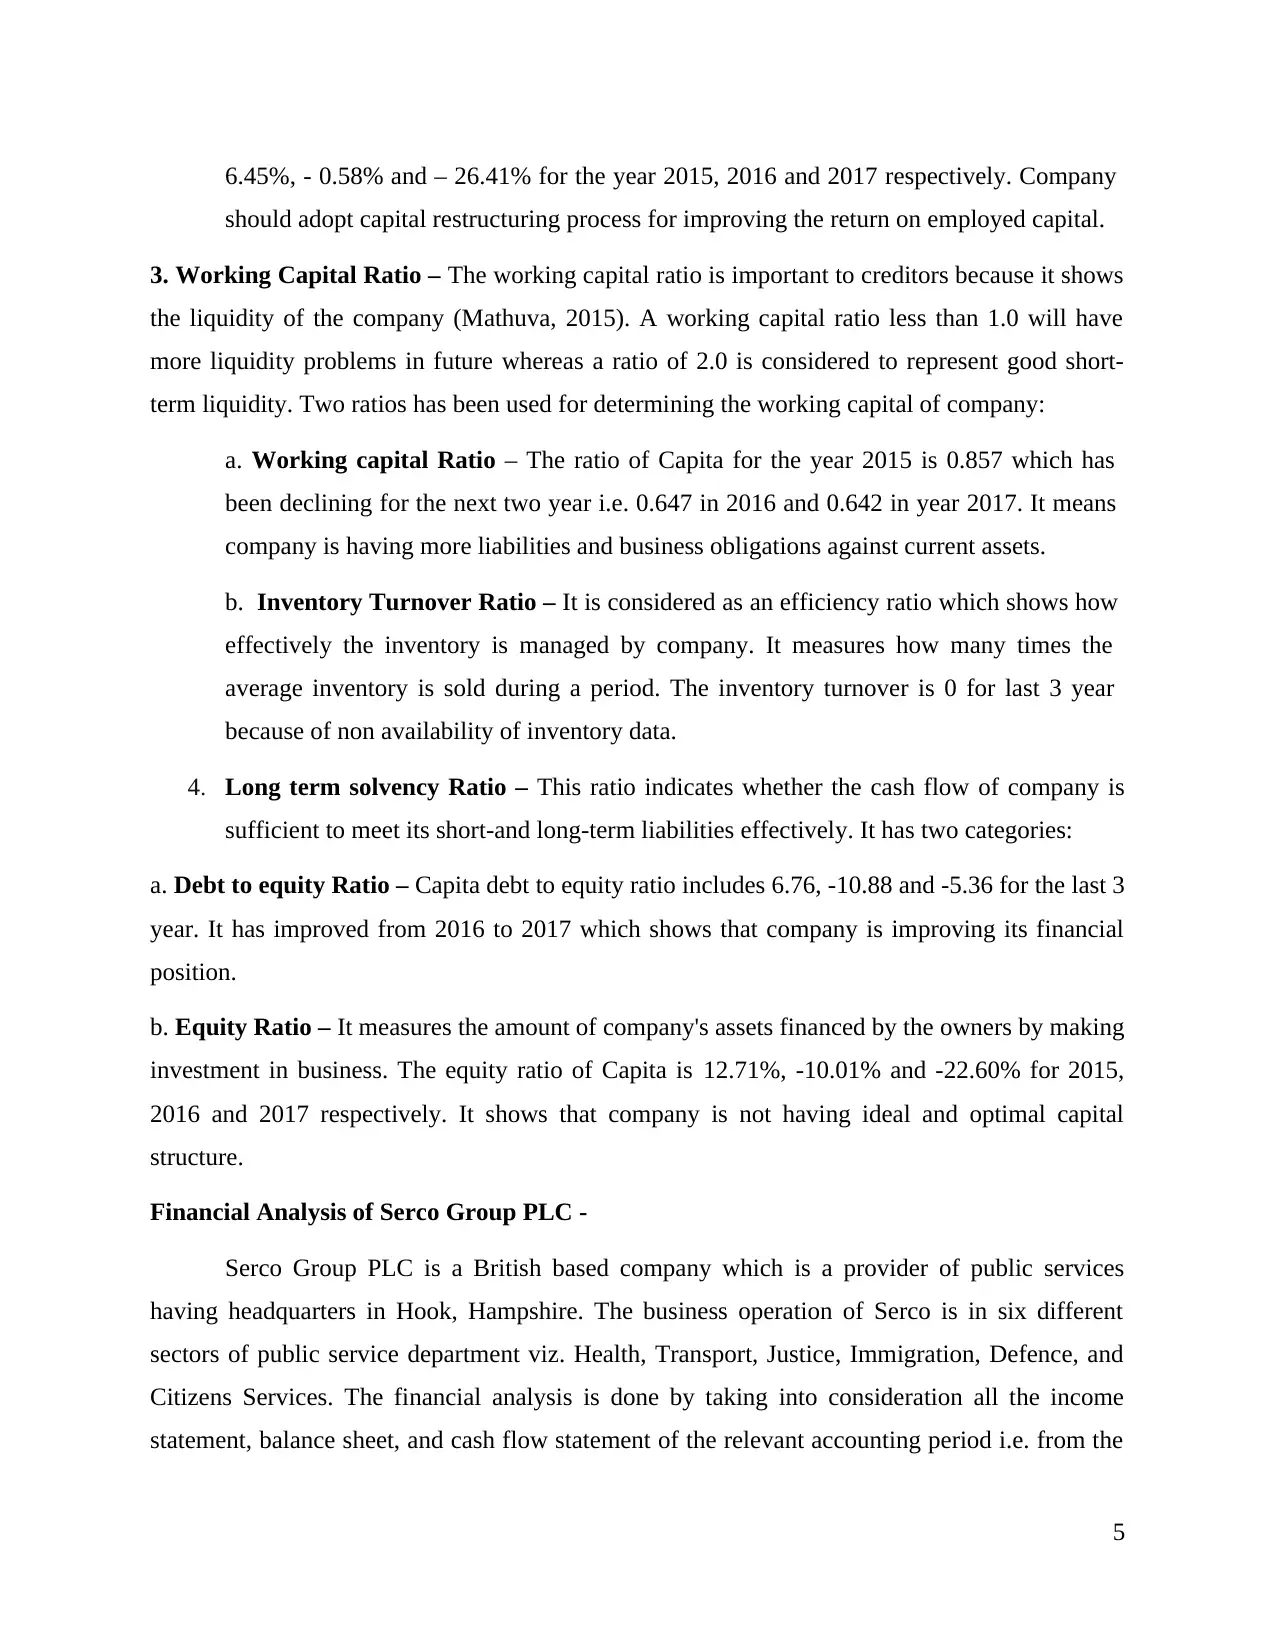
6.45%, - 0.58% and – 26.41% for the year 2015, 2016 and 2017 respectively. Company
should adopt capital restructuring process for improving the return on employed capital.
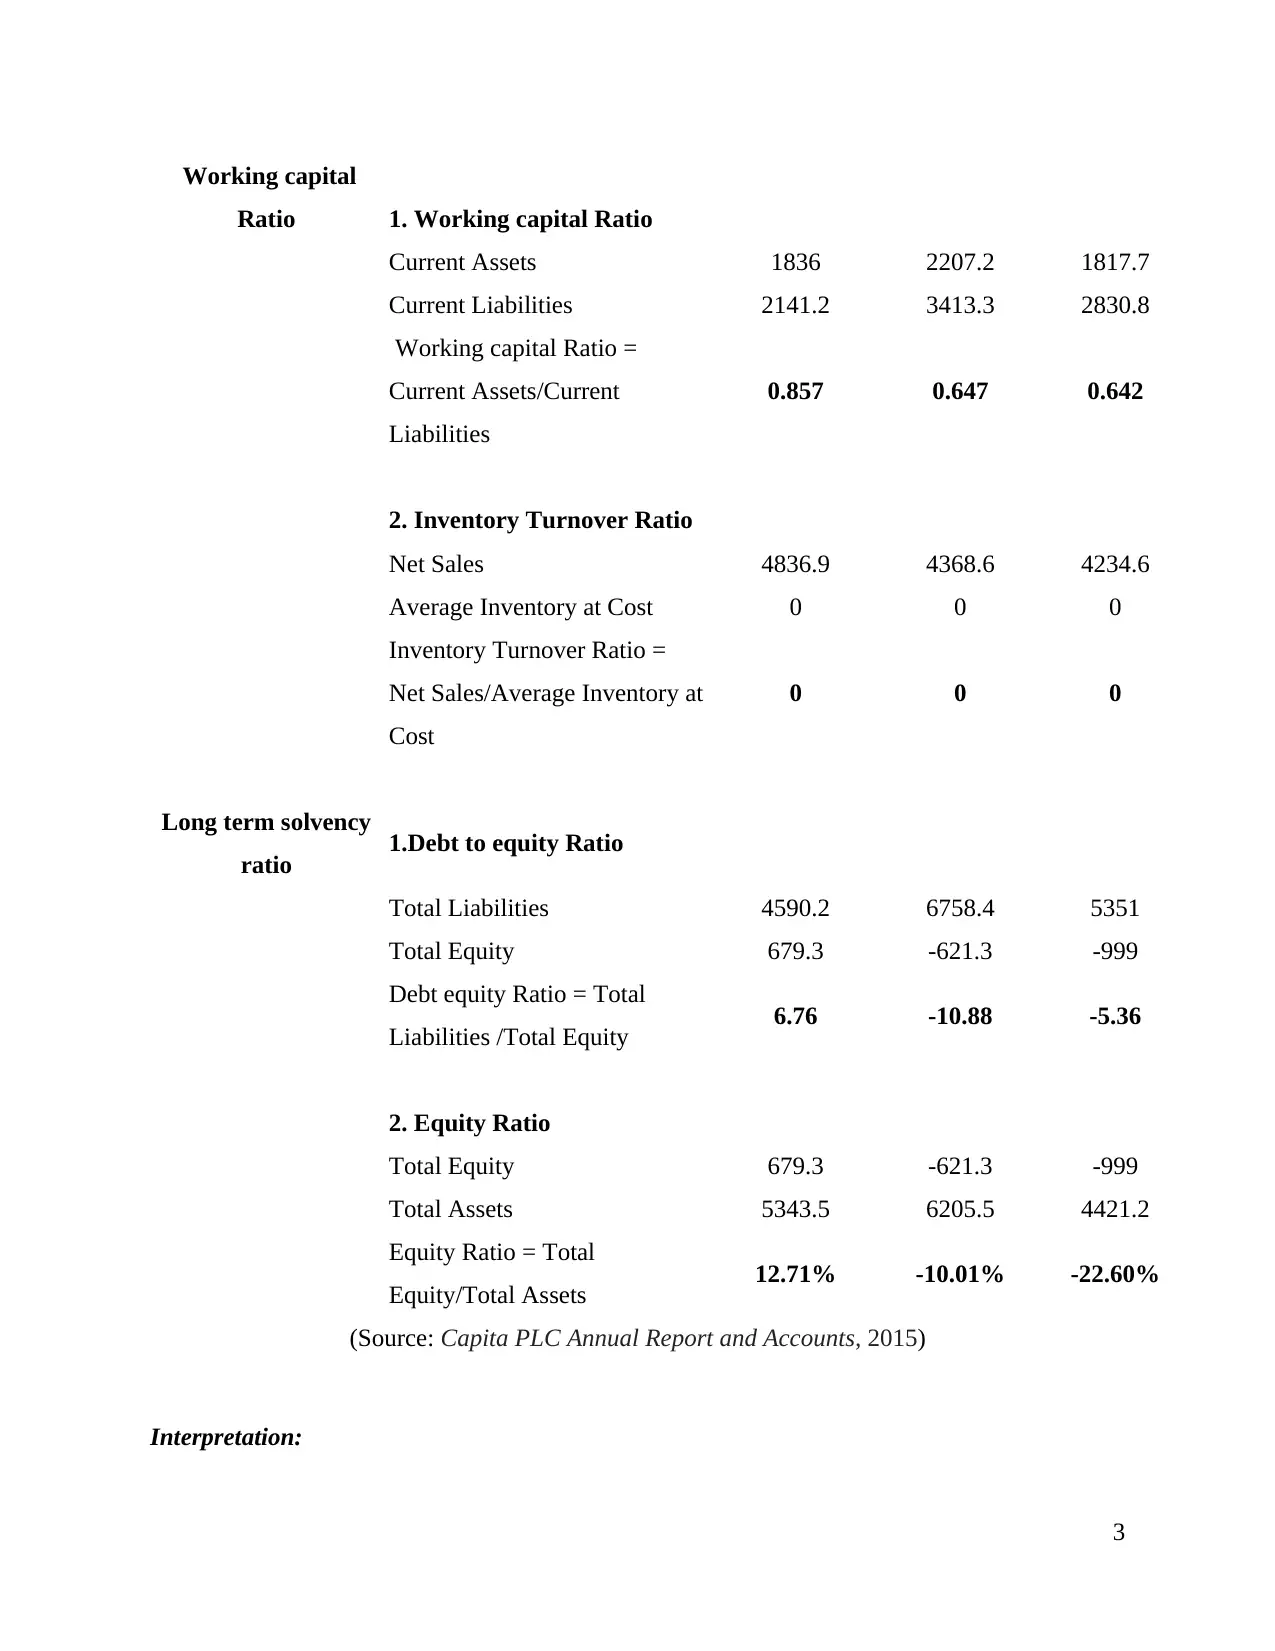
3. Working Capital Ratio – The working capital ratio is important to creditors because it shows
the liquidity of the company (Mathuva, 2015). A working capital ratio less than 1.0 will have
more liquidity problems in future whereas a ratio of 2.0 is considered to represent good short-
term liquidity. Two ratios has been used for determining the working capital of company:
a. Working capital Ratio – The ratio of Capita for the year 2015 is 0.857 which has
been declining for the next two year i.e. 0.647 in 2016 and 0.642 in year 2017. It means
company is having more liabilities and business obligations against current assets.
b. Inventory Turnover Ratio – It is considered as an efficiency ratio which shows how
effectively the inventory is managed by company. It measures how many times the
average inventory is sold during a period. The inventory turnover is 0 for last 3 year
because of non availability of inventory data.
4. Long term solvency Ratio – This ratio indicates whether the cash flow of company is
sufficient to meet its short-and long-term liabilities effectively. It has two categories:
a. Debt to equity Ratio – Capita debt to equity ratio includes 6.76, -10.88 and -5.36 for the last 3
year. It has improved from 2016 to 2017 which shows that company is improving its financial
position.
b. Equity Ratio – It measures the amount of company's assets financed by the owners by making
investment in business. The equity ratio of Capita is 12.71%, -10.01% and -22.60% for 2015,
2016 and 2017 respectively. It shows that company is not having ideal and optimal capital
structure.
Financial Analysis of Serco Group PLC -
Serco Group PLC is a British based company which is a provider of public services
having headquarters in Hook, Hampshire. The business operation of Serco is in six different
sectors of public service department viz. Health, Transport, Justice, Immigration, Defence, and
Citizens Services. The financial analysis is done by taking into consideration all the income
statement, balance sheet, and cash flow statement of the relevant accounting period i.e. from the
5
should adopt capital restructuring process for improving the return on employed capital.
3. Working Capital Ratio – The working capital ratio is important to creditors because it shows
the liquidity of the company (Mathuva, 2015). A working capital ratio less than 1.0 will have
more liquidity problems in future whereas a ratio of 2.0 is considered to represent good short-
term liquidity. Two ratios has been used for determining the working capital of company:
a. Working capital Ratio – The ratio of Capita for the year 2015 is 0.857 which has
been declining for the next two year i.e. 0.647 in 2016 and 0.642 in year 2017. It means
company is having more liabilities and business obligations against current assets.
b. Inventory Turnover Ratio – It is considered as an efficiency ratio which shows how
effectively the inventory is managed by company. It measures how many times the
average inventory is sold during a period. The inventory turnover is 0 for last 3 year
because of non availability of inventory data.
4. Long term solvency Ratio – This ratio indicates whether the cash flow of company is
sufficient to meet its short-and long-term liabilities effectively. It has two categories:
a. Debt to equity Ratio – Capita debt to equity ratio includes 6.76, -10.88 and -5.36 for the last 3
year. It has improved from 2016 to 2017 which shows that company is improving its financial
position.
b. Equity Ratio – It measures the amount of company's assets financed by the owners by making
investment in business. The equity ratio of Capita is 12.71%, -10.01% and -22.60% for 2015,
2016 and 2017 respectively. It shows that company is not having ideal and optimal capital
structure.
Financial Analysis of Serco Group PLC -
Serco Group PLC is a British based company which is a provider of public services
having headquarters in Hook, Hampshire. The business operation of Serco is in six different
sectors of public service department viz. Health, Transport, Justice, Immigration, Defence, and
Citizens Services. The financial analysis is done by taking into consideration all the income
statement, balance sheet, and cash flow statement of the relevant accounting period i.e. from the
5
Paraphrase This Document
Need a fresh take? Get an instant paraphrase of this document with our AI Paraphraser
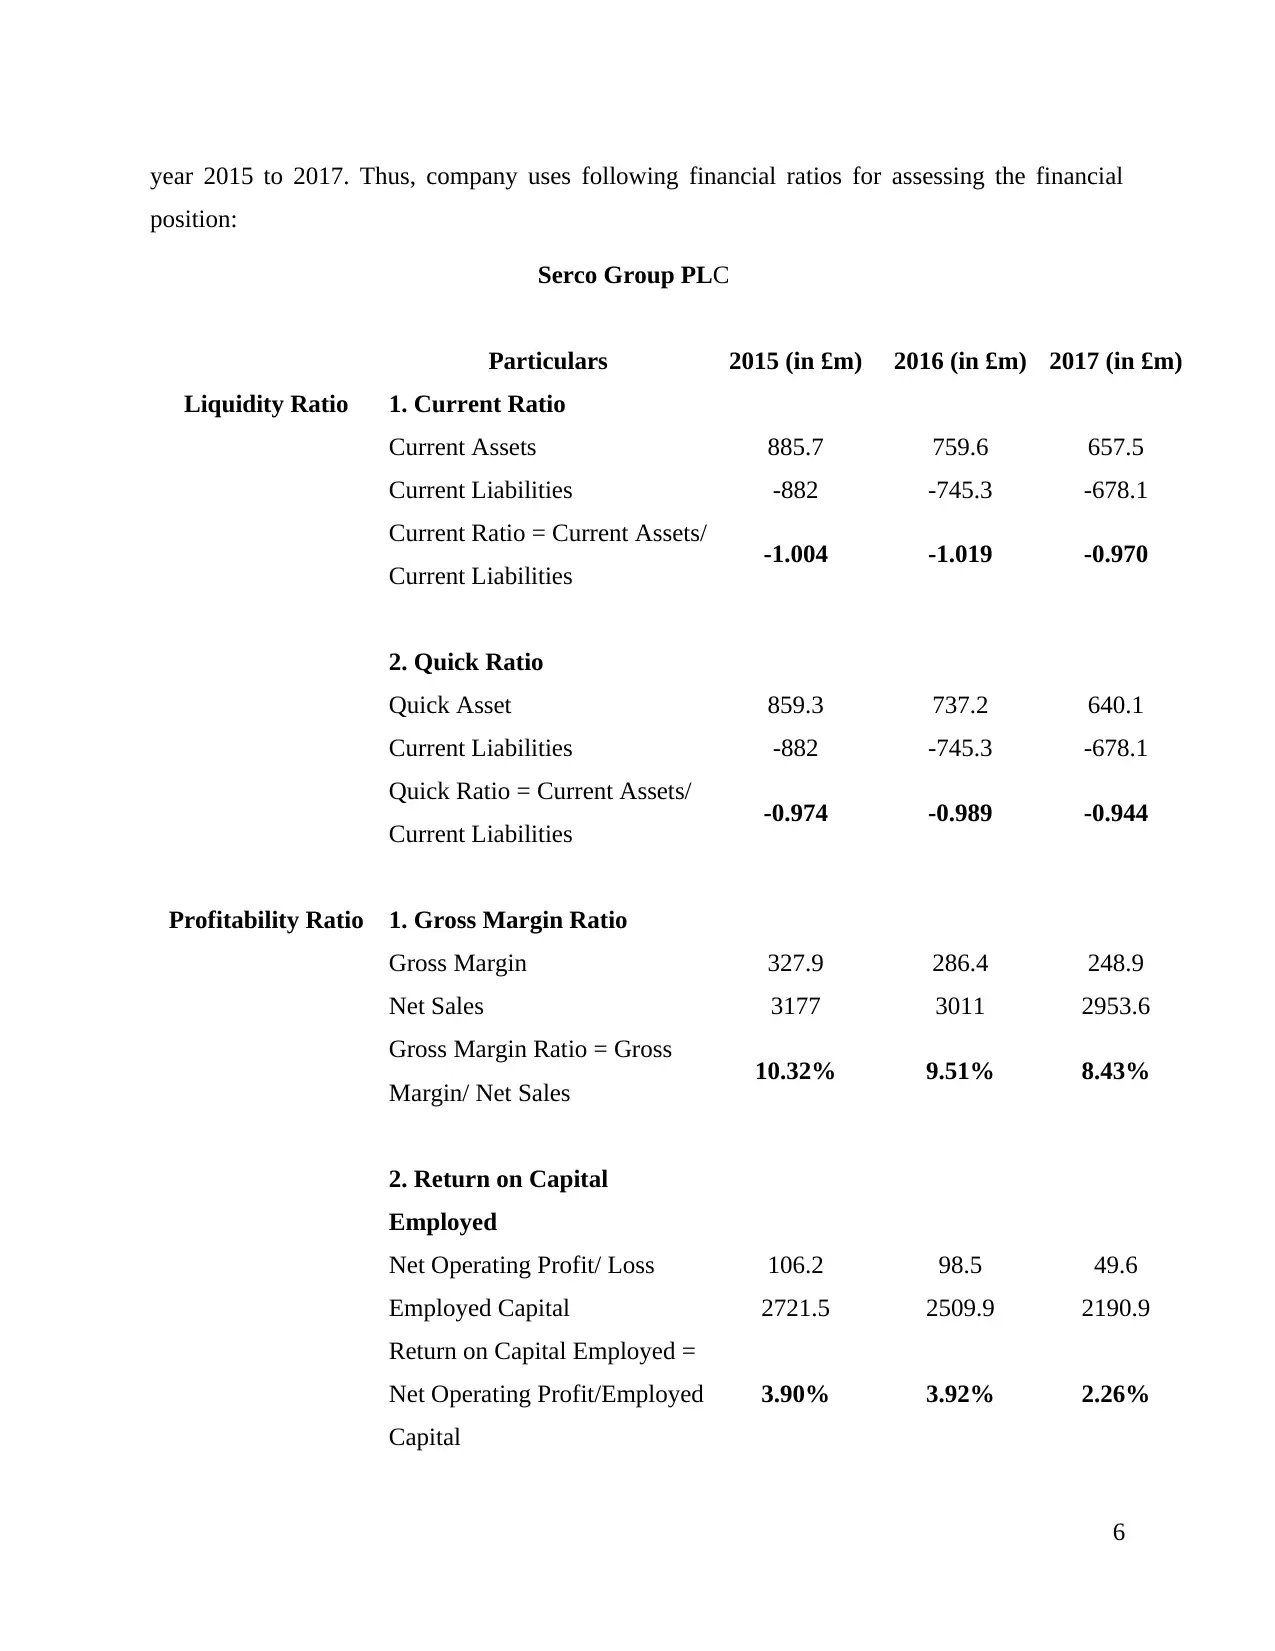
year 2015 to 2017. Thus, company uses following financial ratios for assessing the financial
position:
Serco Group PLC
Particulars 2015 (in £m) 2016 (in £m) 2017 (in £m)
Liquidity Ratio 1. Current Ratio
Current Assets 885.7 759.6 657.5
Current Liabilities -882 -745.3 -678.1
Current Ratio = Current Assets/
Current Liabilities -1.004 -1.019 -0.970
2. Quick Ratio
Quick Asset 859.3 737.2 640.1
Current Liabilities -882 -745.3 -678.1
Quick Ratio = Current Assets/
Current Liabilities -0.974 -0.989 -0.944
Profitability Ratio 1. Gross Margin Ratio
Gross Margin 327.9 286.4 248.9
Net Sales 3177 3011 2953.6
Gross Margin Ratio = Gross
Margin/ Net Sales 10.32% 9.51% 8.43%
2. Return on Capital
Employed
Net Operating Profit/ Loss 106.2 98.5 49.6
Employed Capital 2721.5 2509.9 2190.9
Return on Capital Employed =
Net Operating Profit/Employed
Capital
3.90% 3.92% 2.26%
6
Working capital
Ratio 1. Working capital Ratio
Current Assets 885.7 759.6 657.5
Current Liabilities -882 -745.3 -678.1
Working capital Ratio =
Current Assets/Current
Liabilities
-1.004 -1.019 -0.970
2. Inventory Turnover Ratio
Net Sales 3177 3011 2953.6
Average Inventory at Cost 28.8 24.4 19.9
Inventory Turnover Ratio =
Net Sales/Average Inventory at
Cost
110.31 123.40 148.42
Long term solvency
ratio 1.Debt to equity Ratio
Total Liabilities -1557.4 -1365.8 -1205.6
Total Equity 282.1 398.8 307.2
Debt equity Ratio = Total
Liabilities /Total Equity -5.52 -3.42 -3.92
2. Equity Ratio
Total Equity 282.1 398.8 307.2
Total Assets 1839.5 1764.6 1512.8
Equity Ratio = Total
Equity/Total Assets 15.34% 22.60% 20.31%
(Source: Serco Annual Report and Accounts, 2017)
Interpretation:
7
⊘ This is a preview!⊘
Do you want full access?
Subscribe today to unlock all pages.
Trusted by 1+ million students worldwide
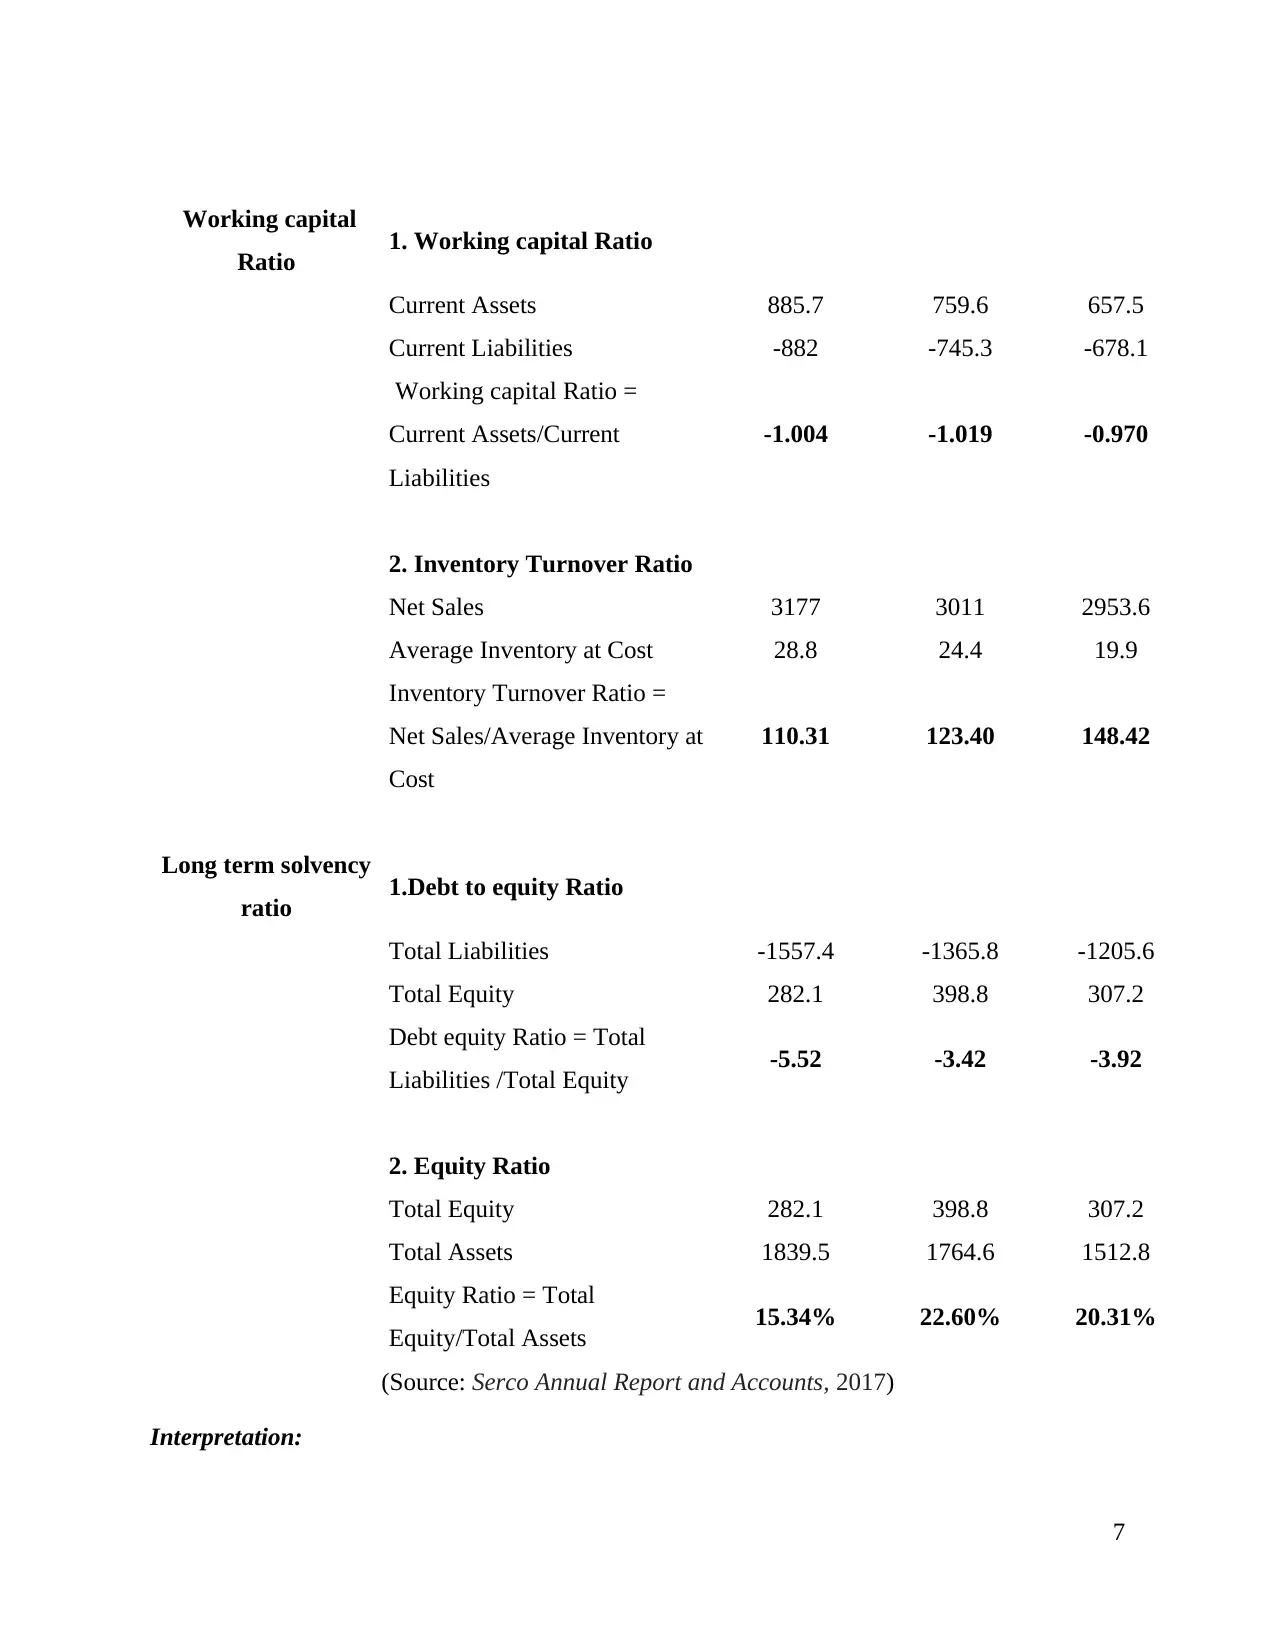
1. Liquidity Ratio - It shows the present cash levels which company is having with itself. It
depicts the ability of the company in turning its current assets into cash and cash equivalents so
as to pay off all liabilities and other current business obligations. In above case, company has
uses two ratios viz.
a. Current Ratio - The Current Ratio of Serco PLC is -1.004, -1.019 and -0.970 for year
2015, 2016 and 2017 respectively. The ratio is coming negative which shows that Serco
will suffer from high default risk.
b. Quick Ratio – The quick ratio for Serco is -0.974, -0.989 and -0.944 for the year 2015,
2016 and 2017. With the help of this ratio, solvency position of company can be
ascertained. Ratio calculated defines that serco is taking too much risk by not maintaining
appropriate level of liquid resources.
2. Profitability Ratio – This ratio helps in determining how well or appropriately the company
is using its assets for generating profits (Sari, Nurlaela and Titisari, 2018). It predicts the
solvency position of company which can help investors in making judgement related to
investment. Two ratio has been used to determine profitability situation of Serco:
a. Gross Margin Ratio – The gross ratio of Serko is declining from 10.32% in year
2015 to 8.43% in year 2017. Decrease in gross ratio is not good from company as well as
investor perspectives as it will portrays negative image in mind of investors related to
investment decision.
b. Return on Capital Employed – It determines how efficiently the company is using
its capital employed as well as long-term financing strategies. It helps in knowing
whether the returns of entity are high enough to cover the business cost of capital. Serco
return is 3.90%, 3.92% and 2.26% during the last 3 year. It means company is not
properly utilizing its capital resources in conducting its business operations.
3. Working Capital Ratio – The working capital ratio is considered as a measure of liquidity
which helps in revealing whether a business can pay its obligations. Two ratios has been used for
determining the working capital of company:
a. Working capital Ratio – It is similar to Current Ratio which helps in assessing the
ability of company in paying off its liability as and when they arise or become due. The
8
Paraphrase This Document
Need a fresh take? Get an instant paraphrase of this document with our AI Paraphraser
ratio of Serco is negative i.e. -1.004, -1.019 and -0.970 during the last year 3 consecutive
financial year. It means the current liabilities exceed its current assets i.e. liabilities to be
paid within one year exceed current assets monetizable over the same period.
b. Inventory Turnover Ratio – It determines the ability of a company to sell its
inventory produce with profit. Serco is having an inventory turnover ratio of 110.31,
123.40 and 148.42 for last 3 financial year. It means the company is having unexpectedly
high and strong sales for meeting customer demand.
5. Long term solvency Ratio – This ratio measure the ability of company in meeting its
total business and financial obligations on time (Albrecher and et.al., 2018). It has two
sub categories:
a. Debt to equity Ratio – This ratio compares the total debt to total equity of the company. It
shows the percentage which is financed from creditors and investors. The ratio of Serco is -5.52,
-3.42 and -3.92 for 2015, 2016 and 2017 respectively. Company because of leveraging large
amounts of debt not be able to make the payments on time.
b. Equity Ratio – It depicts two important financial concepts which are solvency and
sustainability of business. The ratio of Serco are 15.34%, 22.60% and 20.31% which shows that
company is giving or sharing part of its profit among its shareholders as it is less leveraged.
From the above financial analysis, it can be concluded that Capita PLC is best for bidding
contract because it is having good current asset, quick and working capital ratio which is the
essence of every business. Also, the gross profit is increasing with time from 20.63% to 24.86%
over the last year.
TASK B
Evaluating the financial position of both the suppliers and customers at the time of
liquidation process.
Financial risk is defined as error or risk associated with the business as well as financial
transactions carried on by the company. It is the probability of incurring loss which is inherent in
the financing methods causing impairing in the ability of company in providing adequate return.
The financial risk of company is related to the concept in which the business firm will be unable
to meet its current financial obligations.
9
Suppliers – The term supplier is defined as the business entity which is engaged in the
business of supplying or delivering goods and services produced within an entity to another
business organization (Živković and Komatina, 2017). This entity is considered as part of the
business supply chain which ensures the supply function by providing bulk value of products and
services as and when demand arises so as to earn high profits. The financial position of supplier
gets affected when Carillion comes into liquidation. Evaluating the supplier risk can be a
complex process because of the vast types of risk associated with it. Supplier has to face credit
risk or default risk on part of company liquidating in. This results in non payment by Carillion to
the suppliers resulting in increase in loss amount or low profitability level of suppliers. Due to
non payment by company to be liquidated, cash flow of suppliers gets affected as there is no
proper inflow of cash. This can further result in shortage of cash with suppliers, non procurement
of raw material because of low cash balance.
Also, such liquidation of Carillion will affect the financial as well as liquidity position of
suppliers. The poor financial health of suppliers leads to increase in the probability of issues or
problems with the performance as well as the quality level of supplier. When supplier is having
strong financial status, it helps them in increasing their ability to boost up the production and
manufacturing function, increases the operational efficiency of business. It also helps in
maintaining the continuity of business workflow and thus helps in building operational strength.
Customers – A customer is the one who is ready to pay something in exchange for
consuming or for making consumption of different goods and services produced. Thus,
customers play a vital role for every business organisation or company. It there is customer
demand, then company will not be able to survive in the competitive market for long time. They
are considered as the economic system of nation. Without customer demand, producers will not
be able to sell its products and services to any consumers. Customers are source of income for
company.
Customers who are also the shareholders of Carillion can face financial risk when
company goes into liquidation. Shareholders are generally aware of the financial risk and
rewards of share in which they are investing in. Shareholder or any stakeholders have financial
stake in the company which gets affected with the decision of management of the company.
When Carillion liquidates the rights of shareholders are hampered as they are rank behind the
10
⊘ This is a preview!⊘
Do you want full access?
Subscribe today to unlock all pages.
Trusted by 1+ million students worldwide
1 out of 17
Related Documents


Your All-in-One AI-Powered Toolkit for Academic Success.
+13062052269
info@desklib.com
Available 24*7 on WhatsApp / Email
![[object Object]](/_next/static/media/star-bottom.7253800d.svg)
Unlock your academic potential
Copyright © 2020–2026 A2Z Services. All Rights Reserved. Developed and managed by ZUCOL.