Financial Analysis Report: Croda International Plc - B9AC106
VerifiedAdded on 2022/12/29
|13
|3882
|85
Report
AI Summary
This report provides a comprehensive financial analysis of Croda International Plc, examining its financial performance from 2016 to 2018. The analysis includes a detailed interpretation of profitability, liquidity, solvency, and asset efficiency ratios, along with a comparison with competitors Henkel and BASF. The report identifies trends and assesses the company's financial position, highlighting areas of strength and weakness. Furthermore, it recommends an initiative to improve the company's profitability, focusing on strategies to enhance the net profit margin and return on equity. The report also briefly addresses a scenario involving a potential acquisition of shares by a competitor, offering advice on how to proceed. All workings are presented and external sources are cited, providing a thorough and insightful evaluation of Croda International Plc's financial health.
Running Head: Financial Analysis
Financial Analysis
[Type the document subtitle]
Laptop04011
[Pick the date]
Financial Analysis
[Type the document subtitle]
Laptop04011
[Pick the date]
Paraphrase This Document
Need a fresh take? Get an instant paraphrase of this document with our AI Paraphraser
Financial Analysis 1
Contents
Financial Performance of Croda International Plc..........................................................................1
Recommendation of Initiative to Improve Company’s Position.....................................................5
Evaluation of Company’s Shares.....................................................................................................7
Advise to Colleague.........................................................................................................................8
References........................................................................................................................................9
Financial Analysis 2
Financial Performance of Croda International Plc
Interpretation of ratios
Profitability Ratio
2016 2017 2018
0
1000
2000
3000
4000
5000
6000
Profitability Ratio
Revenue
Net profit
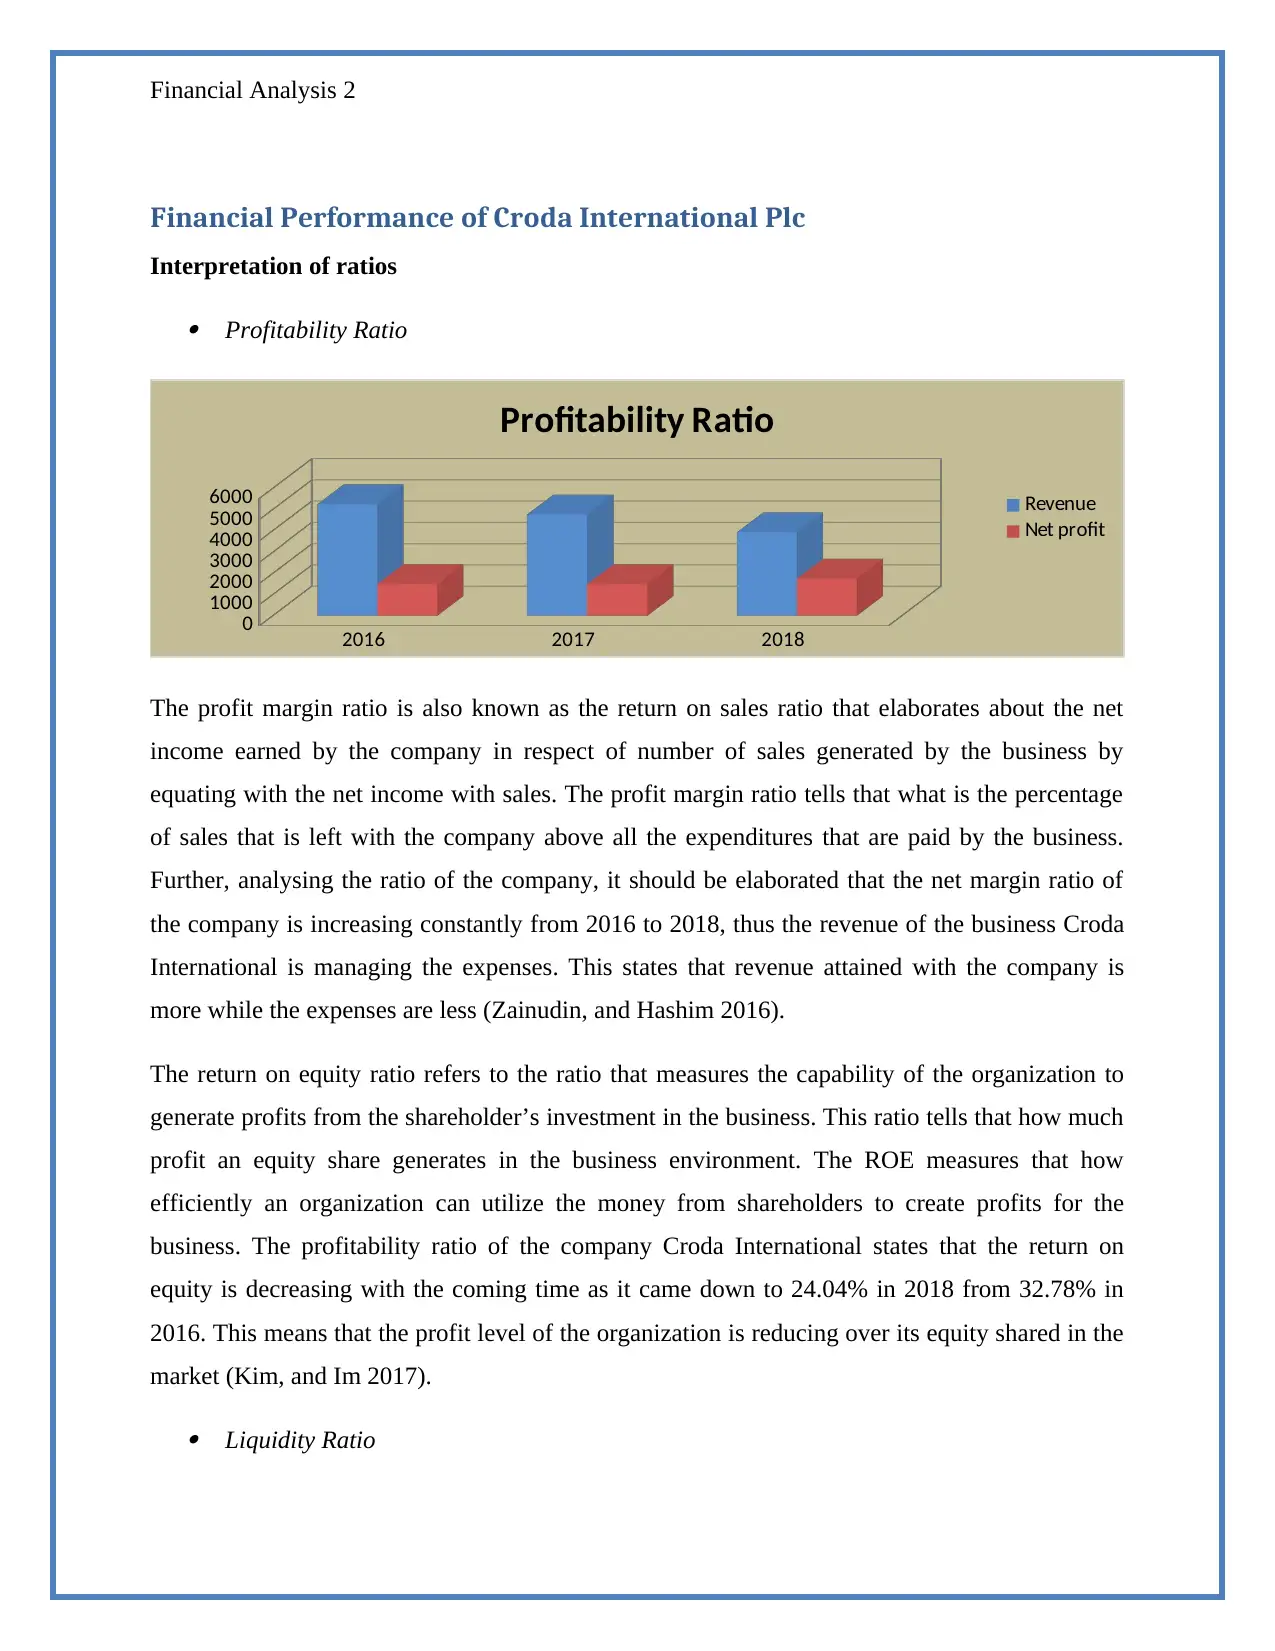
The profit margin ratio is also known as the return on sales ratio that elaborates about the net
income earned by the company in respect of number of sales generated by the business by
equating with the net income with sales. The profit margin ratio tells that what is the percentage
of sales that is left with the company above all the expenditures that are paid by the business.
Further, analysing the ratio of the company, it should be elaborated that the net margin ratio of
the company is increasing constantly from 2016 to 2018, thus the revenue of the business Croda
International is managing the expenses. This states that revenue attained with the company is
more while the expenses are less (Zainudin, and Hashim 2016).
The return on equity ratio refers to the ratio that measures the capability of the organization to
generate profits from the shareholder’s investment in the business. This ratio tells that how much
profit an equity share generates in the business environment. The ROE measures that how
efficiently an organization can utilize the money from shareholders to create profits for the
business. The profitability ratio of the company Croda International states that the return on
equity is decreasing with the coming time as it came down to 24.04% in 2018 from 32.78% in
2016. This means that the profit level of the organization is reducing over its equity shared in the
market (Kim, and Im 2017).
Liquidity Ratio
Financial Performance of Croda International Plc
Interpretation of ratios
Profitability Ratio
2016 2017 2018
0
1000
2000
3000
4000
5000
6000
Profitability Ratio
Revenue
Net profit
The profit margin ratio is also known as the return on sales ratio that elaborates about the net
income earned by the company in respect of number of sales generated by the business by
equating with the net income with sales. The profit margin ratio tells that what is the percentage
of sales that is left with the company above all the expenditures that are paid by the business.
Further, analysing the ratio of the company, it should be elaborated that the net margin ratio of
the company is increasing constantly from 2016 to 2018, thus the revenue of the business Croda
International is managing the expenses. This states that revenue attained with the company is
more while the expenses are less (Zainudin, and Hashim 2016).
The return on equity ratio refers to the ratio that measures the capability of the organization to
generate profits from the shareholder’s investment in the business. This ratio tells that how much
profit an equity share generates in the business environment. The ROE measures that how
efficiently an organization can utilize the money from shareholders to create profits for the
business. The profitability ratio of the company Croda International states that the return on
equity is decreasing with the coming time as it came down to 24.04% in 2018 from 32.78% in
2016. This means that the profit level of the organization is reducing over its equity shared in the
market (Kim, and Im 2017).
Liquidity Ratio
⊘ This is a preview!⊘
Do you want full access?
Subscribe today to unlock all pages.
Trusted by 1+ million students worldwide
Financial Analysis 3
2016 2017 2018
0
5000
10000
15000
Liquidity Ratio
Current assets
Current liabilities
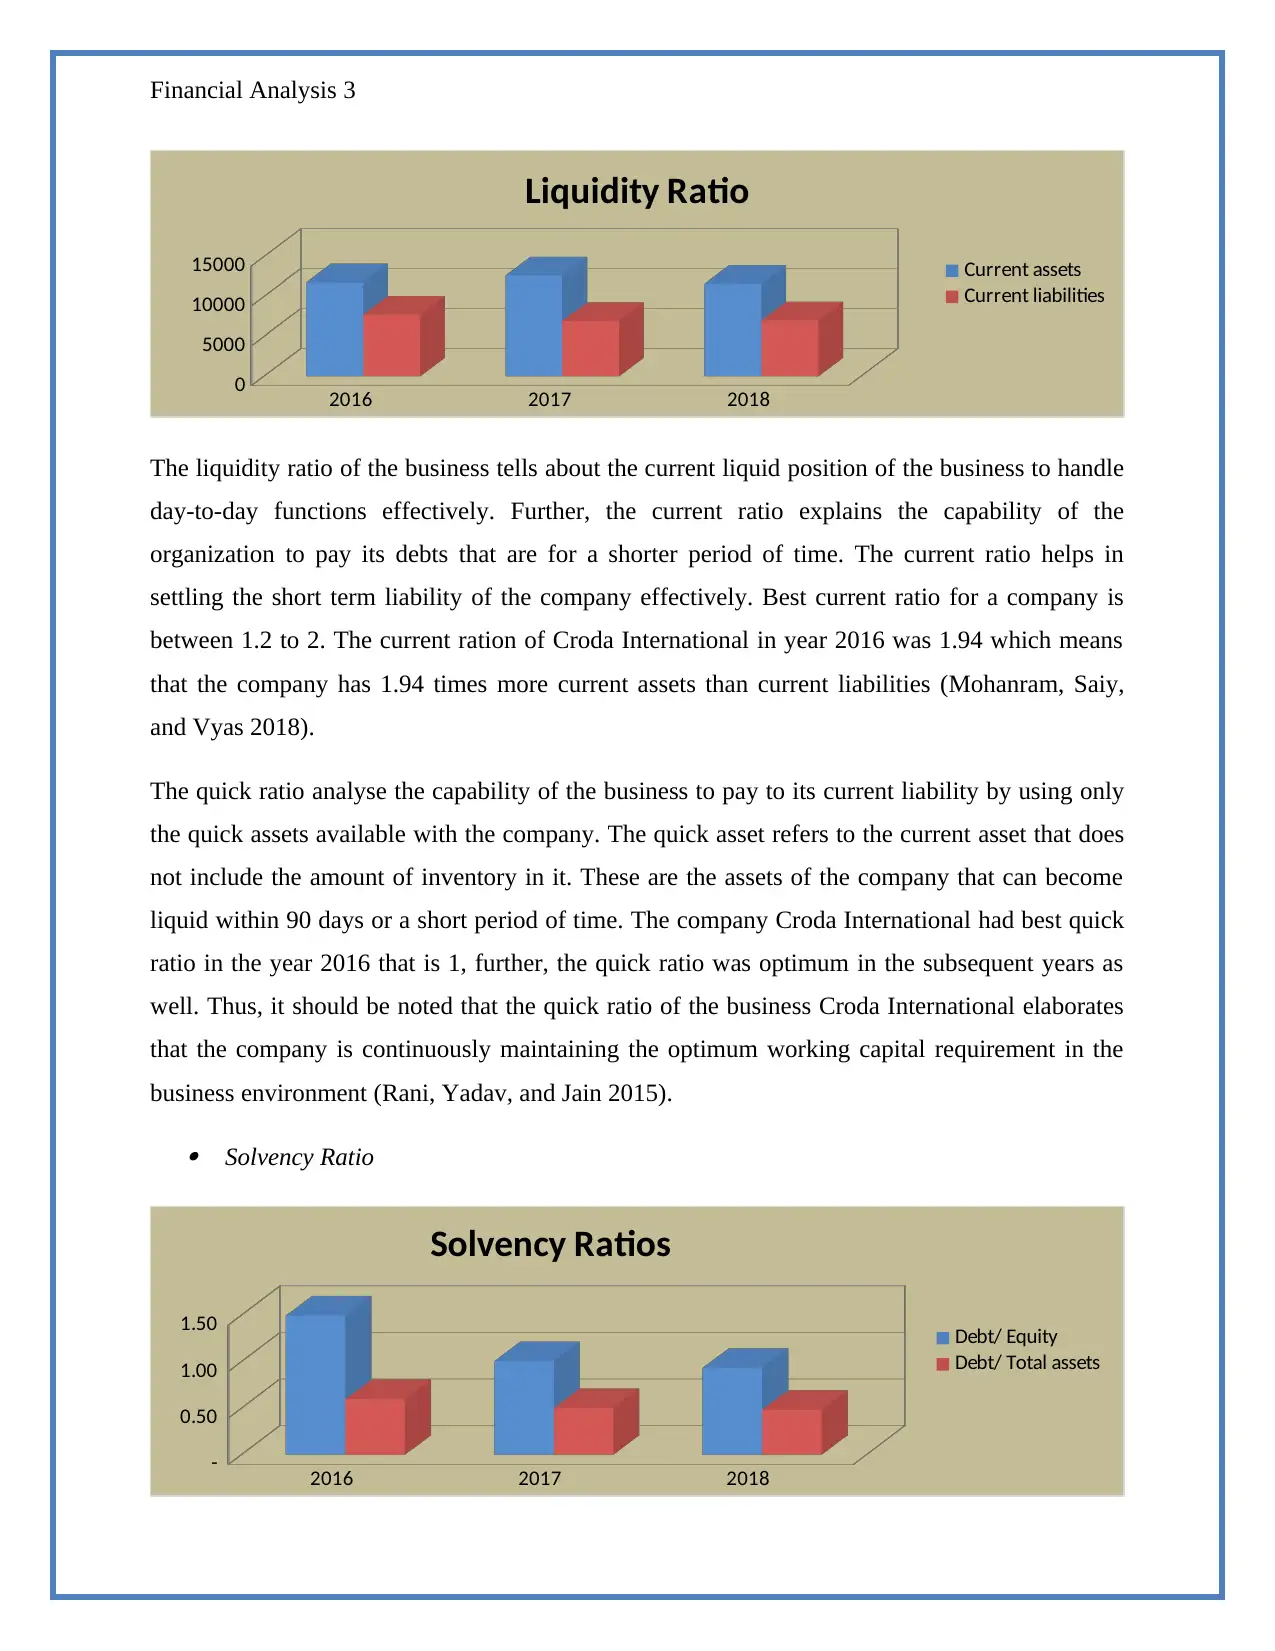
The liquidity ratio of the business tells about the current liquid position of the business to handle
day-to-day functions effectively. Further, the current ratio explains the capability of the
organization to pay its debts that are for a shorter period of time. The current ratio helps in
settling the short term liability of the company effectively. Best current ratio for a company is
between 1.2 to 2. The current ration of Croda International in year 2016 was 1.94 which means
that the company has 1.94 times more current assets than current liabilities (Mohanram, Saiy,
and Vyas 2018).
The quick ratio analyse the capability of the business to pay to its current liability by using only
the quick assets available with the company. The quick asset refers to the current asset that does
not include the amount of inventory in it. These are the assets of the company that can become
liquid within 90 days or a short period of time. The company Croda International had best quick
ratio in the year 2016 that is 1, further, the quick ratio was optimum in the subsequent years as
well. Thus, it should be noted that the quick ratio of the business Croda International elaborates
that the company is continuously maintaining the optimum working capital requirement in the
business environment (Rani, Yadav, and Jain 2015).
Solvency Ratio
2016 2017 2018
-
0.50
1.00
1.50
Solvency Ratios
Debt/ Equity
Debt/ Total assets
2016 2017 2018
0
5000
10000
15000
Liquidity Ratio
Current assets
Current liabilities
The liquidity ratio of the business tells about the current liquid position of the business to handle
day-to-day functions effectively. Further, the current ratio explains the capability of the
organization to pay its debts that are for a shorter period of time. The current ratio helps in
settling the short term liability of the company effectively. Best current ratio for a company is
between 1.2 to 2. The current ration of Croda International in year 2016 was 1.94 which means
that the company has 1.94 times more current assets than current liabilities (Mohanram, Saiy,
and Vyas 2018).
The quick ratio analyse the capability of the business to pay to its current liability by using only
the quick assets available with the company. The quick asset refers to the current asset that does
not include the amount of inventory in it. These are the assets of the company that can become
liquid within 90 days or a short period of time. The company Croda International had best quick
ratio in the year 2016 that is 1, further, the quick ratio was optimum in the subsequent years as
well. Thus, it should be noted that the quick ratio of the business Croda International elaborates
that the company is continuously maintaining the optimum working capital requirement in the
business environment (Rani, Yadav, and Jain 2015).
Solvency Ratio
2016 2017 2018
-
0.50
1.00
1.50
Solvency Ratios
Debt/ Equity
Debt/ Total assets
Paraphrase This Document
Need a fresh take? Get an instant paraphrase of this document with our AI Paraphraser
Financial Analysis 4
Solvency ratio refers to the key metric ratio that is used to analyse the ability of an organization
to meet its debt obligation. The solvency ratio elaborates the capability of the organization to pay
its debts in the market and do not make any defaulter. The debt to equity ratio explains the level
to which the finances of the business comes from the creditors as well as investors. This ratio
compares the debts with the equity that further tells that the company has more liability or
reserves. Higher ratio under this case explain that the business use more loans and finances than
the investor financing in the functions. The ratio of 2 to 1 is the best debt equity ratio, further the
company 1.50 in 2016 then, 1 in 2017 and 0.93 in 2018 that means that there are 1.5 liabilities of
1 equity and so on. This states that the company Croda has less financial risk in the environment
and holds the scope of working in a stable manner (Prentice 2016).
The debt to asset ratio refers to the ratio that explains the degree to which the business has debts
over its assets. This is leverage ratio that measure the amount of the assets financed by the
creditors against investors. This ratio exemplifies that how the company has developed and
attained its assets over a period of one year. The DTA of 0.60 states that the company has 60%
liabilities over 100% assets and the DTA of 2017 and 2018 are .50 and 0.48. This states that the
company has twice the assets than its liabilities (Kanapickienė, and Grundienė 2015).
Asset Efficiency Ratio
2016 2017 2018
-
5.00
10.00
15.00
Asset Efficiency Ratios
Receivable Turnover Ratio
Creditor Turnover Ratio
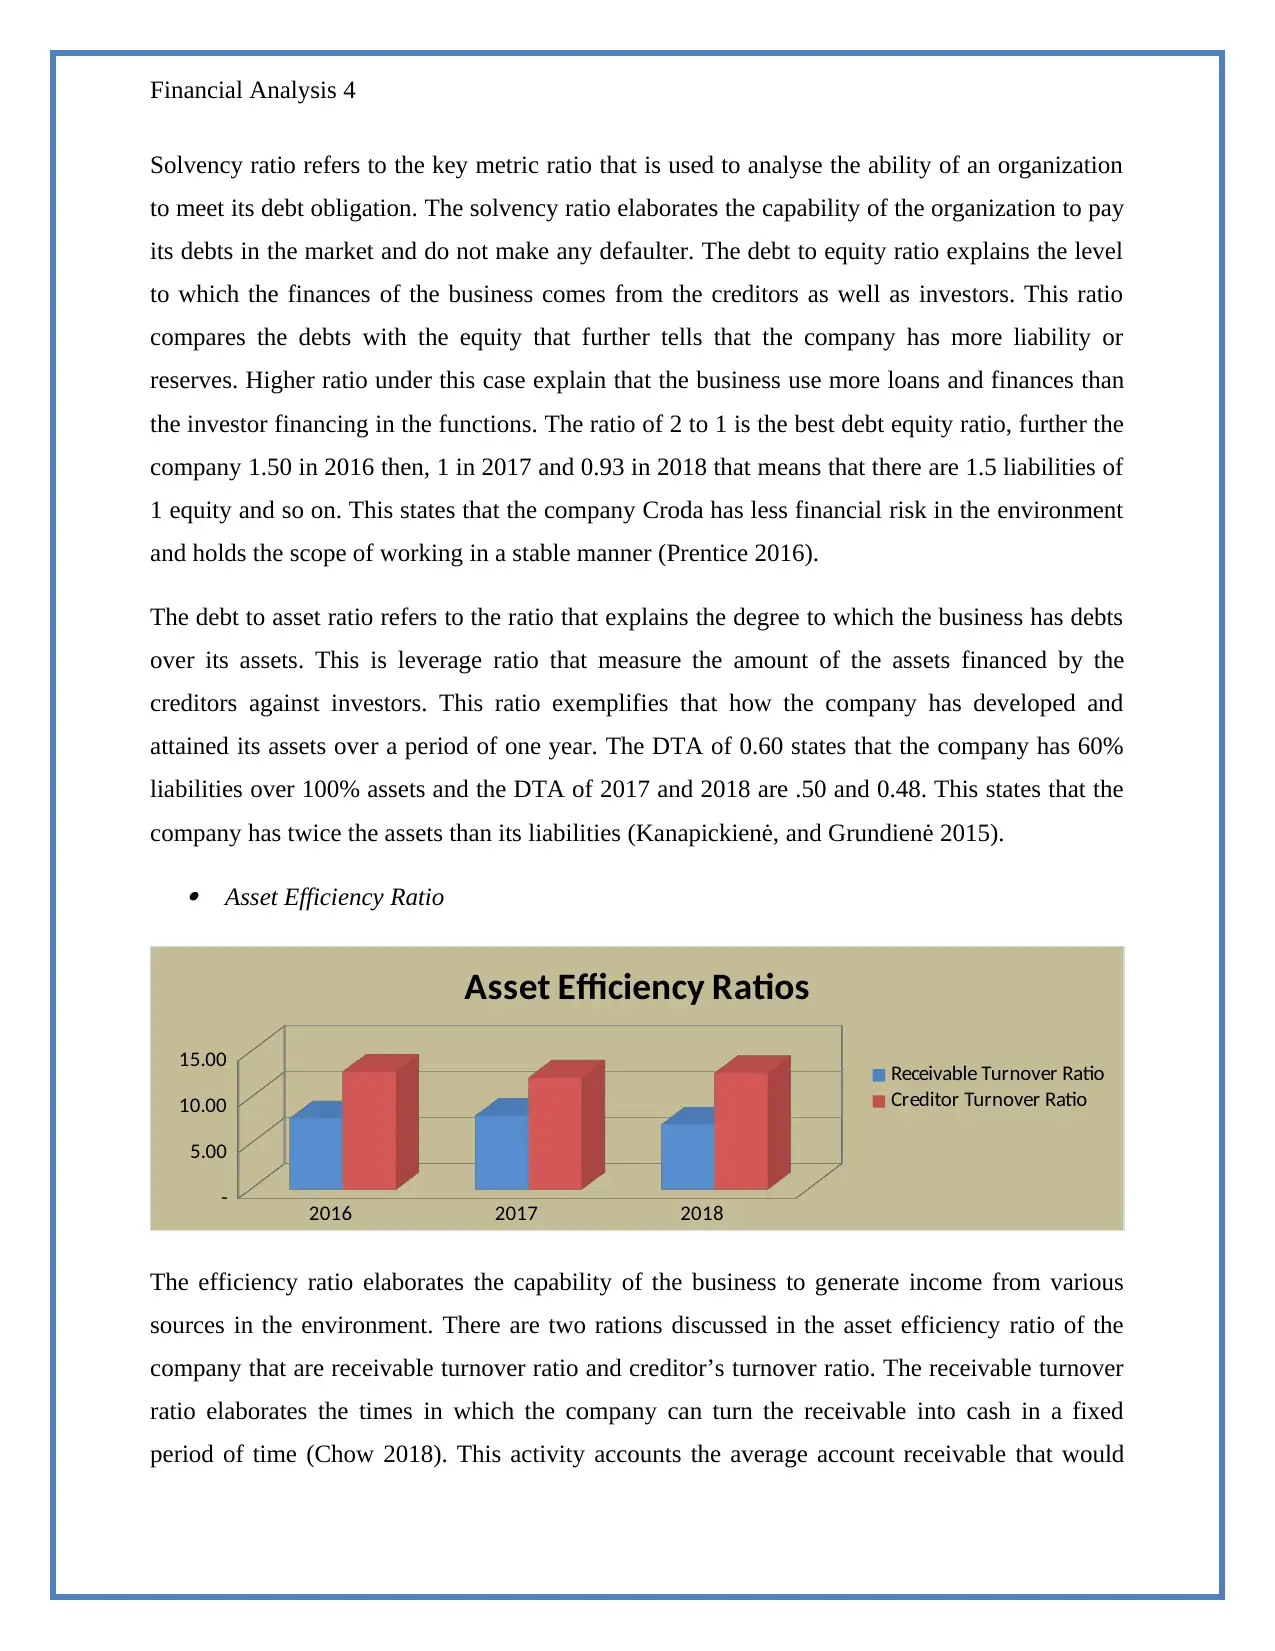
The efficiency ratio elaborates the capability of the business to generate income from various
sources in the environment. There are two rations discussed in the asset efficiency ratio of the
company that are receivable turnover ratio and creditor’s turnover ratio. The receivable turnover
ratio elaborates the times in which the company can turn the receivable into cash in a fixed
period of time (Chow 2018). This activity accounts the average account receivable that would
Solvency ratio refers to the key metric ratio that is used to analyse the ability of an organization
to meet its debt obligation. The solvency ratio elaborates the capability of the organization to pay
its debts in the market and do not make any defaulter. The debt to equity ratio explains the level
to which the finances of the business comes from the creditors as well as investors. This ratio
compares the debts with the equity that further tells that the company has more liability or
reserves. Higher ratio under this case explain that the business use more loans and finances than
the investor financing in the functions. The ratio of 2 to 1 is the best debt equity ratio, further the
company 1.50 in 2016 then, 1 in 2017 and 0.93 in 2018 that means that there are 1.5 liabilities of
1 equity and so on. This states that the company Croda has less financial risk in the environment
and holds the scope of working in a stable manner (Prentice 2016).
The debt to asset ratio refers to the ratio that explains the degree to which the business has debts
over its assets. This is leverage ratio that measure the amount of the assets financed by the
creditors against investors. This ratio exemplifies that how the company has developed and
attained its assets over a period of one year. The DTA of 0.60 states that the company has 60%
liabilities over 100% assets and the DTA of 2017 and 2018 are .50 and 0.48. This states that the
company has twice the assets than its liabilities (Kanapickienė, and Grundienė 2015).
Asset Efficiency Ratio
2016 2017 2018
-
5.00
10.00
15.00
Asset Efficiency Ratios
Receivable Turnover Ratio
Creditor Turnover Ratio
The efficiency ratio elaborates the capability of the business to generate income from various
sources in the environment. There are two rations discussed in the asset efficiency ratio of the
company that are receivable turnover ratio and creditor’s turnover ratio. The receivable turnover
ratio elaborates the times in which the company can turn the receivable into cash in a fixed
period of time (Chow 2018). This activity accounts the average account receivable that would
Financial Analysis 5
come into the business in a fixed period. The company Croda International had receivable
turnover ratio of 7.78, 8.08 and 7.11 from 2016 to 2018 which means that the company is turning
the account receivable into cash 7.78 times in the year of 2016. Further, it should also be noted
that this ratio explains that the company is efficient to collect the receivable frequently
throughout the year. This ratio of the company also shows that it is capable of initiating value of
credit sales and receivables in the business environment. High ratio presented by the company
shows that credit sales are more like to collected by the company in a fixed time period
(Brigham, et. al., 2016).
The second ratio under the efficiency ratio is creditor turnover ratio; this ratio elaborates the
efficiency of the company to pay back to its debts effectively in the business environment. This
type of ratio explains the creditworthiness of the company to make payment of goods purchased
on credit. Low ratio in the given case shows that the company makes delayed payments in the
industry. The creditor’s turnover ratio of the company Croda International is efficiently high as
the company is shuffling between 12 to 13 times of creditor’s turnover ratio. This elaborates that
the company does not make defaulters in the payment nor they delay the payment of credit
purchases in the business environment (Galati, et. al., 2016).
Competitor comparison
The two major competitors of the company Croda International are Henkel and BASF. BASF is
a German chemical company that is the biggest producer in the world. This organization works
in 80 countries with net profit margin of 7.51 % in the previous year. BASF was found in the
year 1865 by Friedrich Engelhorn, since then the organization is working to provide chemical
products to the people in the environment. This organization is also a strong player in the
agriculture crop protection and crude oil industry. The size of the organization is large which
makes them come under the top three market position in 70% of its businesses. More than half of
the sales of the company are generated in Europe, while rest is accounted in Asia and North
America. The headquarter of the company is situated in Germany and BASF gives a tough
competition to Croda International in the external business environment (Investing.com 2019).
Secondly, Henkel is another German chemical company that is the competitor of Croda
International. The organization is a multinational company that is active in both customer and
⊘ This is a preview!⊘
Do you want full access?
Subscribe today to unlock all pages.
Trusted by 1+ million students worldwide
Financial Analysis 6
manufacturing sector. Further, Henkel was found in the year 1876 and is organized into three
universally operating business units that are Beauty Care, Laundry, Home Care and Adhesive
Technologies (Zakaria, and Islam 2019).
Industry standards
It should be noted that the chemical industry is currently in the recovery mode because of
fluctuations present in the other industries and the external environment as well. The two major
end user of the industry that is automotive and housing markets helped the industry to cover its
position. The chemical companies have started looking for cost synergy opportunities and
enhanced operational scale through alliance in the environment. Fluctuations in dollars also
affected the pricing strategies of various companies due to which their profitability reduced.
However, with the coming of 2019, the industry started increasing their productivity and growth
due which profitability became stable. The stable economic conditions in the chemical industry
are increasing profitability in the environment. However, the new entrants in this industry are
still considered less because of the stability issue (Maynard 2017).
Recommendation of Initiative to Improve Company’s Position
Considering the financial analysis of the business, it should be noted that Croda International is
attaining optimum profitability in the external environment and is simultaneously growing as
well. The debt to equity ratio, current ratio along with the asset efficiency ratio shows the
optimum results in the environment. However, it can be seen as a need to improve the situation
of the company through profitability ratio. The management of the company Croda International
should focus on improving the profitability segment by increasing the net profit of the
organization (Cardoso, et. al., 2016). Raise in the net profit of the company will subsequently
give rise to the net profit margin and return on equity ratio of the company. In the year 2018, the
NPM ratio of the company was 17.16 however, looking at the other ratios and efficiency of the
company, it can be clearly seen that the company has wider scope to grow and expand their
actions in industrial environment (Hussain, Salia, and Karim 2018).
Looking up to the second profitability ratio that is return on equity ratio, it should be noted that
in the year 2016, the company had considerable proportionate of 32.78% of return on equity
Paraphrase This Document
Need a fresh take? Get an instant paraphrase of this document with our AI Paraphraser
Financial Analysis 7
which further landed to 24.04% in the year 2018. It important for the business to improve this
ratio as it is the most important ratio that is being analysed by the investors in the external
environment. Investors initially look for how much profitability the company is providing to
their stakeholders in the external environment, once the profitability factor is good then the
investors look for the stability aspect of the company (Steinker, Pesch, and Hoberg 2016). Thus,
it should be noted that if the profitability analysis of the company Croda International is not good
then ultimately the investors will not even give more time to look in the project. The company
should analyse the ways that are causing a problem in the improvement in the profitability of the
company and then they should implement the actions accordingly. This ratio explains the net
income of the company in relation to the shareholder’s equity. This ratio evaluates the return that
a company generates on their capital that is owned by the shareholders. Basically, it is the
amount of profit that the company aims to deliver to the shareholders (Valickova, Havranek, and
Horvath 2015). There are several ways that the company should use to improve this ratio, these
ways are discussed below:
More use of Financial Leverage: The Company can finance them with debt and equity capital so
as to increase its profitability in the environment. If the company will increase the debt capital
relative to its equity capital then they would be able to increase the ROE ratio. Increasing the
debts in the business will help the organization to compare the equity of the company against the
assets as well as debts that subsequently in increase the ROE (Uechi, et. al., 2015). This happens
due to financial leverage that increases the return on equity for the company. This means that if
the company will reduce the number of equity distributed in the environment and it will increase
the debts then they would be able to satisfy the investors in a better way (Grimm, and Blazovich
2016).
Increase in Profit Margin: As the profit is the numerator in the ROE ratio of the company, thus
increase the net profit of the organization will ultimately increase the return on equity in the
business environment. Increasing the profit does not always comes with selling more products in
the business environment as it also comes up with increasing the price of each product sold and
reducing the cost of goods sold as well. A combination of both the activities can also increase the
profits of the company. If the company will earn more than revenue in the environment
considering all the other factors constant then they would be able to enjoy more profits.
Financial Analysis 8
Resulting in which, the business would be able to provide more benefits to investors in the
business environment (Robinson, et. al., 2015).
Improve asset turnover rate: asset turnover rate measures that efficiency of the company to work
effectively in the business environment. Low asset turnover reduces the ROE while high asset
turnover increases the efficiency of the company Croda International to work and increase the
satisfaction level of customers in the business environment (MorningStar 2019).
Evaluation of Company’s Shares
Valuation of Company's shares
EPS Total Earnings/ Outstanding Share 0.07
Price to book Ratio Market Capitalization/Total Assets 2.79
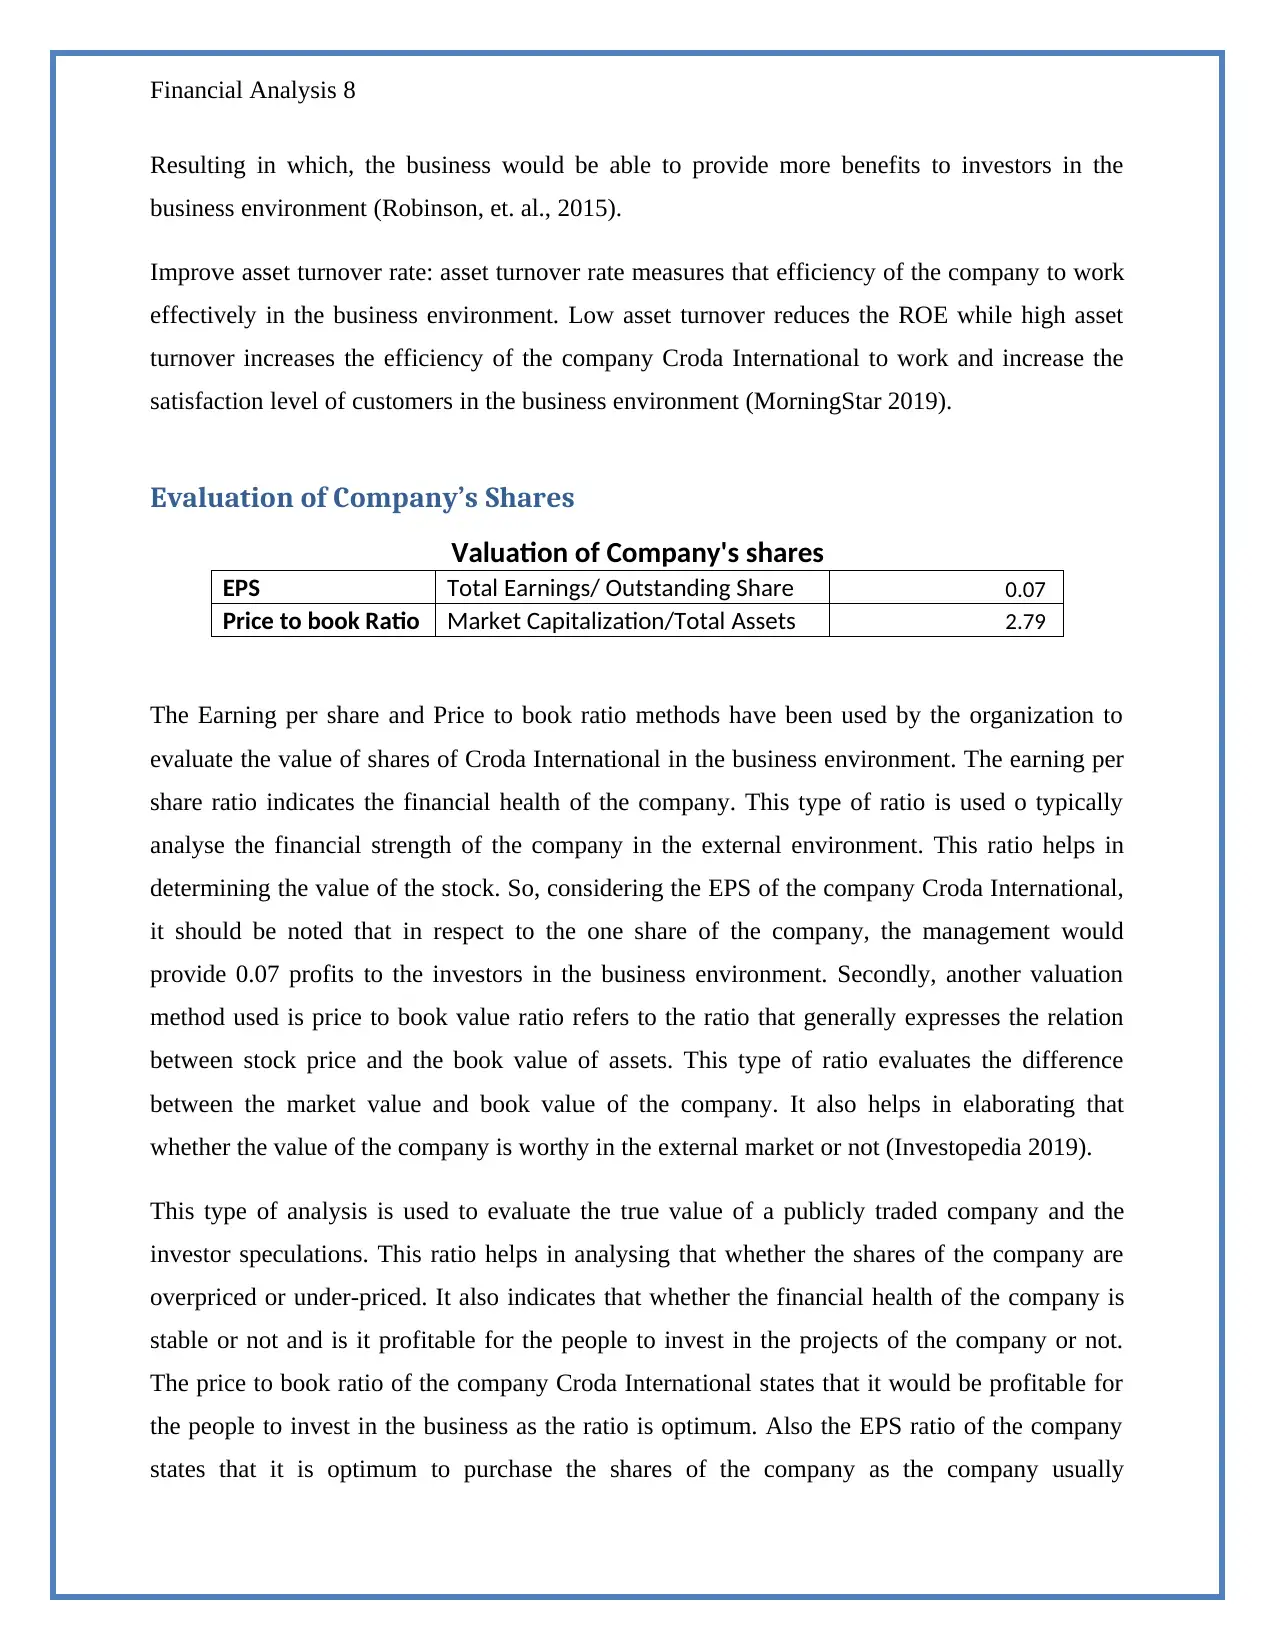
The Earning per share and Price to book ratio methods have been used by the organization to
evaluate the value of shares of Croda International in the business environment. The earning per
share ratio indicates the financial health of the company. This type of ratio is used o typically
analyse the financial strength of the company in the external environment. This ratio helps in
determining the value of the stock. So, considering the EPS of the company Croda International,
it should be noted that in respect to the one share of the company, the management would
provide 0.07 profits to the investors in the business environment. Secondly, another valuation
method used is price to book value ratio refers to the ratio that generally expresses the relation
between stock price and the book value of assets. This type of ratio evaluates the difference
between the market value and book value of the company. It also helps in elaborating that
whether the value of the company is worthy in the external market or not (Investopedia 2019).
This type of analysis is used to evaluate the true value of a publicly traded company and the
investor speculations. This ratio helps in analysing that whether the shares of the company are
overpriced or under-priced. It also indicates that whether the financial health of the company is
stable or not and is it profitable for the people to invest in the projects of the company or not.
The price to book ratio of the company Croda International states that it would be profitable for
the people to invest in the business as the ratio is optimum. Also the EPS ratio of the company
states that it is optimum to purchase the shares of the company as the company usually
Resulting in which, the business would be able to provide more benefits to investors in the
business environment (Robinson, et. al., 2015).
Improve asset turnover rate: asset turnover rate measures that efficiency of the company to work
effectively in the business environment. Low asset turnover reduces the ROE while high asset
turnover increases the efficiency of the company Croda International to work and increase the
satisfaction level of customers in the business environment (MorningStar 2019).
Evaluation of Company’s Shares
Valuation of Company's shares
EPS Total Earnings/ Outstanding Share 0.07
Price to book Ratio Market Capitalization/Total Assets 2.79
The Earning per share and Price to book ratio methods have been used by the organization to
evaluate the value of shares of Croda International in the business environment. The earning per
share ratio indicates the financial health of the company. This type of ratio is used o typically
analyse the financial strength of the company in the external environment. This ratio helps in
determining the value of the stock. So, considering the EPS of the company Croda International,
it should be noted that in respect to the one share of the company, the management would
provide 0.07 profits to the investors in the business environment. Secondly, another valuation
method used is price to book value ratio refers to the ratio that generally expresses the relation
between stock price and the book value of assets. This type of ratio evaluates the difference
between the market value and book value of the company. It also helps in elaborating that
whether the value of the company is worthy in the external market or not (Investopedia 2019).
This type of analysis is used to evaluate the true value of a publicly traded company and the
investor speculations. This ratio helps in analysing that whether the shares of the company are
overpriced or under-priced. It also indicates that whether the financial health of the company is
stable or not and is it profitable for the people to invest in the projects of the company or not.
The price to book ratio of the company Croda International states that it would be profitable for
the people to invest in the business as the ratio is optimum. Also the EPS ratio of the company
states that it is optimum to purchase the shares of the company as the company usually
⊘ This is a preview!⊘
Do you want full access?
Subscribe today to unlock all pages.
Trusted by 1+ million students worldwide
Financial Analysis 9
reciprocate the benefits to the stakeholders in the business environment. The valuation of shares
of the company Croda International elaborated that the shares of the company hold an optimum
value in the international market and it is profitable for the people to invest in the business to
attain profits. Thus, it should be noted that the investment of the competitors in the shares of the
company would provide them profitability in the external environment (Merritt 2019).
Advise to Colleague
Yes, it is advisable to the relative that they should invest in shares of the company as they will
provide profitability to them with long term growth objective in the business environment.
Looking at the financial ratios of Croda International, it can be clearly seen that the liquidity of
the company is adequate that provides effectiveness to the management to operate its actions
with optimum working capital in the business environment. The asset efficiency ratio of the
company states that the company is making good use of the assets in the business and it is able to
increase the benefits as well. The ratios of the company are optimum that shows growth to the
business in the external environment. Further, the net profit margin of the company along with
return on equity is optimum that states that the company provide a good share of their profit to
the investors in the form of dividend in the business environment.
People looking for less risk and optimum profits should invest in this company because of
stability, consistent profitability and goodwill in the business. Lastly, there is less risk in
investing Croda International because the functions of the company are initiated at large scale
that keeps various assets of the company at stake and the business does not involve in taking any
decision that can ruin its image in the external environment. Thus, it is advisable to the colleague
that they should invest in the company for attaining long-term profitability coupled with low
risks in the environment.
Paraphrase This Document
Need a fresh take? Get an instant paraphrase of this document with our AI Paraphraser
Financial Analysis 10
References
Brigham, E.F., Ehrhardt, M.C., Nason, R.R. and Gessaroli, J., 2016. Financial Managment:
Theory And Practice, Canadian Edition. Nelson Education.
Cardoso, D.O., Carvalho, D.S., Alves, D.S., Souza, D.F., Carneiro, H.C., Pedreira, C.E., Lima,
P.M. and França, F.M., 2016. Financial credit analysis via a clustering weightless neural
classifier. Neurocomputing, 183, pp.70-78.
Chow, J.C., 2018. Analysis of Financial Credit Risk Using Machine Learning. arXiv preprint
arXiv:1802.05326.
Galati, G., Hindrayanto, I., Koopman, S.J. and Vlekke, M., 2016. Measuring financial cycles in a
model-based analysis: Empirical evidence for the United States and the euro area. Economics
Letters, 145, pp.83-87.
Grimm, S.D. and Blazovich, J.L., 2016. Developing student competencies: An integrated
approach to a financial statement analysis project. Journal of Accounting Education, 35, pp.69-
101.
Hussain, J., Salia, S. and Karim, A., 2018. Is knowledge that powerful? Financial literacy and
access to finance: An analysis of enterprises in the UK. Journal of Small Business and Enterprise
Development, 25(6), pp.985-1003.
Investing.com., (2019). Chemical Industry Stock Outlook - Aug 2016 [online]. Retrieved from <
https://www.investing.com/analysis/chemical-industry-stock-outlook---aug-2016-200147079 >
[Accessed on 26 June 2019].
Investopedia., (2019). What is the formula for calculating earnings per share? [online]. Retrieved
from < https://www.investopedia.com/ask/answers/070114/what-formula-calculating-earnings-
share-eps.asp> [Accessed on 26 Jun. 19].
Kanapickienė, R. and Grundienė, Ž., 2015. The model of fraud detection in financial statements
by means of financial ratios. Procedia-Social and Behavioral Sciences, 213, pp.321-327.
Financial Analysis 11
Kim, J. and Im, C., 2017. Study on corporate social responsibility (CSR): Focus on tax
avoidance and financial ratio analysis. Sustainability, 9(10), p.1710.
Maynard, J., 2017. Financial accounting, reporting, and analysis. Oxford University Press.
Merritt. C., (2019). Market Capitalization vs. Total Assets [online]. Retrieved from <
https://finance.zacks.com/market-capitalization-vs-total-assets-1965.html> [Accessed on 26 Jun.
19].
Mohanram, P., Saiy, S. and Vyas, D., 2018. Fundamental analysis of banks: the use of financial
statement information to screen winners from losers. Review of Accounting Studies, 23(1),
pp.200-233.
MorningStar., (2019) Croda International Plc. [online]. Retrieved from <
https://www.morningstar.com/stocks/pinx/coihf/quote.html > [Accessed on 26 Jun. 19].
Prentice, C.R., 2016. Why so many measures of nonprofit financial performance? Analyzing and
improving the use of financial measures in nonprofit research. Nonprofit and Voluntary Sector
Quarterly, 45(4), pp.715-740.
Rani, N., Yadav, S.S. and Jain, P.K., 2015. Financial performance analysis of mergers and
acquisitions: evidence from India. International Journal of Commerce and Management, 25(4),
pp.402-423.
Robinson, T.R., Henry, E., Pirie, W.L. and Broihahn, M.A., 2015. International financial
statement analysis. John Wiley & Sons.
Steinker, S., Pesch, M. and Hoberg, K., 2016. Inventory management under financial distress: an
empirical analysis. International Journal of Production Research, 54(17), pp.5182-5207.
Uechi, L., Akutsu, T., Stanley, H.E., Marcus, A.J. and Kenett, D.Y., 2015. Sector dominance
ratio analysis of financial markets. Physica A: Statistical Mechanics and its Applications, 421,
pp.488-509.
Valickova, P., Havranek, T. and Horvath, R., 2015. Financial development and economic
growth: A meta‐analysis. Journal of Economic Surveys, 29(3), pp.506-526.
⊘ This is a preview!⊘
Do you want full access?
Subscribe today to unlock all pages.
Trusted by 1+ million students worldwide
1 out of 13
Related Documents


Your All-in-One AI-Powered Toolkit for Academic Success.
+13062052269
info@desklib.com
Available 24*7 on WhatsApp / Email
![[object Object]](/_next/static/media/star-bottom.7253800d.svg)
Unlock your academic potential
Copyright © 2020–2026 A2Z Services. All Rights Reserved. Developed and managed by ZUCOL.