Financial Analysis of Debenhams Plc and Competitors: A Detailed Report
VerifiedAdded on 2020/05/11
|27
|5465
|32
Report
AI Summary
This report provides a comprehensive financial analysis of Debenhams Plc, a leading British multinational retail company, evaluating its performance against key competitors like Marks and Spencer. The analysis encompasses a detailed examination of the company's background, market position, and strategic issues. The core of the report focuses on a five-year ratio analysis, including profitability, liquidity, and gearing ratios, to assess the company's financial health and identify trends. The report highlights Debenhams' strengths and weaknesses relative to its rivals, providing insights into its financial stability and operational efficiency. The analysis includes an assessment of strategic and operational challenges influencing the business, offering a holistic view of the company's financial standing and future prospects. The report uses financial data from multiple sources to provide a detailed and informative overview of Debenhams' financial performance.
Financial Analysis and Management 1
Financial Analysis and Management
Financial Analysis and Management
Paraphrase This Document
Need a fresh take? Get an instant paraphrase of this document with our AI Paraphraser
Financial Analysis and Management 2
Table of Contents
Introduction......................................................................................................................................3
A) Back ground of the company and its position in front of its rivals............................................3
B) Ratio Analysis of Five years.......................................................................................................5
C) Strategic and Operational issues...............................................................................................15
Conclusion.....................................................................................................................................17
References......................................................................................................................................18
Appendices....................................................................................................................................22
Financial Analysis and Management 3
Introduction
The objective of the report is to analyses the financial performance of the company namely
Debenhams Plc and its competitor. This report is divided into three tasks i.e. background of the
company, five year financial performance of the companies through ratio analysis and strategic
and operational issues of the company that influences the operations of the business. Ratio
analyses of the company analyze the performance of the company and its position in front of its
rivals.
A) Back ground of the company and its position in front of its rivals.
Debenhams plc is a leading British Multinational retail company started under the format of
departmental store in UK and Ireland. It has also different stores in different countries The first
store of the company is in London which has founded in 18th century and now the company ahs
the 178 locations across the UK, Denmark and Ireland. It is the public company listed in London
Stock Exchange (LSE).the current employees are 27,187.The company appointed the new
Director namely Mr David Adams in October 2017.Debenhams has the unique position in the
fashion accessories of all the ages and genders from more than two centuries (Debenhams,
2017). The company runs its 160 mid size departmental stores in the UK and deals in women,
kids and men’s apparel, cosmetics, electrical, house ware and toys. The leading brands of the
company are Debut, Red Herring and New England about 70% of its total sales. The company
also offers a weeding registry and inbuilt stores and restaurants. Apart from UK the company
opened its 7-0 stores at global level which includes the countries like Bahrain, Turkey and
Indonesia and company also has 15 stores which is owned and located in Ireland and Denmark.
⊘ This is a preview!⊘
Do you want full access?
Subscribe today to unlock all pages.
Trusted by 1+ million students worldwide
Financial Analysis and Management 4
The company also runs its online business in the name of Debenhams Direct (Morning star,
2017).
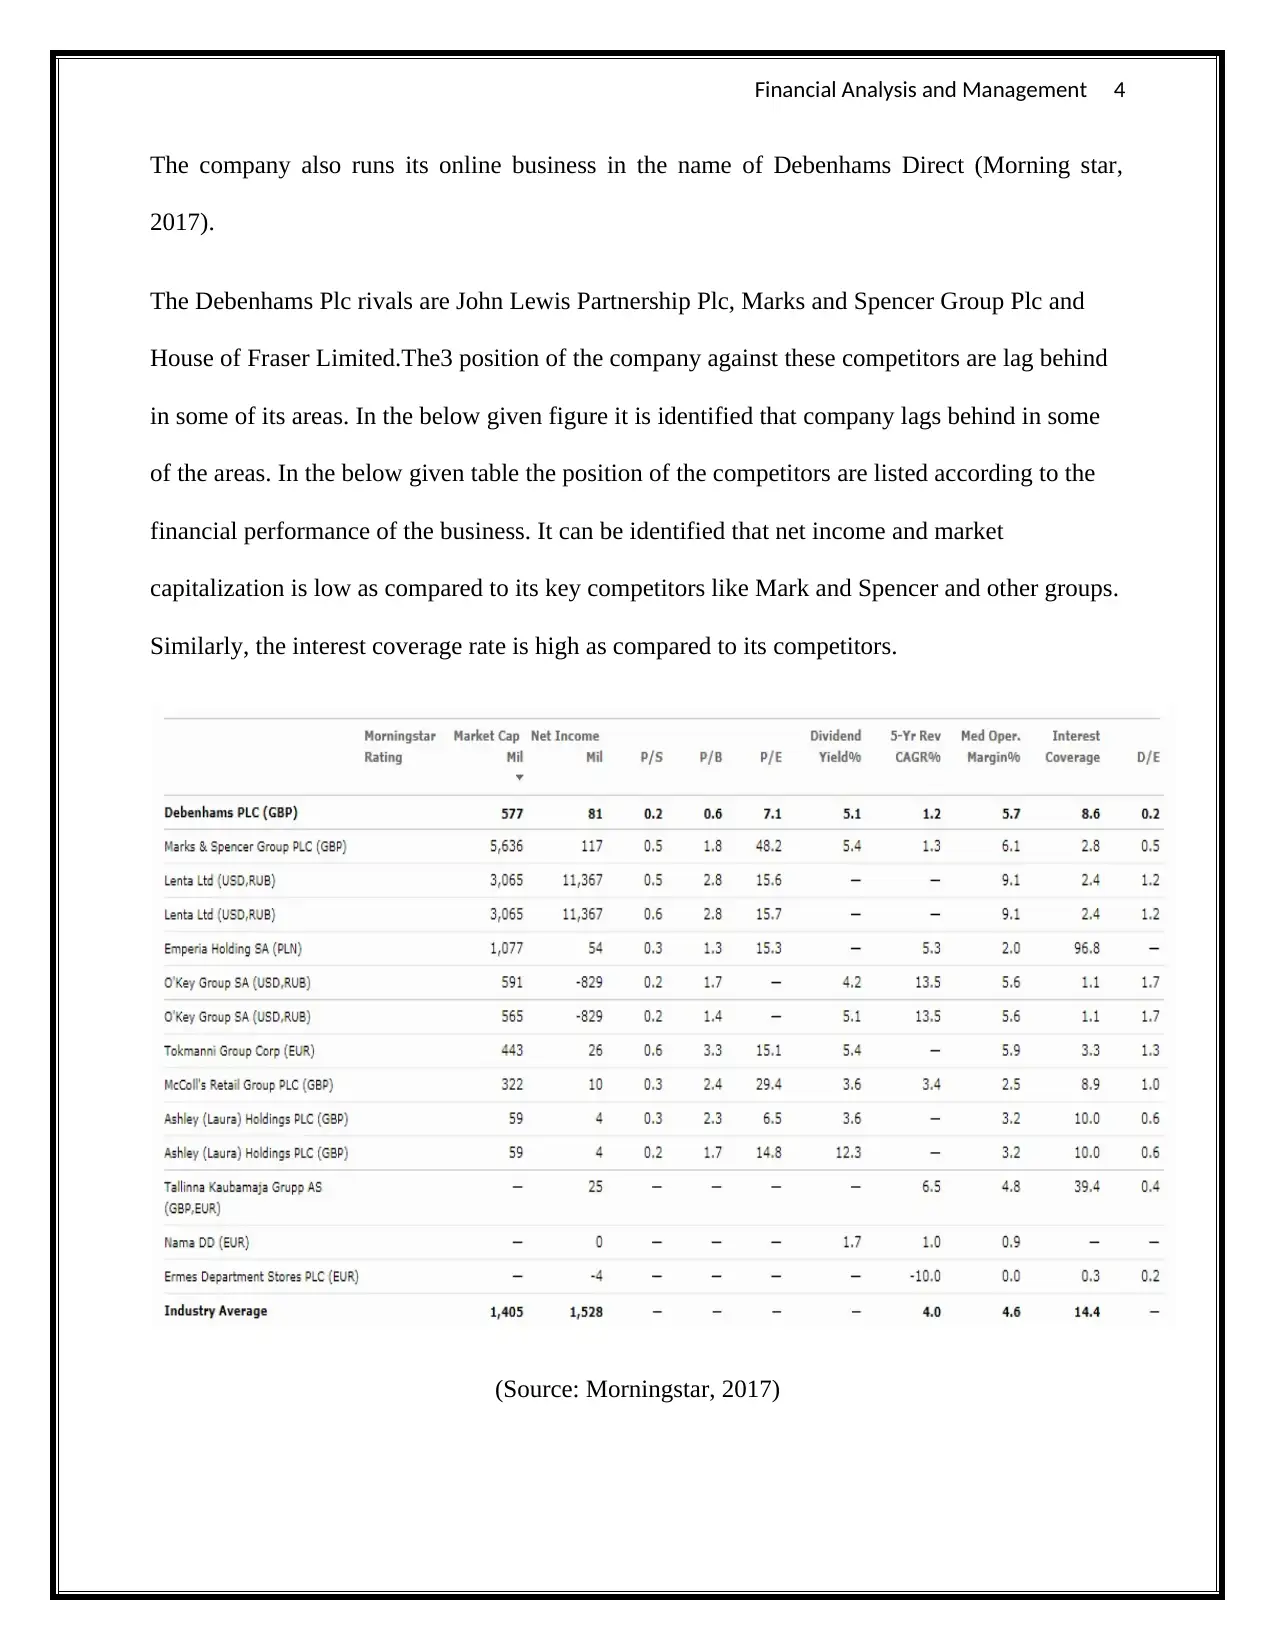
The Debenhams Plc rivals are John Lewis Partnership Plc, Marks and Spencer Group Plc and
House of Fraser Limited.The3 position of the company against these competitors are lag behind
in some of its areas. In the below given figure it is identified that company lags behind in some
of the areas. In the below given table the position of the competitors are listed according to the
financial performance of the business. It can be identified that net income and market
capitalization is low as compared to its key competitors like Mark and Spencer and other groups.
Similarly, the interest coverage rate is high as compared to its competitors.
(Source: Morningstar, 2017)
The company also runs its online business in the name of Debenhams Direct (Morning star,
2017).
The Debenhams Plc rivals are John Lewis Partnership Plc, Marks and Spencer Group Plc and
House of Fraser Limited.The3 position of the company against these competitors are lag behind
in some of its areas. In the below given figure it is identified that company lags behind in some
of the areas. In the below given table the position of the competitors are listed according to the
financial performance of the business. It can be identified that net income and market
capitalization is low as compared to its key competitors like Mark and Spencer and other groups.
Similarly, the interest coverage rate is high as compared to its competitors.
(Source: Morningstar, 2017)
Paraphrase This Document
Need a fresh take? Get an instant paraphrase of this document with our AI Paraphraser
Financial Analysis and Management 5
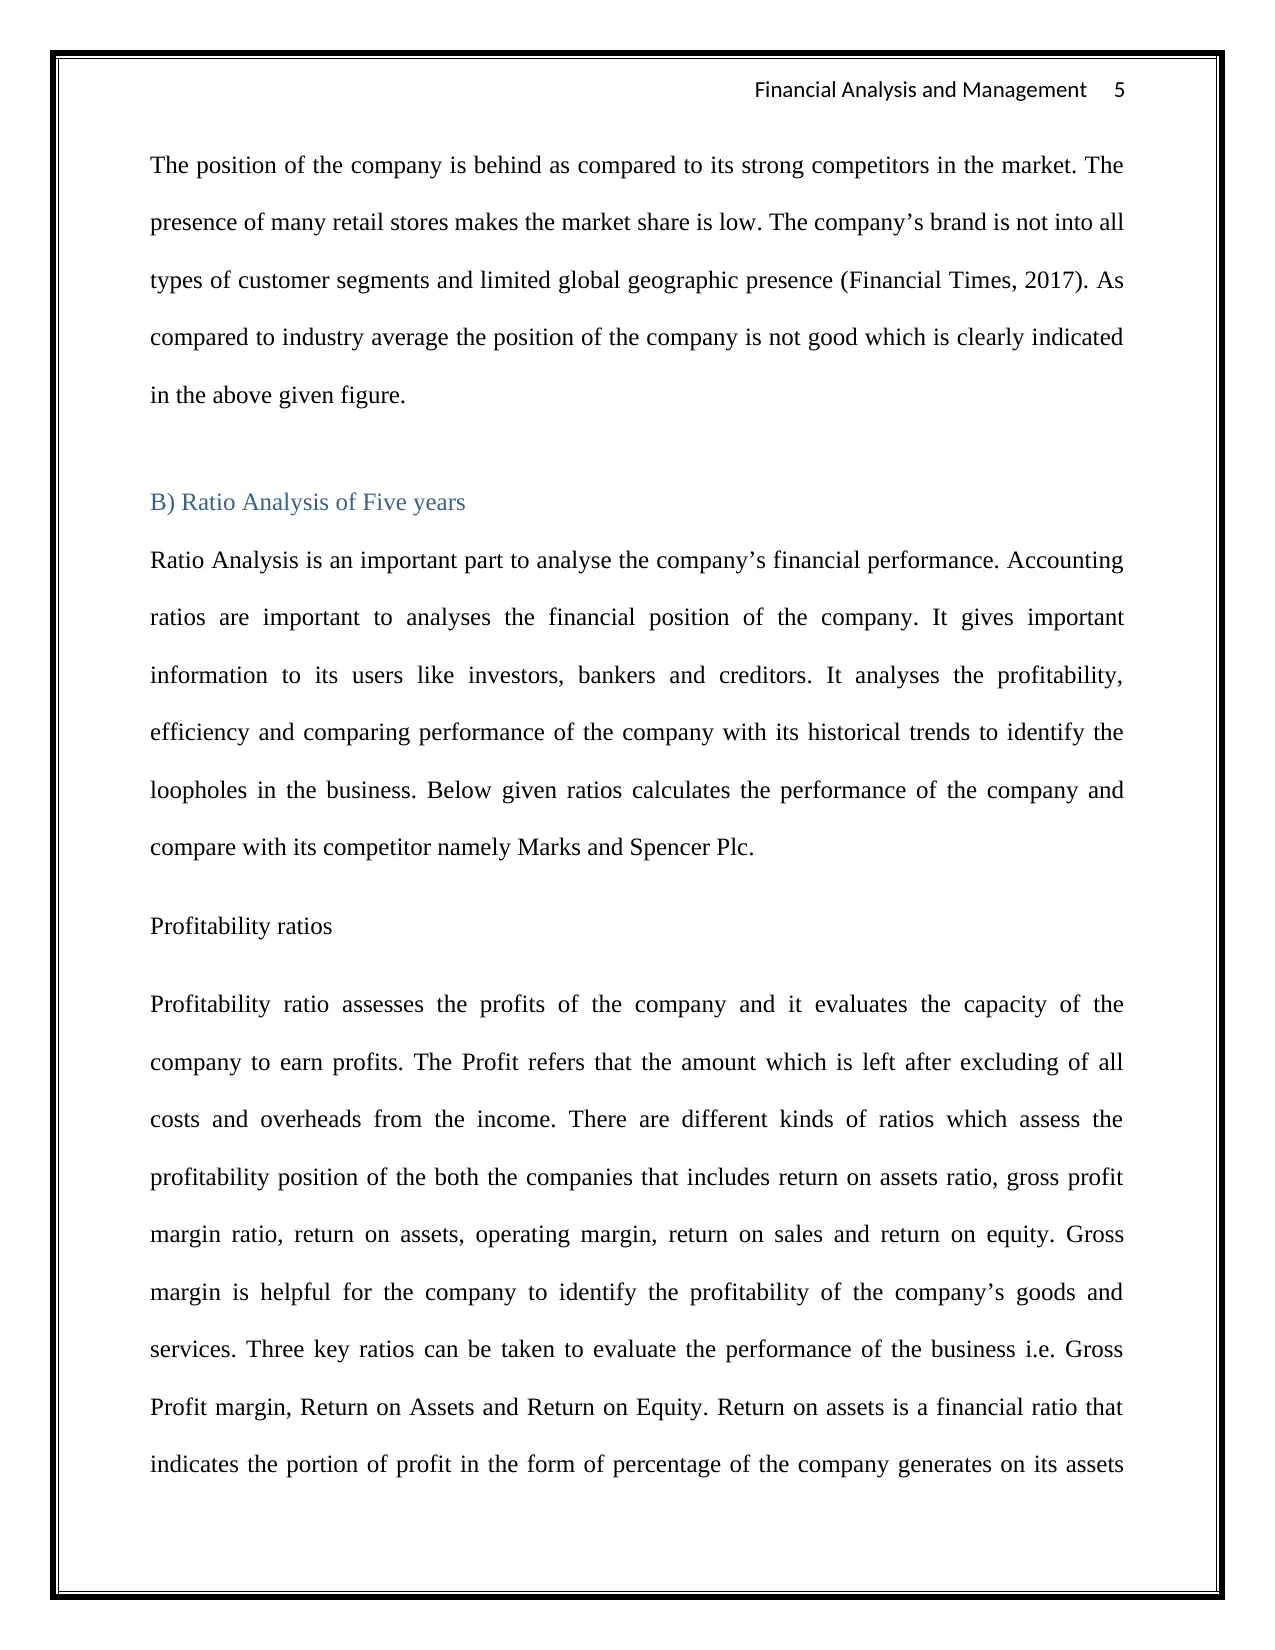
The position of the company is behind as compared to its strong competitors in the market. The
presence of many retail stores makes the market share is low. The company’s brand is not into all
types of customer segments and limited global geographic presence (Financial Times, 2017). As
compared to industry average the position of the company is not good which is clearly indicated
in the above given figure.
B) Ratio Analysis of Five years
Ratio Analysis is an important part to analyse the company’s financial performance. Accounting
ratios are important to analyses the financial position of the company. It gives important
information to its users like investors, bankers and creditors. It analyses the profitability,
efficiency and comparing performance of the company with its historical trends to identify the
loopholes in the business. Below given ratios calculates the performance of the company and
compare with its competitor namely Marks and Spencer Plc.
Profitability ratios
Profitability ratio assesses the profits of the company and it evaluates the capacity of the
company to earn profits. The Profit refers that the amount which is left after excluding of all
costs and overheads from the income. There are different kinds of ratios which assess the
profitability position of the both the companies that includes return on assets ratio, gross profit
margin ratio, return on assets, operating margin, return on sales and return on equity. Gross
margin is helpful for the company to identify the profitability of the company’s goods and
services. Three key ratios can be taken to evaluate the performance of the business i.e. Gross
Profit margin, Return on Assets and Return on Equity. Return on assets is a financial ratio that
indicates the portion of profit in the form of percentage of the company generates on its assets
Financial Analysis and Management 6
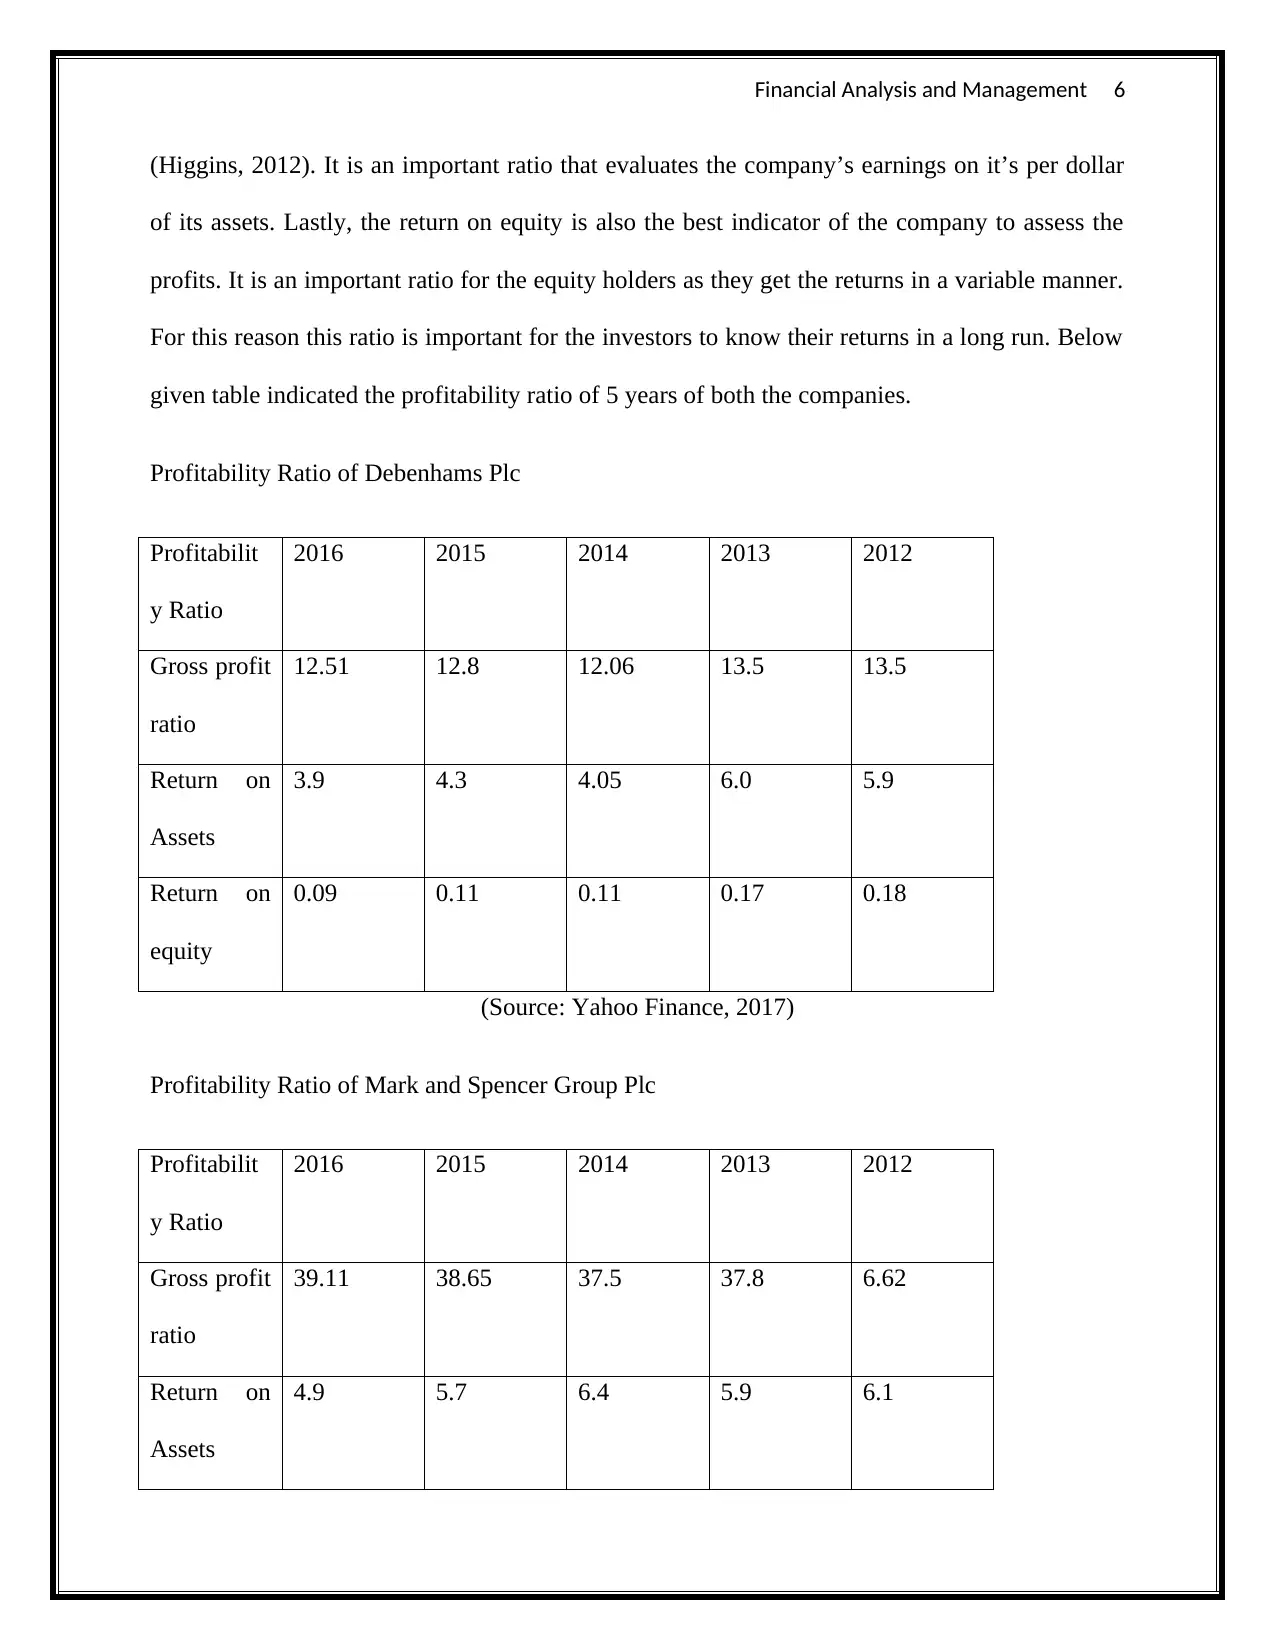
(Higgins, 2012). It is an important ratio that evaluates the company’s earnings on it’s per dollar
of its assets. Lastly, the return on equity is also the best indicator of the company to assess the
profits. It is an important ratio for the equity holders as they get the returns in a variable manner.
For this reason this ratio is important for the investors to know their returns in a long run. Below
given table indicated the profitability ratio of 5 years of both the companies.
Profitability Ratio of Debenhams Plc
Profitabilit
y Ratio
2016 2015 2014 2013 2012
Gross profit
ratio
12.51 12.8 12.06 13.5 13.5
Return on
Assets
3.9 4.3 4.05 6.0 5.9
Return on
equity
0.09 0.11 0.11 0.17 0.18
(Source: Yahoo Finance, 2017)
Profitability Ratio of Mark and Spencer Group Plc
Profitabilit
y Ratio
2016 2015 2014 2013 2012
Gross profit
ratio
39.11 38.65 37.5 37.8 6.62
Return on
Assets
4.9 5.7 6.4 5.9 6.1
⊘ This is a preview!⊘
Do you want full access?
Subscribe today to unlock all pages.
Trusted by 1+ million students worldwide
Financial Analysis and Management 7
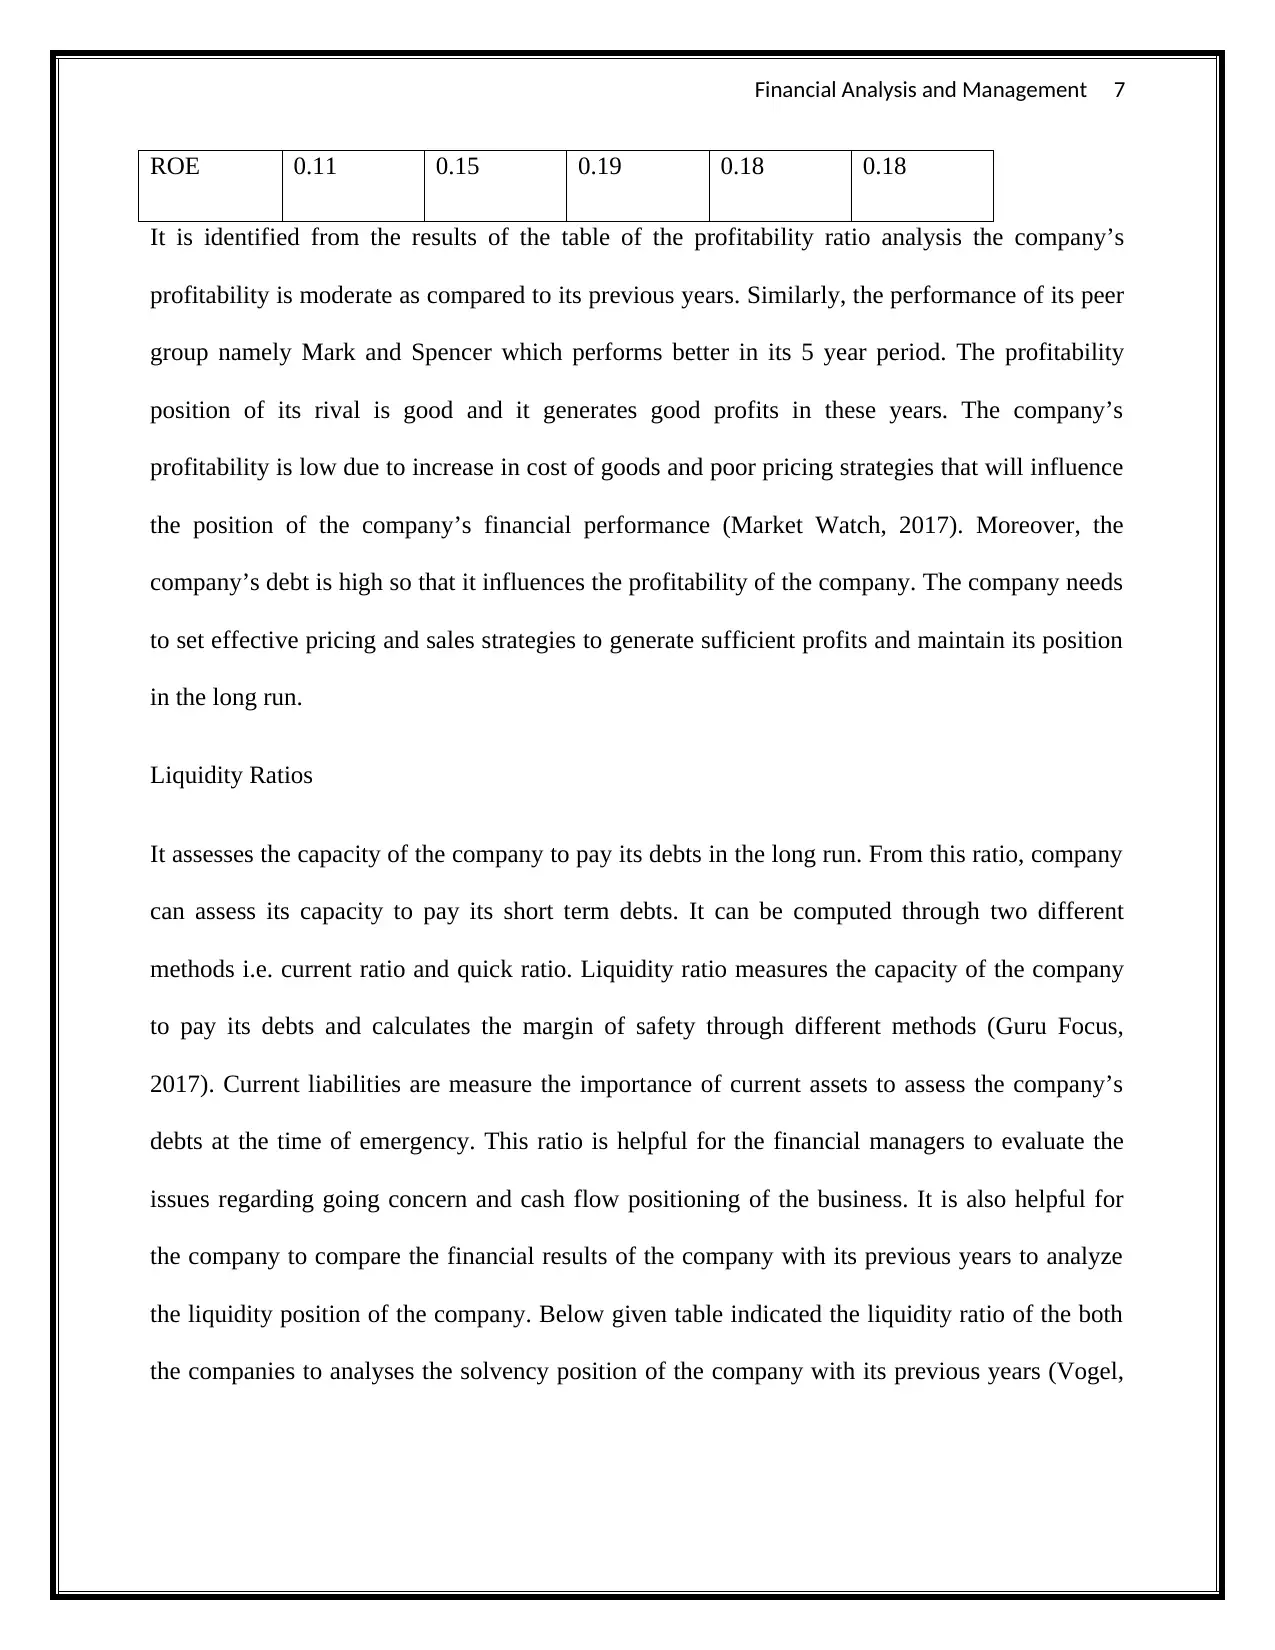
ROE 0.11 0.15 0.19 0.18 0.18
It is identified from the results of the table of the profitability ratio analysis the company’s
profitability is moderate as compared to its previous years. Similarly, the performance of its peer
group namely Mark and Spencer which performs better in its 5 year period. The profitability
position of its rival is good and it generates good profits in these years. The company’s
profitability is low due to increase in cost of goods and poor pricing strategies that will influence
the position of the company’s financial performance (Market Watch, 2017). Moreover, the
company’s debt is high so that it influences the profitability of the company. The company needs
to set effective pricing and sales strategies to generate sufficient profits and maintain its position
in the long run.
Liquidity Ratios
It assesses the capacity of the company to pay its debts in the long run. From this ratio, company
can assess its capacity to pay its short term debts. It can be computed through two different
methods i.e. current ratio and quick ratio. Liquidity ratio measures the capacity of the company
to pay its debts and calculates the margin of safety through different methods (Guru Focus,
2017). Current liabilities are measure the importance of current assets to assess the company’s
debts at the time of emergency. This ratio is helpful for the financial managers to evaluate the
issues regarding going concern and cash flow positioning of the business. It is also helpful for
the company to compare the financial results of the company with its previous years to analyze
the liquidity position of the company. Below given table indicated the liquidity ratio of the both
the companies to analyses the solvency position of the company with its previous years (Vogel,
Paraphrase This Document
Need a fresh take? Get an instant paraphrase of this document with our AI Paraphraser
Financial Analysis and Management 8
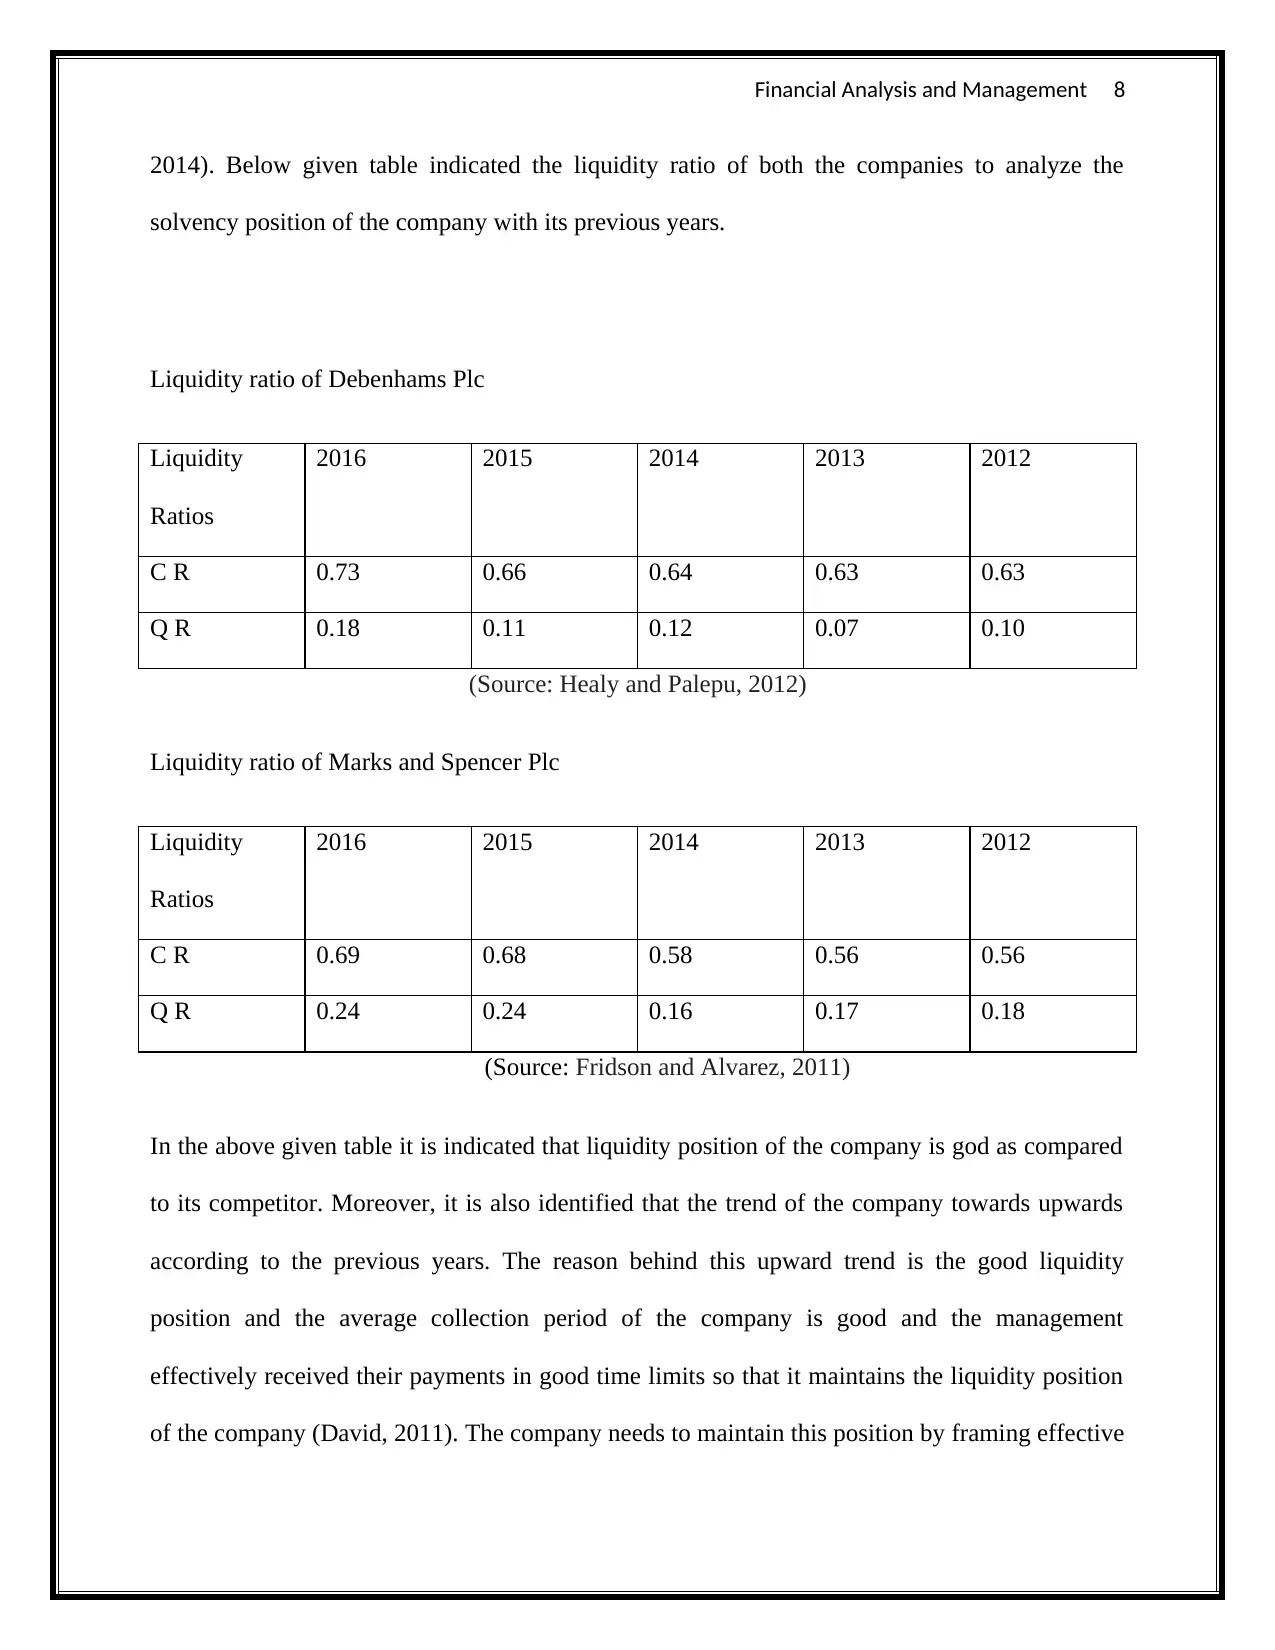
2014). Below given table indicated the liquidity ratio of both the companies to analyze the
solvency position of the company with its previous years.
Liquidity ratio of Debenhams Plc
Liquidity
Ratios
2016 2015 2014 2013 2012
C R 0.73 0.66 0.64 0.63 0.63
Q R 0.18 0.11 0.12 0.07 0.10
(Source: Healy and Palepu, 2012)
Liquidity ratio of Marks and Spencer Plc
Liquidity
Ratios
2016 2015 2014 2013 2012
C R 0.69 0.68 0.58 0.56 0.56
Q R 0.24 0.24 0.16 0.17 0.18
(Source: Fridson and Alvarez, 2011)
In the above given table it is indicated that liquidity position of the company is god as compared
to its competitor. Moreover, it is also identified that the trend of the company towards upwards
according to the previous years. The reason behind this upward trend is the good liquidity
position and the average collection period of the company is good and the management
effectively received their payments in good time limits so that it maintains the liquidity position
of the company (David, 2011). The company needs to maintain this position by framing effective
Financial Analysis and Management 9
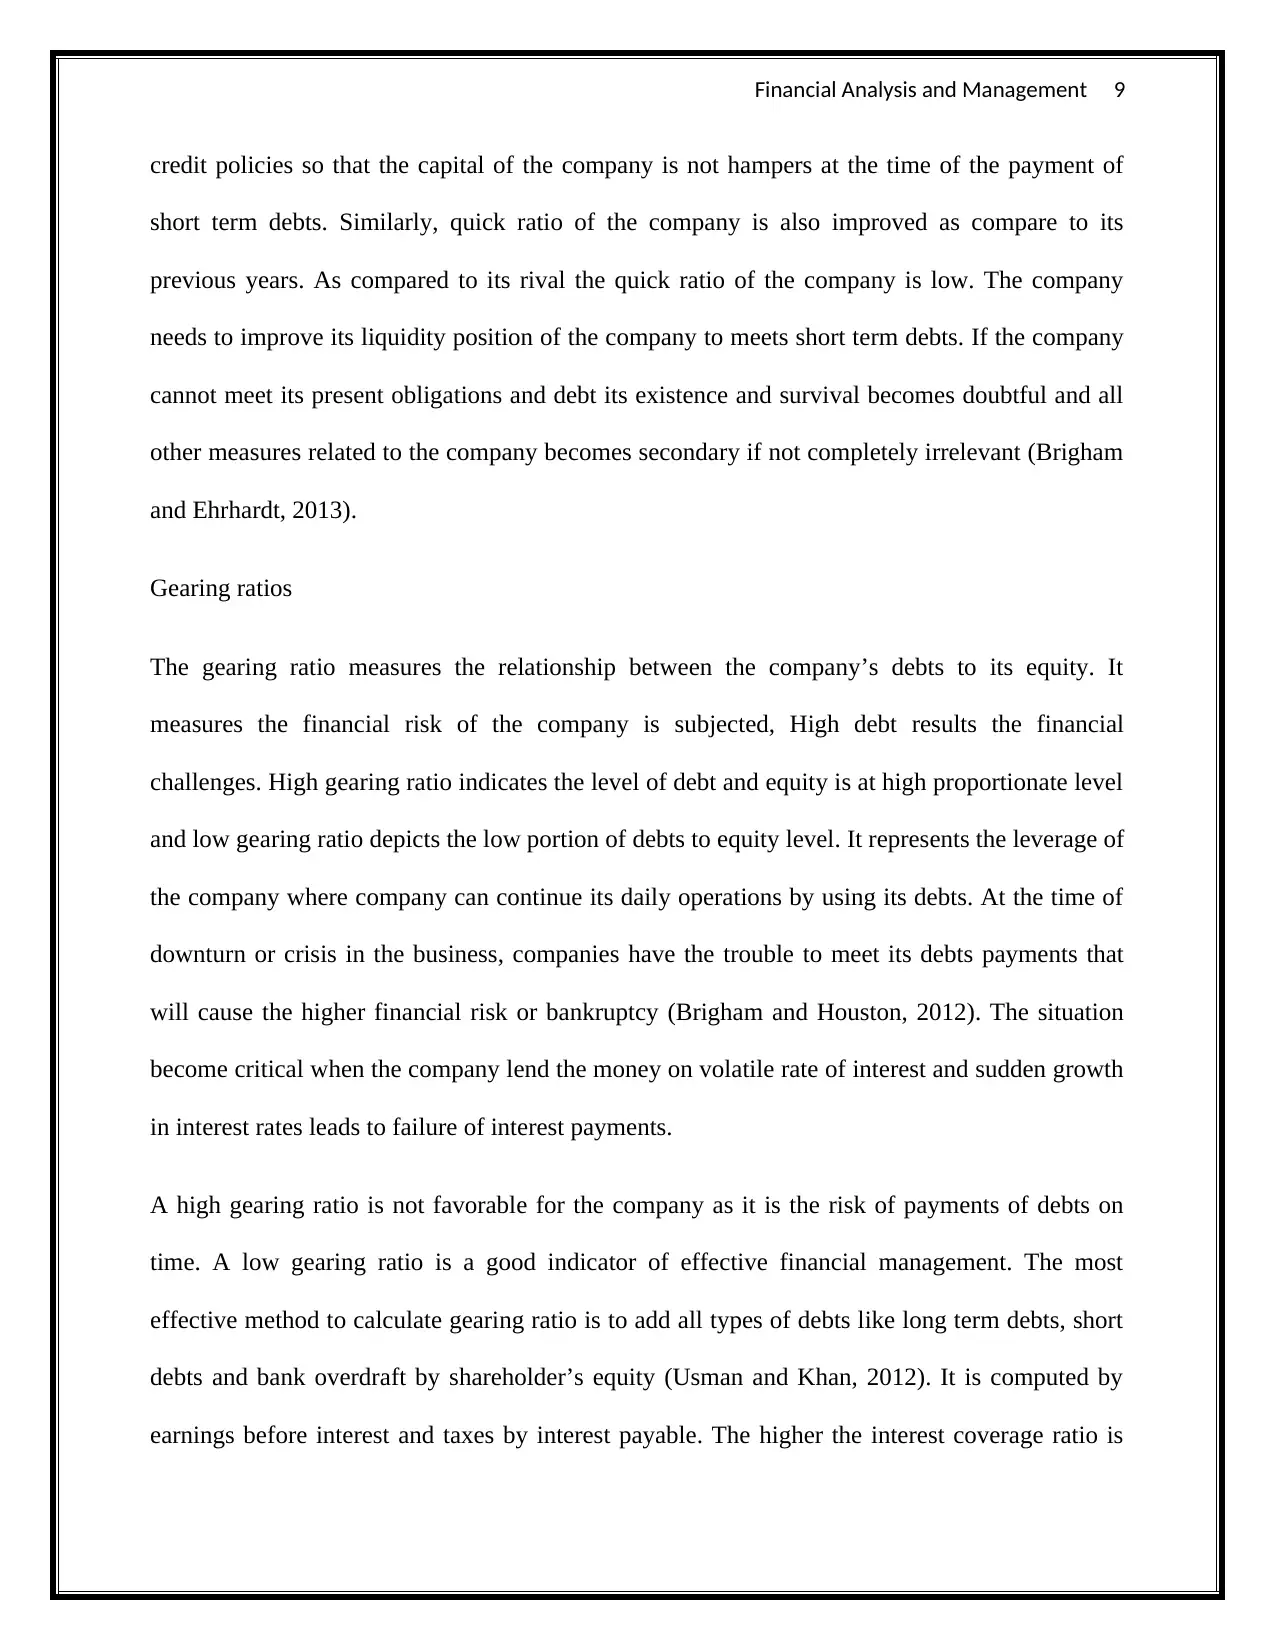
credit policies so that the capital of the company is not hampers at the time of the payment of
short term debts. Similarly, quick ratio of the company is also improved as compare to its
previous years. As compared to its rival the quick ratio of the company is low. The company
needs to improve its liquidity position of the company to meets short term debts. If the company
cannot meet its present obligations and debt its existence and survival becomes doubtful and all
other measures related to the company becomes secondary if not completely irrelevant (Brigham
and Ehrhardt, 2013).
Gearing ratios
The gearing ratio measures the relationship between the company’s debts to its equity. It
measures the financial risk of the company is subjected, High debt results the financial
challenges. High gearing ratio indicates the level of debt and equity is at high proportionate level
and low gearing ratio depicts the low portion of debts to equity level. It represents the leverage of
the company where company can continue its daily operations by using its debts. At the time of
downturn or crisis in the business, companies have the trouble to meet its debts payments that
will cause the higher financial risk or bankruptcy (Brigham and Houston, 2012). The situation
become critical when the company lend the money on volatile rate of interest and sudden growth
in interest rates leads to failure of interest payments.
A high gearing ratio is not favorable for the company as it is the risk of payments of debts on
time. A low gearing ratio is a good indicator of effective financial management. The most
effective method to calculate gearing ratio is to add all types of debts like long term debts, short
debts and bank overdraft by shareholder’s equity (Usman and Khan, 2012). It is computed by
earnings before interest and taxes by interest payable. The higher the interest coverage ratio is
⊘ This is a preview!⊘
Do you want full access?
Subscribe today to unlock all pages.
Trusted by 1+ million students worldwide
Financial Analysis and Management 10
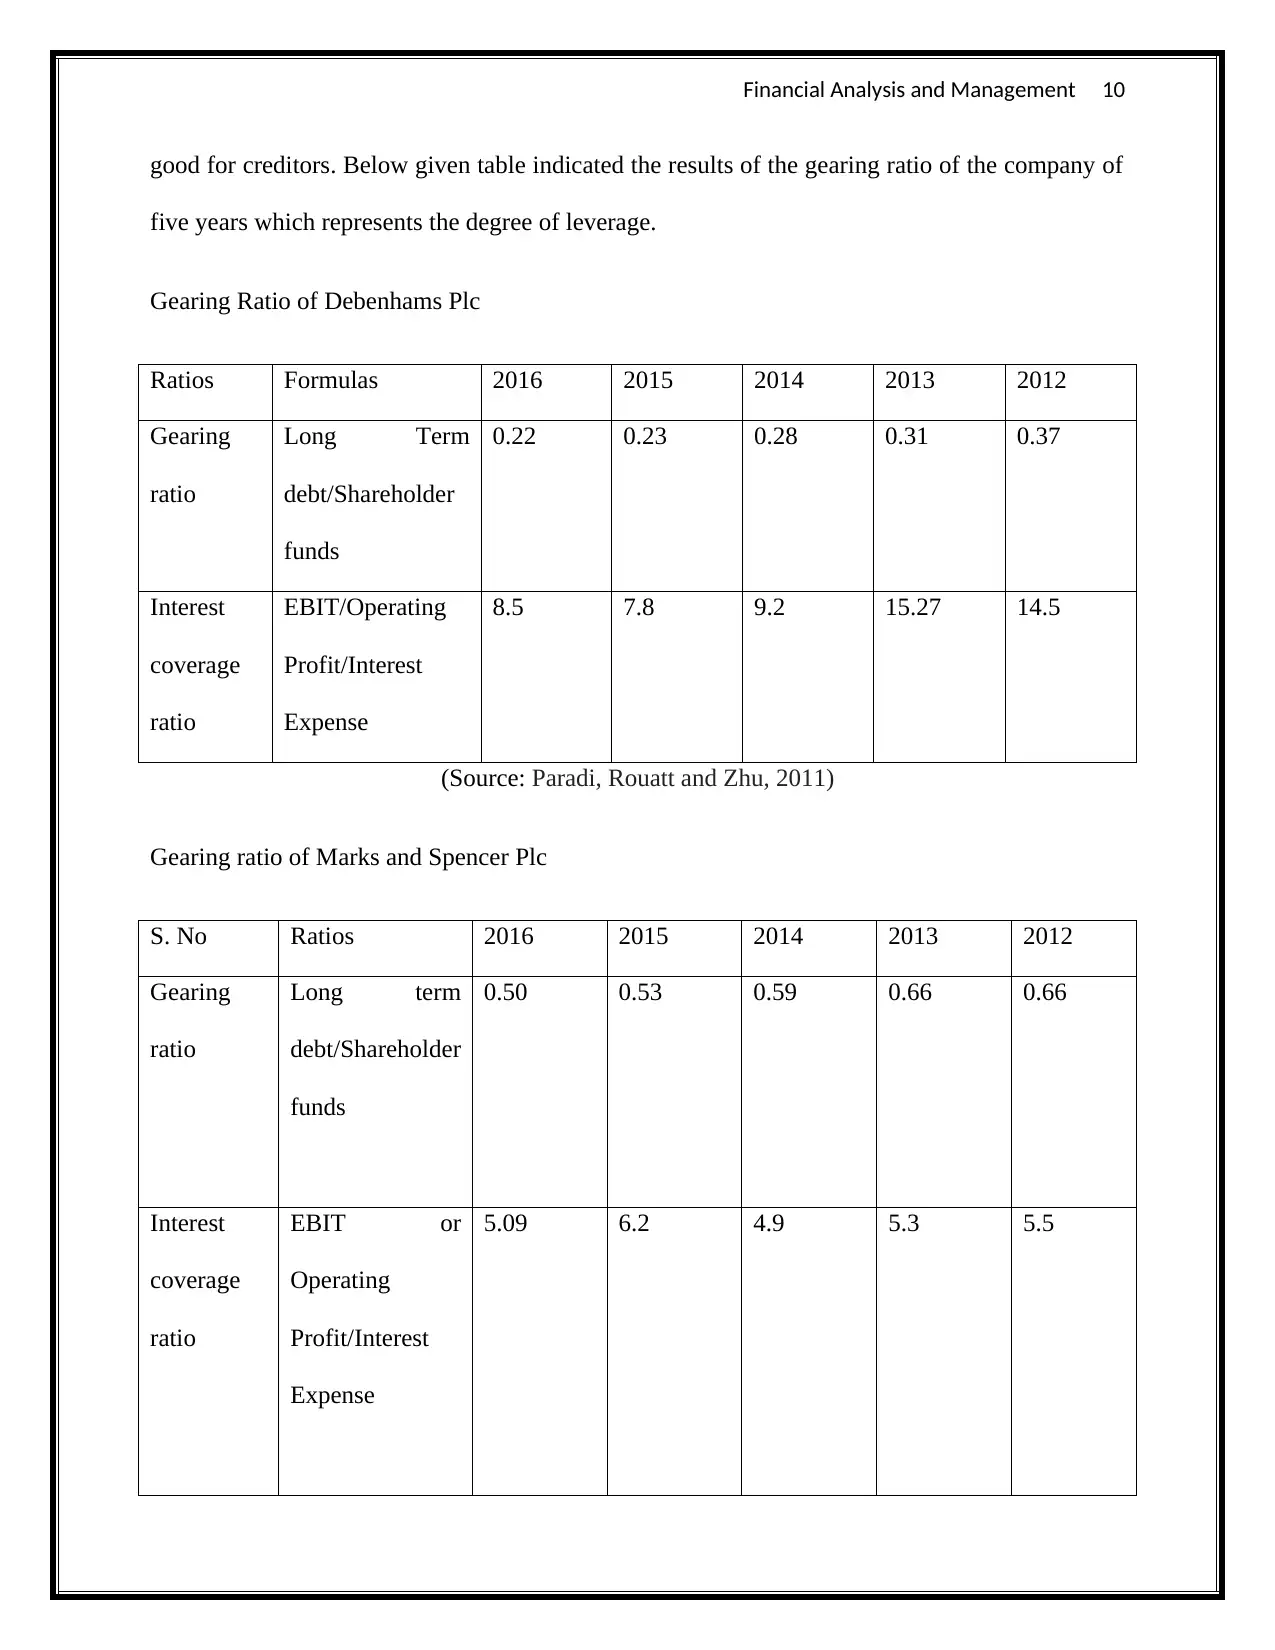
good for creditors. Below given table indicated the results of the gearing ratio of the company of
five years which represents the degree of leverage.
Gearing Ratio of Debenhams Plc
Ratios Formulas 2016 2015 2014 2013 2012
Gearing
ratio
Long Term
debt/Shareholder
funds
0.22 0.23 0.28 0.31 0.37
Interest
coverage
ratio
EBIT/Operating
Profit/Interest
Expense
8.5 7.8 9.2 15.27 14.5
(Source: Paradi, Rouatt and Zhu, 2011)
Gearing ratio of Marks and Spencer Plc
S. No Ratios 2016 2015 2014 2013 2012
Gearing
ratio
Long term
debt/Shareholder
funds
0.50 0.53 0.59 0.66 0.66
Interest
coverage
ratio
EBIT or
Operating
Profit/Interest
Expense
5.09 6.2 4.9 5.3 5.5
Paraphrase This Document
Need a fresh take? Get an instant paraphrase of this document with our AI Paraphraser
Financial Analysis and Management 11
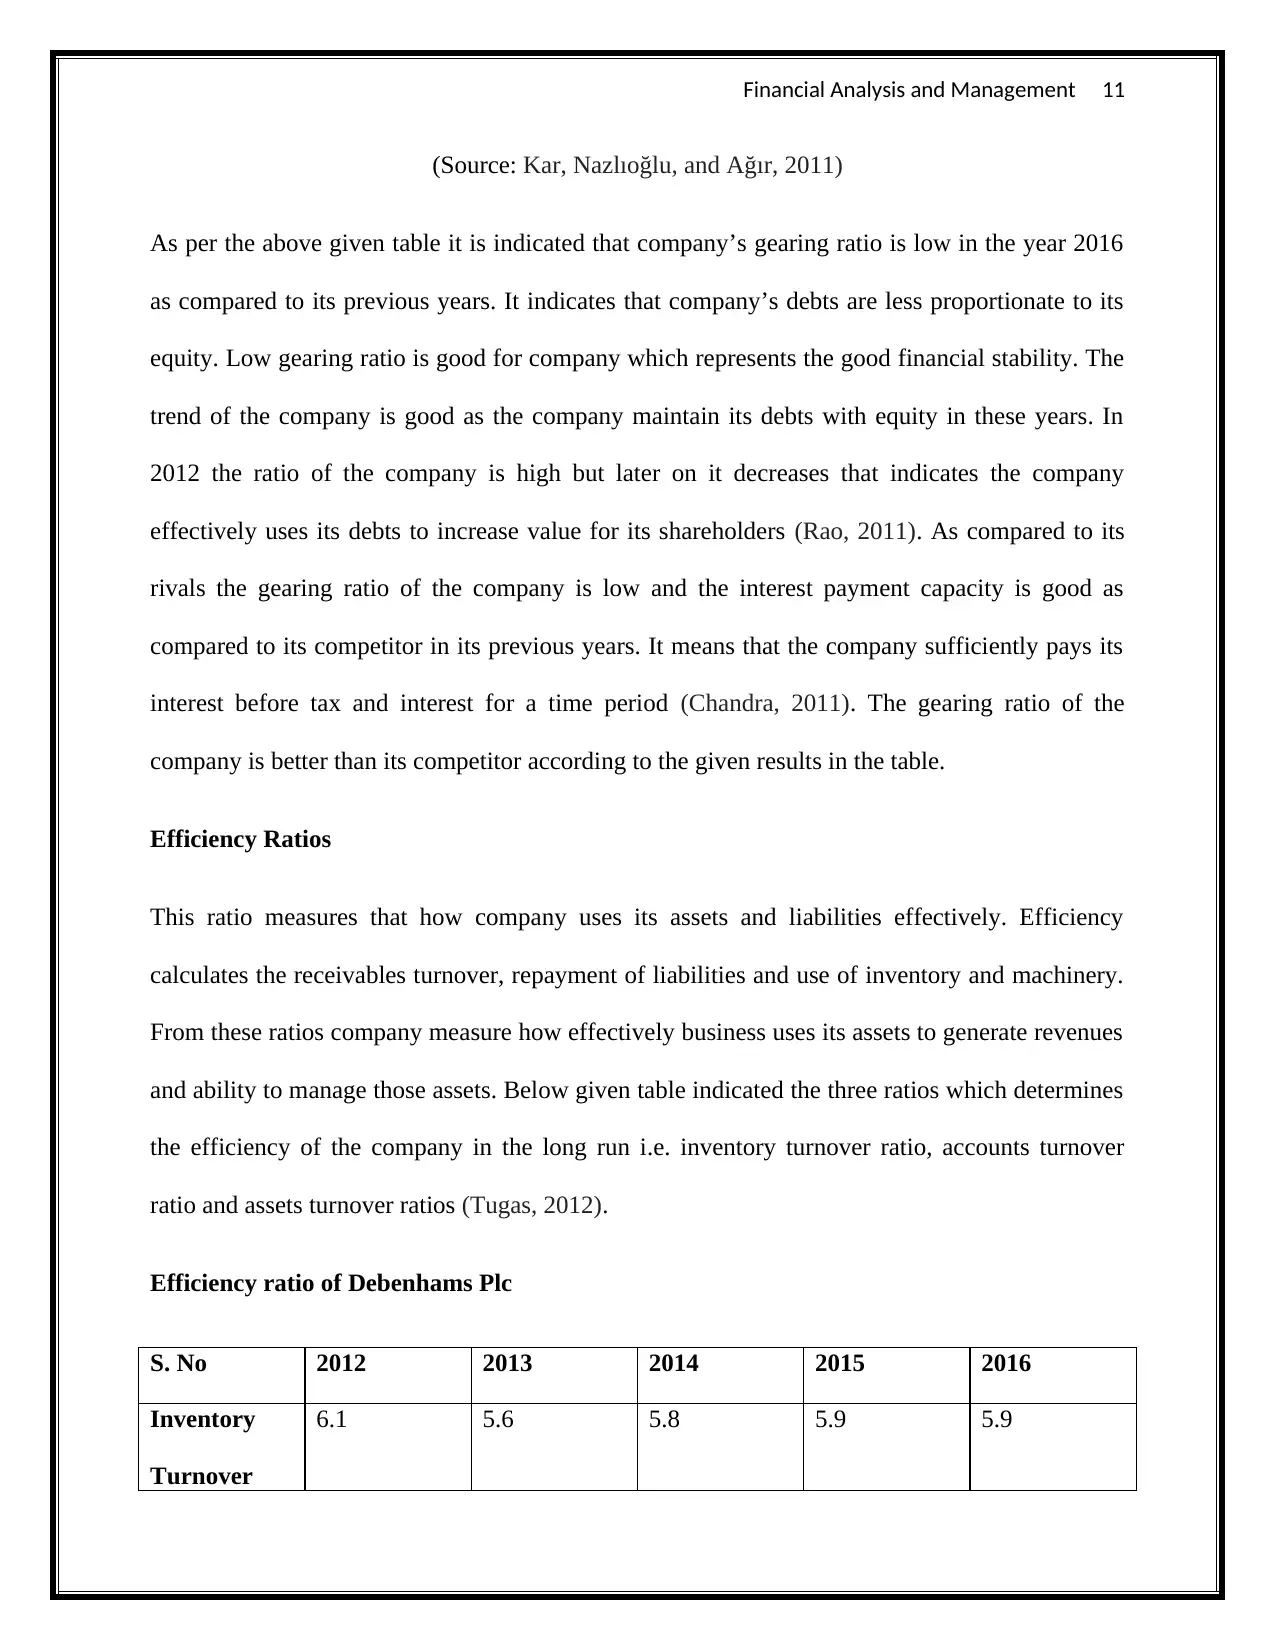
(Source: Kar, Nazlıoğlu, and Ağır, 2011)
As per the above given table it is indicated that company’s gearing ratio is low in the year 2016
as compared to its previous years. It indicates that company’s debts are less proportionate to its
equity. Low gearing ratio is good for company which represents the good financial stability. The
trend of the company is good as the company maintain its debts with equity in these years. In
2012 the ratio of the company is high but later on it decreases that indicates the company
effectively uses its debts to increase value for its shareholders (Rao, 2011). As compared to its
rivals the gearing ratio of the company is low and the interest payment capacity is good as
compared to its competitor in its previous years. It means that the company sufficiently pays its
interest before tax and interest for a time period (Chandra, 2011). The gearing ratio of the
company is better than its competitor according to the given results in the table.
Efficiency Ratios
This ratio measures that how company uses its assets and liabilities effectively. Efficiency
calculates the receivables turnover, repayment of liabilities and use of inventory and machinery.
From these ratios company measure how effectively business uses its assets to generate revenues
and ability to manage those assets. Below given table indicated the three ratios which determines
the efficiency of the company in the long run i.e. inventory turnover ratio, accounts turnover
ratio and assets turnover ratios (Tugas, 2012).
Efficiency ratio of Debenhams Plc
S. No 2012 2013 2014 2015 2016
Inventory
Turnover
6.1 5.6 5.8 5.9 5.9
Financial Analysis and Management 12
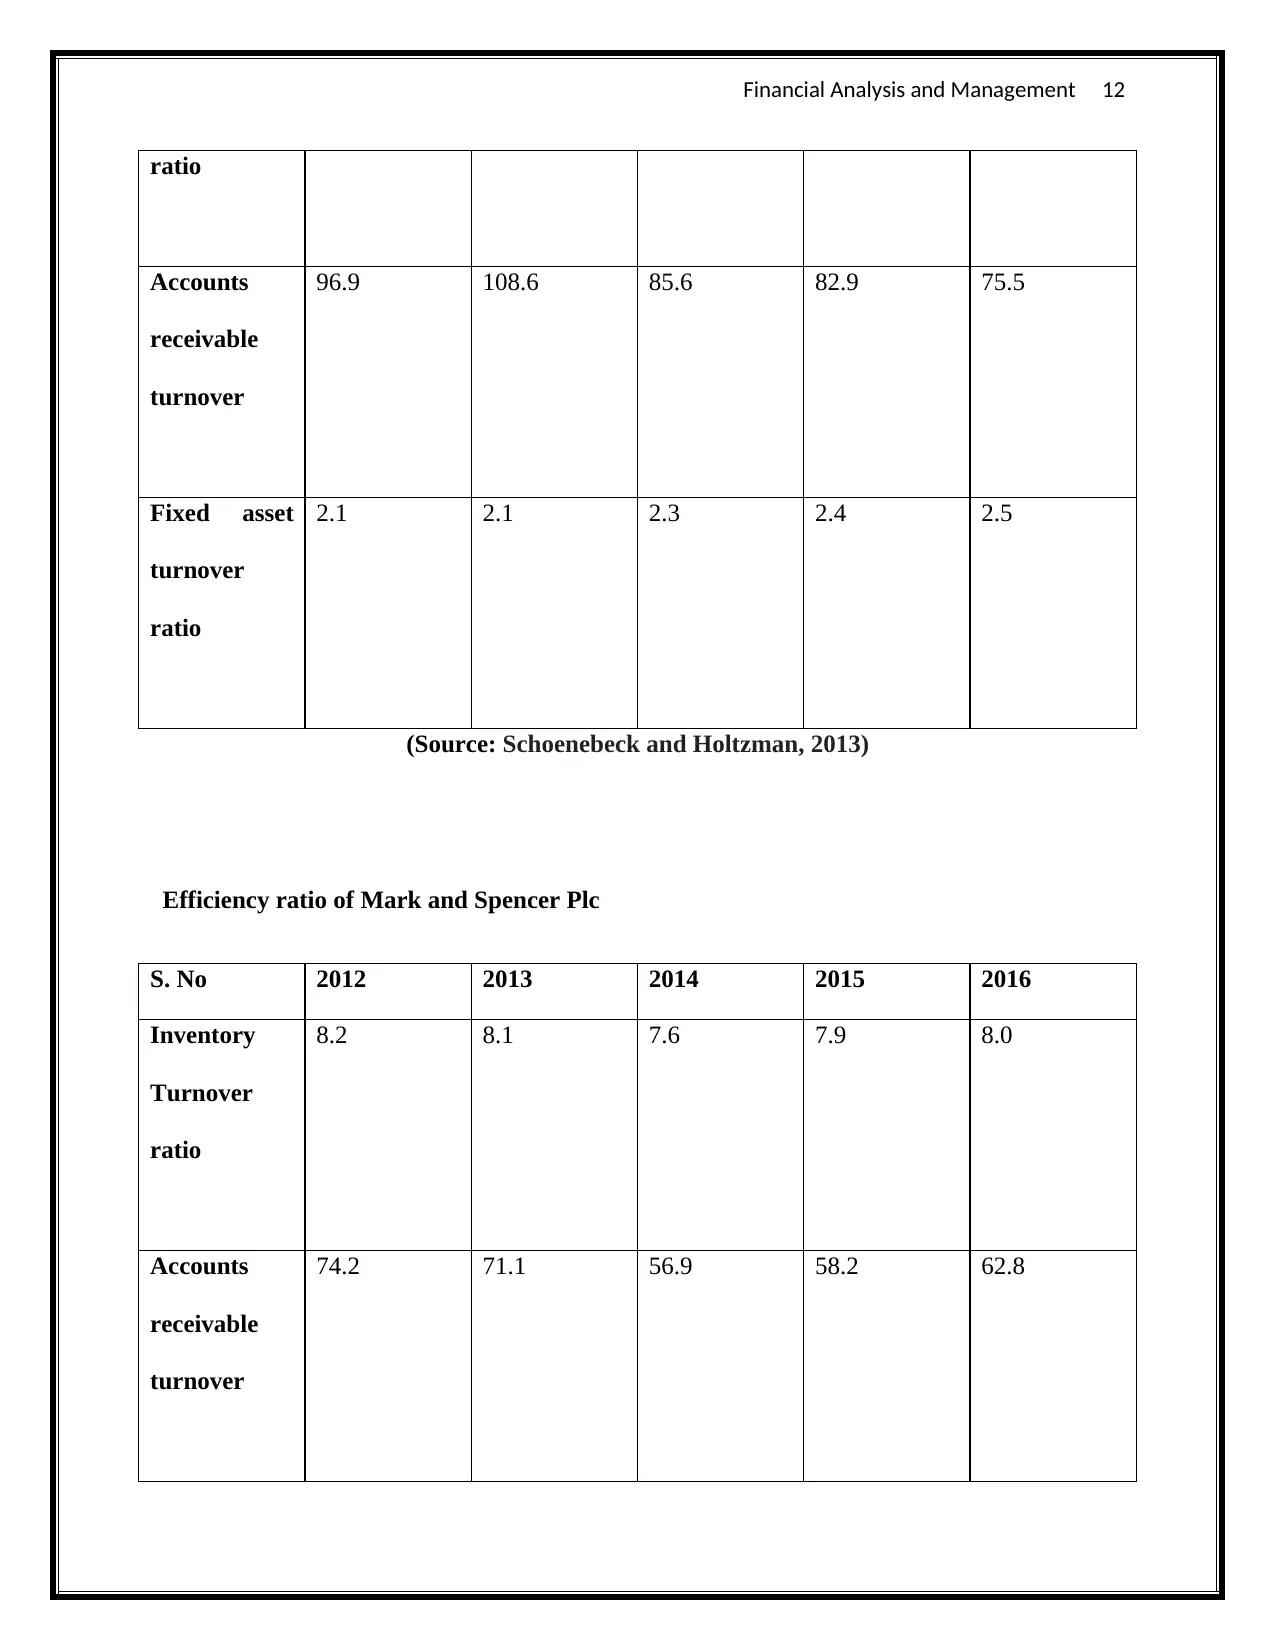
ratio
Accounts
receivable
turnover
96.9 108.6 85.6 82.9 75.5
Fixed asset
turnover
ratio
2.1 2.1 2.3 2.4 2.5
(Source: Schoenebeck and Holtzman, 2013)
Efficiency ratio of Mark and Spencer Plc
S. No 2012 2013 2014 2015 2016
Inventory
Turnover
ratio
8.2 8.1 7.6 7.9 8.0
Accounts
receivable
turnover
74.2 71.1 56.9 58.2 62.8
ratio
Accounts
receivable
turnover
96.9 108.6 85.6 82.9 75.5
Fixed asset
turnover
ratio
2.1 2.1 2.3 2.4 2.5
(Source: Schoenebeck and Holtzman, 2013)
Efficiency ratio of Mark and Spencer Plc
S. No 2012 2013 2014 2015 2016
Inventory
Turnover
ratio
8.2 8.1 7.6 7.9 8.0
Accounts
receivable
turnover
74.2 71.1 56.9 58.2 62.8
⊘ This is a preview!⊘
Do you want full access?
Subscribe today to unlock all pages.
Trusted by 1+ million students worldwide
1 out of 27
Related Documents


Your All-in-One AI-Powered Toolkit for Academic Success.
+13062052269
info@desklib.com
Available 24*7 on WhatsApp / Email
![[object Object]](/_next/static/media/star-bottom.7253800d.svg)
Unlock your academic potential
Copyright © 2020–2026 A2Z Services. All Rights Reserved. Developed and managed by ZUCOL.