B-520 Report: Brand Value and Financial Performance of Dhaka Bank Ltd
VerifiedAdded on 2022/07/08
|13
|3465
|32
Report
AI Summary
This report presents a comprehensive analysis of Dhaka Bank Limited's financial performance over a decade, spanning from 2011 to 2020. The study meticulously examines key financial indicators, including interest income, net interest income, investment income, net profit after tax, and earnings per share. The methodology employed involves quantitative analysis, utilizing secondary data sourced from Dhaka Bank's annual reports. The report delves into trend analysis, providing insights into the bank's performance trajectory. The analysis reveals fluctuations in financial metrics, with notable trends and factors influencing performance highlighted. The findings emphasize the significance of investment income as a crucial element of Dhaka Bank's overall financial health. The report concludes with recommendations and a summary of the bank's performance, acknowledging the challenges posed by the global pandemic. The report is a valuable resource for students and researchers interested in understanding the financial dynamics of Dhaka Bank Limited.
Course Code: B-520
Submitted to
Mohammad Ariful Islam
Associate Professor
Department of Banking and Insurance
Faculty of Business Studies
University of Dhaka
A Report on
“Brand Value Financial Performance-Dhaka Bank
Limited”
Submitted by
Group-15
ID-22-012: Nadira Hamid Jannat
ID-22-112: Pallab Banik
ID-22-114: Auntu Das
ID-22-240: Tasrina Akter Jery
Date of Submission: 2nd March,2022
Paraphrase This Document
Need a fresh take? Get an instant paraphrase of this document with our AI Paraphraser
Table of Content
No. Topic Page
Executive Summary 01
Chapter1.0- Introduction 02
1.01 Statement of the topic 02
1.02 Objective of the study 02
1.03 Scope of the study 02
1.04 Limitations of the Study 02
Chapter 2.0 - Methodology 03
2.01 Methods used in Data Analysis 03
2.02 Explanation of the financial performance indicators 03
Chapter 3.0- Data Analysis 04-08
3.01 Interest Income 04
3.02 Net Interest Income 05
3.03 Investment Income 06
3.04 Net Profit After Tax 07
3.05 Earnings Per Share 08
Chapter 4.0-Findings 09
Chapter 5.0- Recommendation and Conclusion 09
Chapter 6.0- Reference 09
Chapter 7.0- Appendix 10

List of Figures
Figure no. Topic Page
1 Interest Income 04
2 Net Interest Income 05
3 Investment Income 06
4 Net Profit After Tax 07
5 Earnings Per Share 08
Figure no. Topic Page
1 Interest Income 04
2 Net Interest Income 05
3 Investment Income 06
4 Net Profit After Tax 07
5 Earnings Per Share 08
⊘ This is a preview!⊘
Do you want full access?
Subscribe today to unlock all pages.
Trusted by 1+ million students worldwide
1
Executive Summary
The report is basically based on Performance Analysis of Dhaka Bank Limited based on some selected
financial performance indicators. On the first part of this report, we have given the objectives of our report
and the intention of doing this report. On the second part, we have showed the methodology by stating the
sources of data collection and techniques of data analysis. On the third part, we have shown trend analysis
of some selected financial performance indicators- Interest income, Net interest income, Net profit after
tax, Investment Income and Earnings per share. On the fourth part, we have shown the findings of this
report where we found investment income as a crucial factor of Dhaka Bank Limited. On the fifth part, we
have given a possible recommendation and stated a conclusion. At the conclusion part, we have stated that
Dhaka Bank’s performance is good. They maintained good performance even at the time of global
pandemic and when the full shutdown was going on. At the last part, we have given reference of the report
and appendix where the draft calculation has been showed.
Paraphrase This Document
Need a fresh take? Get an instant paraphrase of this document with our AI Paraphraser
2
1.0 Introduction
1.01 Statement of the topic
Generally, by the word “bank” we can easily understand that the financial institution dealing with money.
The whole scenario of the economy of a country can be ascertained by examining the condition of the
banking sector. Banking sector has a vital role to play in the economic activities and development of any
country. There are different types of banks like Central Banks, Commercial Banks, Savings Banks,
Investment Banks, Industrial Banks, and Co-operative banks etc. But when we use the term “bank” without
any prefix or restriction, it refers to the Commercial Banks. Commercial Banks are the primary contributors
to the economy of a country like Bangladesh. In Bangladesh, the commercial banks are dominating the
financial sector and macroeconomic management largely depends on the performance of the commercial
banks as well as banking sector. Banking grew primarily in the public sector with main emphasis on
restructuring of the financial system and development needs of the war-torn economy with gradual
liberalization in subsequent years. It was increasingly felt that banks should be allowed in the private sector
for giving a fillip to development process on the basis of private initiative. In the 80’s for the first time a
number of banks in the private sector were allowed. Dhaka Bank is one of them. Today the banking concept
is not continuing inside the branches or the cabin of the branches. The bankers are now practicing the non-
cabin banking. The assurance of the availability of the service provider is main factor in bank service. As a
result, it has become essential for every person to have some idea on the bank and banking procedure. In
this report we are going to analyze the performance of Dhaka Bank Limited.
1.02 Objective of the study
In the fulfillment of any work there have to have a goal/objective, this is expected to attain at the end of
any work. This study also has some objectives for the competition of this report. Objectives are given below:
To know about the performance of Dhaka Bank Ltd. in last 10 years
To know what has been the crucial factor of the performance of Dhaka Bank Ltd. in last 10
years
1.03 Scope of the Study
This report is focused on the perspective of Dhaka Bank Ltd. The report has shown the performance of
Dhaka Bank Ltd in last 10 years based some selected financial indicators.
1.04 Limitation of the Study
Limitations that may take place during the preparation of this report are given below:
Up-to-date information may not be available. So inadequate information may be the main
problem of this report.
Time constrain is another main problem of this report. As it is mandatory to finish the
report in given time. So it may not be possible to add more informative data within the due
time.
Last but the not the least is that all data which will be available publicly may not be accurate
all the time.
3
2.0 Methodology
To complete the study only quantitative analysis has been done. For completing this study only
secondary source has been used. In this case the annual reports of Dhaka Bank Limited from 2011-
2020 have been used.
2.01 Methods used in Data analysis
For completing quantitative the research, we have selected some financial performance indicators for doing
trend analysis. By the trend analysis we have figured out how was the bank’s performance in last ten years.
2.02 Explanation of the Financial Performance Indicators
Interest Income: Interest income is the indicator of bank’s profitability. As we know, the major source
of income for banks is the return they get, when they lend. Interest income can be termed as “Income
from operation” or more specifically for banks it is termed as “Interest from Investment”.
Net Interest Income: Net Interest Income is an indicator of measuring banks profitability. It is
calculated as: Net Interest Income= Interest Incomes- Interest Expenses. Here, Interest Income refers
profit on investments. Or profit from lending to borrowers. On the other hand, interest expense refers
interest paid on deposit and borrowings etc. Net interest income can be higher if Interest income rises
or interest expenses gets lower.
Investment Income: Investment income is money that someone earns from an increase in the value of
investments. It includes dividends paid on stocks, capital gains derived from property sales and interest
earned on a savings or money market account.
Net Profit After Tax: Net income after taxes (NIAT) is a financial term used to describe a company's
profit after all taxes have been paid.
Earnings Per Share: Earnings per share (EPS) is calculated as a company's profit divided by the
outstanding shares of its common stock. The resulting number serves as an indicator of a company's
profitability. It is common for a company to report EPS that is adjusted for extraordinary items and
potential share dilution. It is calculated by :(Net Income- Dividend for Preferred Stock)/ Average
Outstanding Shares.
⊘ This is a preview!⊘
Do you want full access?
Subscribe today to unlock all pages.
Trusted by 1+ million students worldwide
4
3.0 Data Analysis
On this part of this part, we will analyze some selected financial performance indicators of Dhaka Bank
Ltd. to know their performance of last 10 years by using trend analysis method.
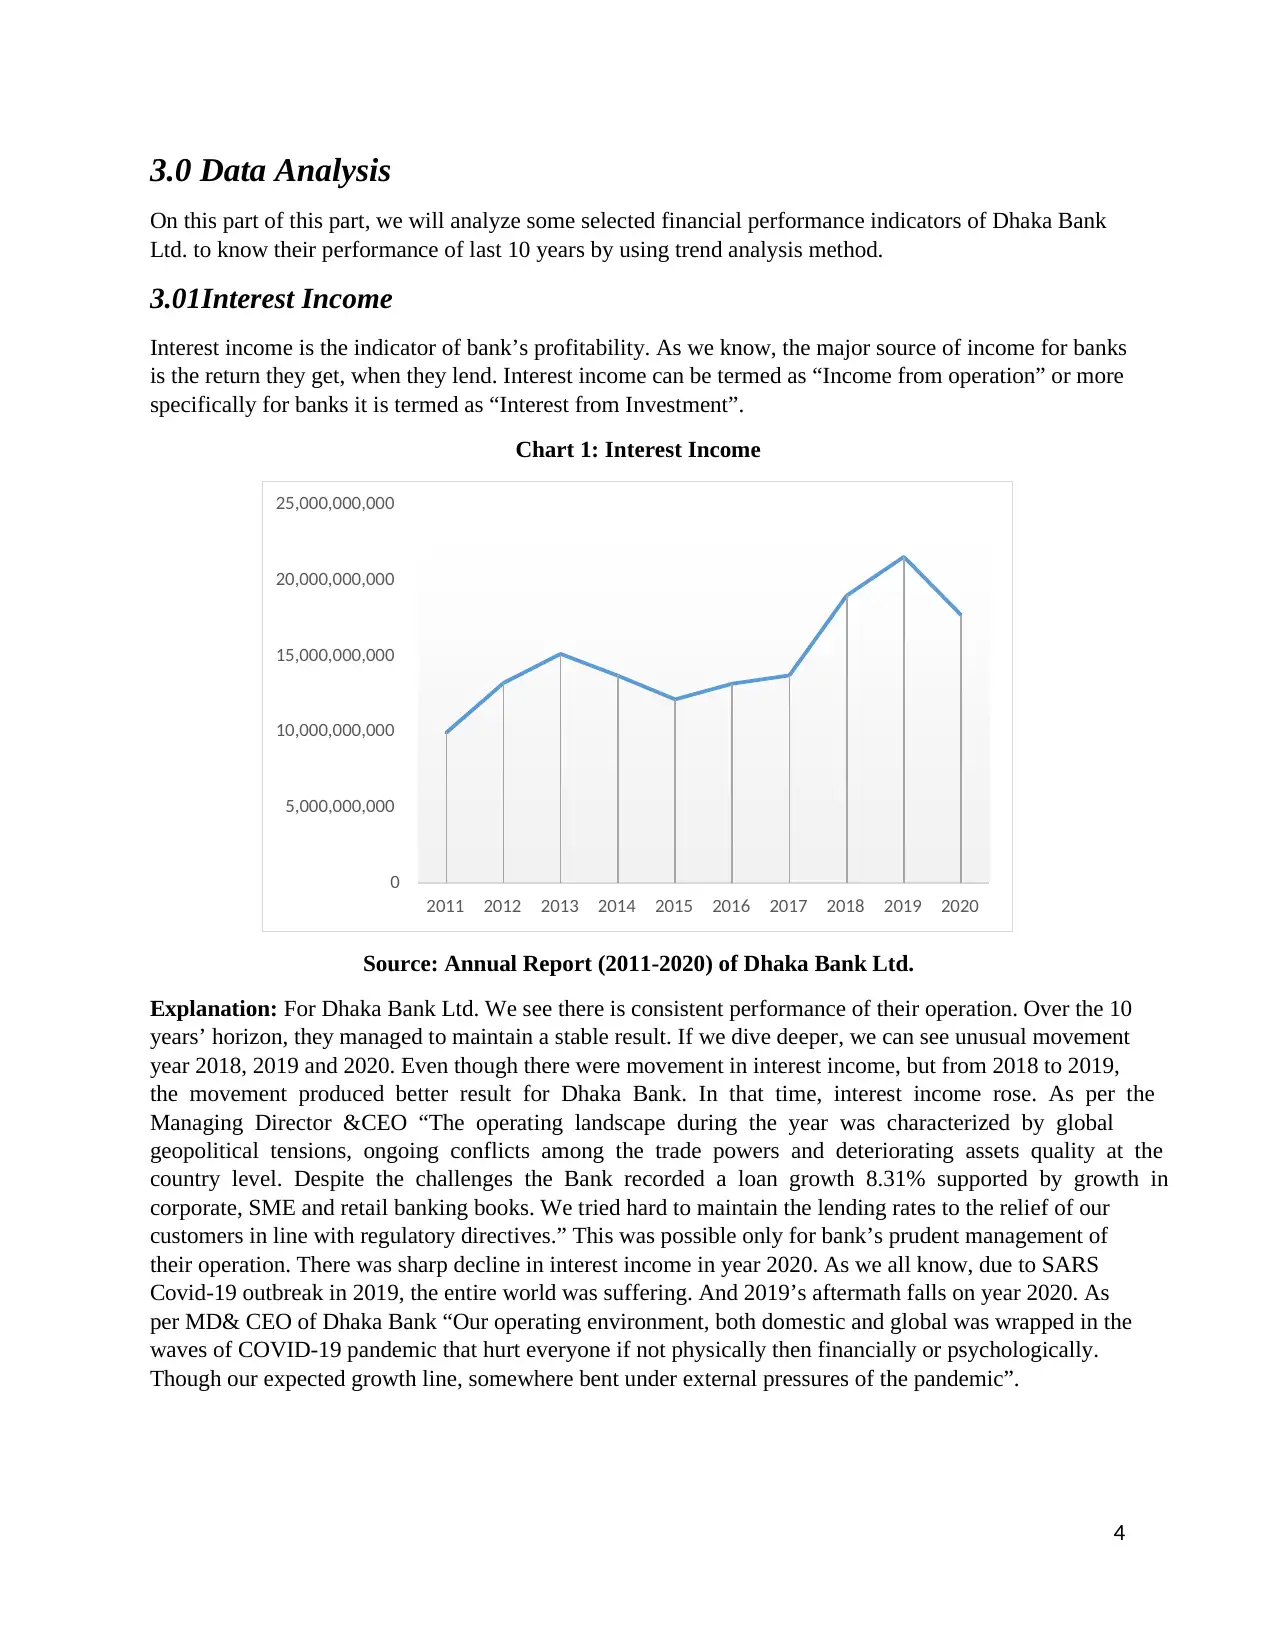
3.01Interest Income
Interest income is the indicator of bank’s profitability. As we know, the major source of income for banks
is the return they get, when they lend. Interest income can be termed as “Income from operation” or more
specifically for banks it is termed as “Interest from Investment”.
Chart 1: Interest Income
Source: Annual Report (2011-2020) of Dhaka Bank Ltd.
Explanation: For Dhaka Bank Ltd. We see there is consistent performance of their operation. Over the 10
years’ horizon, they managed to maintain a stable result. If we dive deeper, we can see unusual movement
year 2018, 2019 and 2020. Even though there were movement in interest income, but from 2018 to 2019,
the movement produced better result for Dhaka Bank. In that time, interest income rose. As per the
Managing Director &CEO “The operating landscape during the year was characterized by global
geopolitical tensions, ongoing conflicts among the trade powers and deteriorating assets quality at the
country level. Despite the challenges the Bank recorded a loan growth 8.31% supported by growth in
corporate, SME and retail banking books. We tried hard to maintain the lending rates to the relief of our
customers in line with regulatory directives.” This was possible only for bank’s prudent management of
their operation. There was sharp decline in interest income in year 2020. As we all know, due to SARS
Covid-19 outbreak in 2019, the entire world was suffering. And 2019’s aftermath falls on year 2020. As
per MD& CEO of Dhaka Bank “Our operating environment, both domestic and global was wrapped in the
waves of COVID-19 pandemic that hurt everyone if not physically then financially or psychologically.
Though our expected growth line, somewhere bent under external pressures of the pandemic”.
0
5,000,000,000
10,000,000,000
15,000,000,000
20,000,000,000
25,000,000,000
2011 2012 2013 2014 2015 2016 2017 2018 2019 2020
3.0 Data Analysis
On this part of this part, we will analyze some selected financial performance indicators of Dhaka Bank
Ltd. to know their performance of last 10 years by using trend analysis method.
3.01Interest Income
Interest income is the indicator of bank’s profitability. As we know, the major source of income for banks
is the return they get, when they lend. Interest income can be termed as “Income from operation” or more
specifically for banks it is termed as “Interest from Investment”.
Chart 1: Interest Income
Source: Annual Report (2011-2020) of Dhaka Bank Ltd.
Explanation: For Dhaka Bank Ltd. We see there is consistent performance of their operation. Over the 10
years’ horizon, they managed to maintain a stable result. If we dive deeper, we can see unusual movement
year 2018, 2019 and 2020. Even though there were movement in interest income, but from 2018 to 2019,
the movement produced better result for Dhaka Bank. In that time, interest income rose. As per the
Managing Director &CEO “The operating landscape during the year was characterized by global
geopolitical tensions, ongoing conflicts among the trade powers and deteriorating assets quality at the
country level. Despite the challenges the Bank recorded a loan growth 8.31% supported by growth in
corporate, SME and retail banking books. We tried hard to maintain the lending rates to the relief of our
customers in line with regulatory directives.” This was possible only for bank’s prudent management of
their operation. There was sharp decline in interest income in year 2020. As we all know, due to SARS
Covid-19 outbreak in 2019, the entire world was suffering. And 2019’s aftermath falls on year 2020. As
per MD& CEO of Dhaka Bank “Our operating environment, both domestic and global was wrapped in the
waves of COVID-19 pandemic that hurt everyone if not physically then financially or psychologically.
Though our expected growth line, somewhere bent under external pressures of the pandemic”.
0
5,000,000,000
10,000,000,000
15,000,000,000
20,000,000,000
25,000,000,000
2011 2012 2013 2014 2015 2016 2017 2018 2019 2020
Paraphrase This Document
Need a fresh take? Get an instant paraphrase of this document with our AI Paraphraser
5
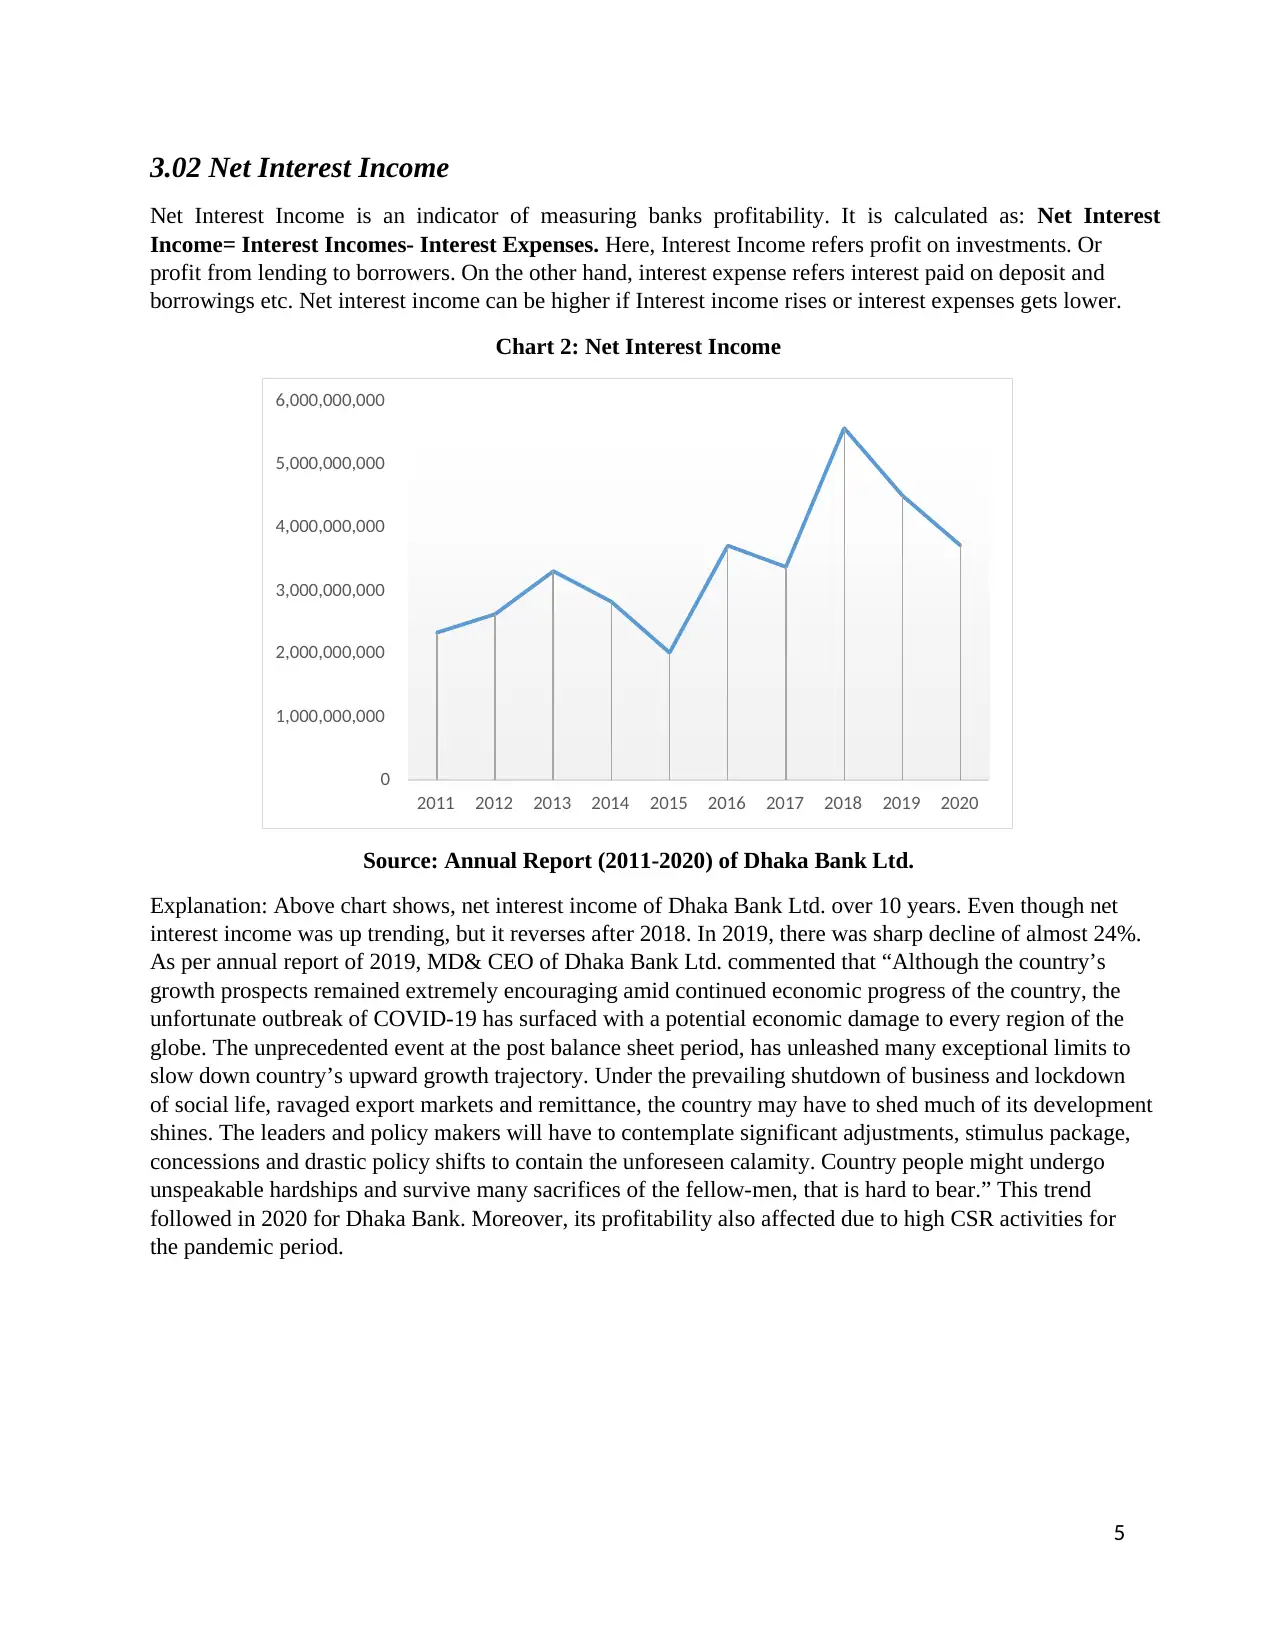
3.02 Net Interest Income
Net Interest Income is an indicator of measuring banks profitability. It is calculated as: Net Interest
Income= Interest Incomes- Interest Expenses. Here, Interest Income refers profit on investments. Or
profit from lending to borrowers. On the other hand, interest expense refers interest paid on deposit and
borrowings etc. Net interest income can be higher if Interest income rises or interest expenses gets lower.
Chart 2: Net Interest Income
Source: Annual Report (2011-2020) of Dhaka Bank Ltd.
Explanation: Above chart shows, net interest income of Dhaka Bank Ltd. over 10 years. Even though net
interest income was up trending, but it reverses after 2018. In 2019, there was sharp decline of almost 24%.
As per annual report of 2019, MD& CEO of Dhaka Bank Ltd. commented that “Although the country’s
growth prospects remained extremely encouraging amid continued economic progress of the country, the
unfortunate outbreak of COVID-19 has surfaced with a potential economic damage to every region of the
globe. The unprecedented event at the post balance sheet period, has unleashed many exceptional limits to
slow down country’s upward growth trajectory. Under the prevailing shutdown of business and lockdown
of social life, ravaged export markets and remittance, the country may have to shed much of its development
shines. The leaders and policy makers will have to contemplate significant adjustments, stimulus package,
concessions and drastic policy shifts to contain the unforeseen calamity. Country people might undergo
unspeakable hardships and survive many sacrifices of the fellow-men, that is hard to bear.” This trend
followed in 2020 for Dhaka Bank. Moreover, its profitability also affected due to high CSR activities for
the pandemic period.
0
1,000,000,000
2,000,000,000
3,000,000,000
4,000,000,000
5,000,000,000
6,000,000,000
2011 2012 2013 2014 2015 2016 2017 2018 2019 2020
6
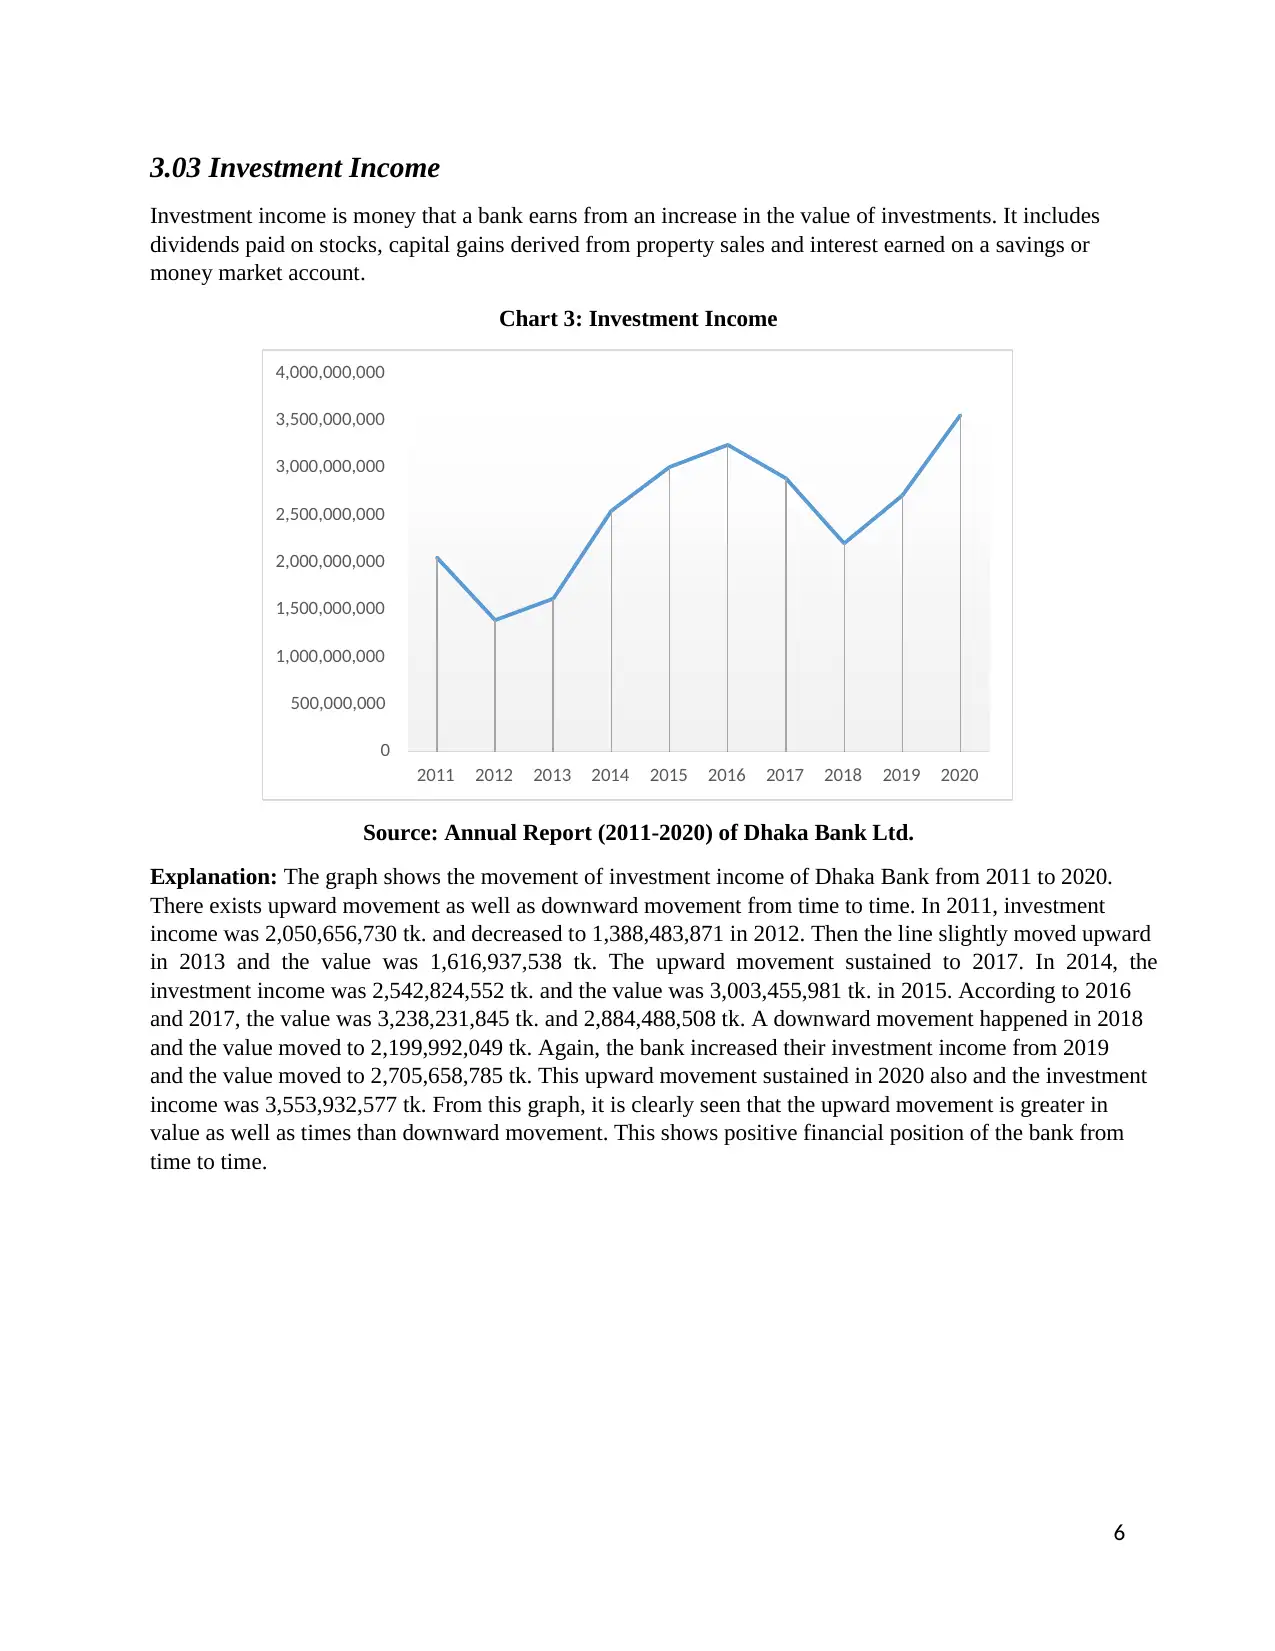
3.03 Investment Income
Investment income is money that a bank earns from an increase in the value of investments. It includes
dividends paid on stocks, capital gains derived from property sales and interest earned on a savings or
money market account.
Chart 3: Investment Income
Source: Annual Report (2011-2020) of Dhaka Bank Ltd.
Explanation: The graph shows the movement of investment income of Dhaka Bank from 2011 to 2020.
There exists upward movement as well as downward movement from time to time. In 2011, investment
income was 2,050,656,730 tk. and decreased to 1,388,483,871 in 2012. Then the line slightly moved upward
in 2013 and the value was 1,616,937,538 tk. The upward movement sustained to 2017. In 2014, the
investment income was 2,542,824,552 tk. and the value was 3,003,455,981 tk. in 2015. According to 2016
and 2017, the value was 3,238,231,845 tk. and 2,884,488,508 tk. A downward movement happened in 2018
and the value moved to 2,199,992,049 tk. Again, the bank increased their investment income from 2019
and the value moved to 2,705,658,785 tk. This upward movement sustained in 2020 also and the investment
income was 3,553,932,577 tk. From this graph, it is clearly seen that the upward movement is greater in
value as well as times than downward movement. This shows positive financial position of the bank from
time to time.
0
500,000,000
1,000,000,000
1,500,000,000
2,000,000,000
2,500,000,000
3,000,000,000
3,500,000,000
4,000,000,000
2011 2012 2013 2014 2015 2016 2017 2018 2019 2020
⊘ This is a preview!⊘
Do you want full access?
Subscribe today to unlock all pages.
Trusted by 1+ million students worldwide
7
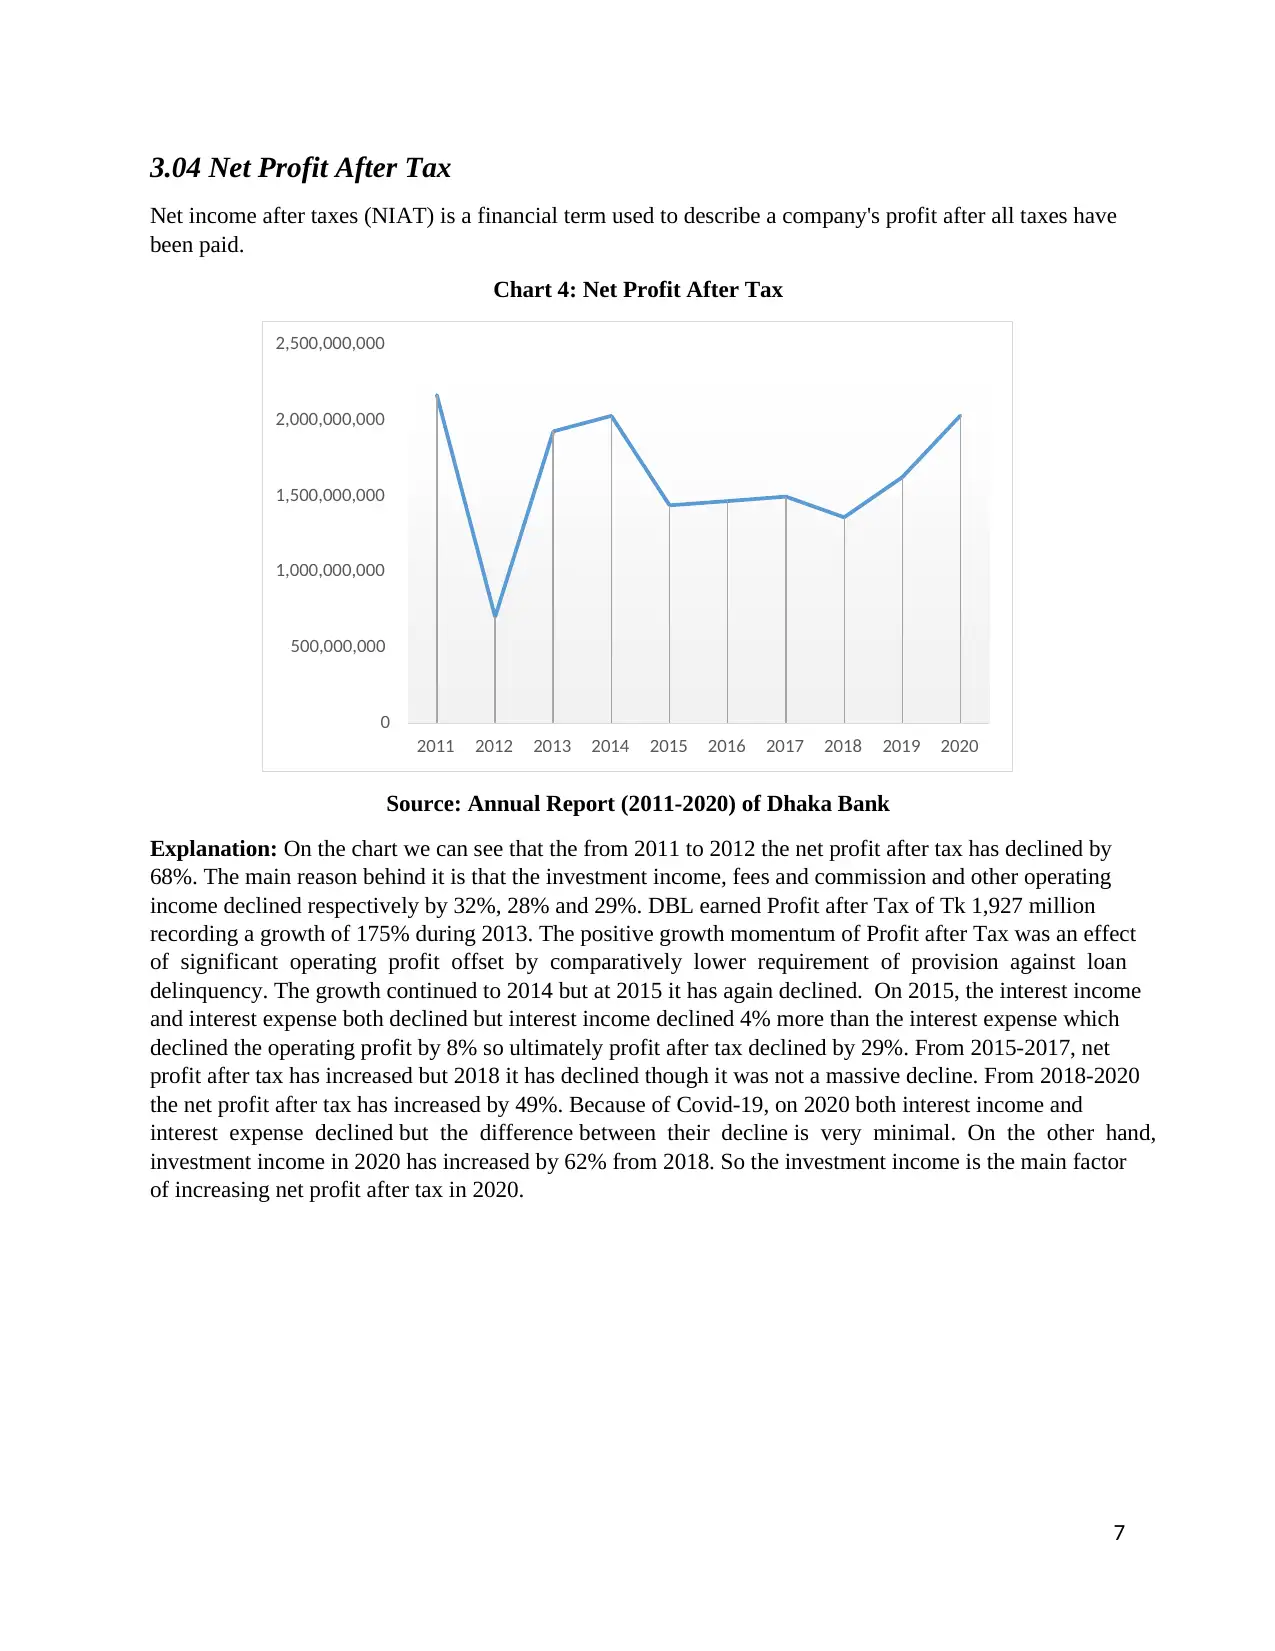
3.04 Net Profit After Tax
Net income after taxes (NIAT) is a financial term used to describe a company's profit after all taxes have
been paid.
Chart 4: Net Profit After Tax
Source: Annual Report (2011-2020) of Dhaka Bank
Explanation: On the chart we can see that the from 2011 to 2012 the net profit after tax has declined by
68%. The main reason behind it is that the investment income, fees and commission and other operating
income declined respectively by 32%, 28% and 29%. DBL earned Profit after Tax of Tk 1,927 million
recording a growth of 175% during 2013. The positive growth momentum of Profit after Tax was an effect
of significant operating profit offset by comparatively lower requirement of provision against loan
delinquency. The growth continued to 2014 but at 2015 it has again declined. On 2015, the interest income
and interest expense both declined but interest income declined 4% more than the interest expense which
declined the operating profit by 8% so ultimately profit after tax declined by 29%. From 2015-2017, net
profit after tax has increased but 2018 it has declined though it was not a massive decline. From 2018-2020
the net profit after tax has increased by 49%. Because of Covid-19, on 2020 both interest income and
interest expense declined but the difference between their decline is very minimal. On the other hand,
investment income in 2020 has increased by 62% from 2018. So the investment income is the main factor
of increasing net profit after tax in 2020.
0
500,000,000
1,000,000,000
1,500,000,000
2,000,000,000
2,500,000,000
2011 2012 2013 2014 2015 2016 2017 2018 2019 2020
Paraphrase This Document
Need a fresh take? Get an instant paraphrase of this document with our AI Paraphraser
8
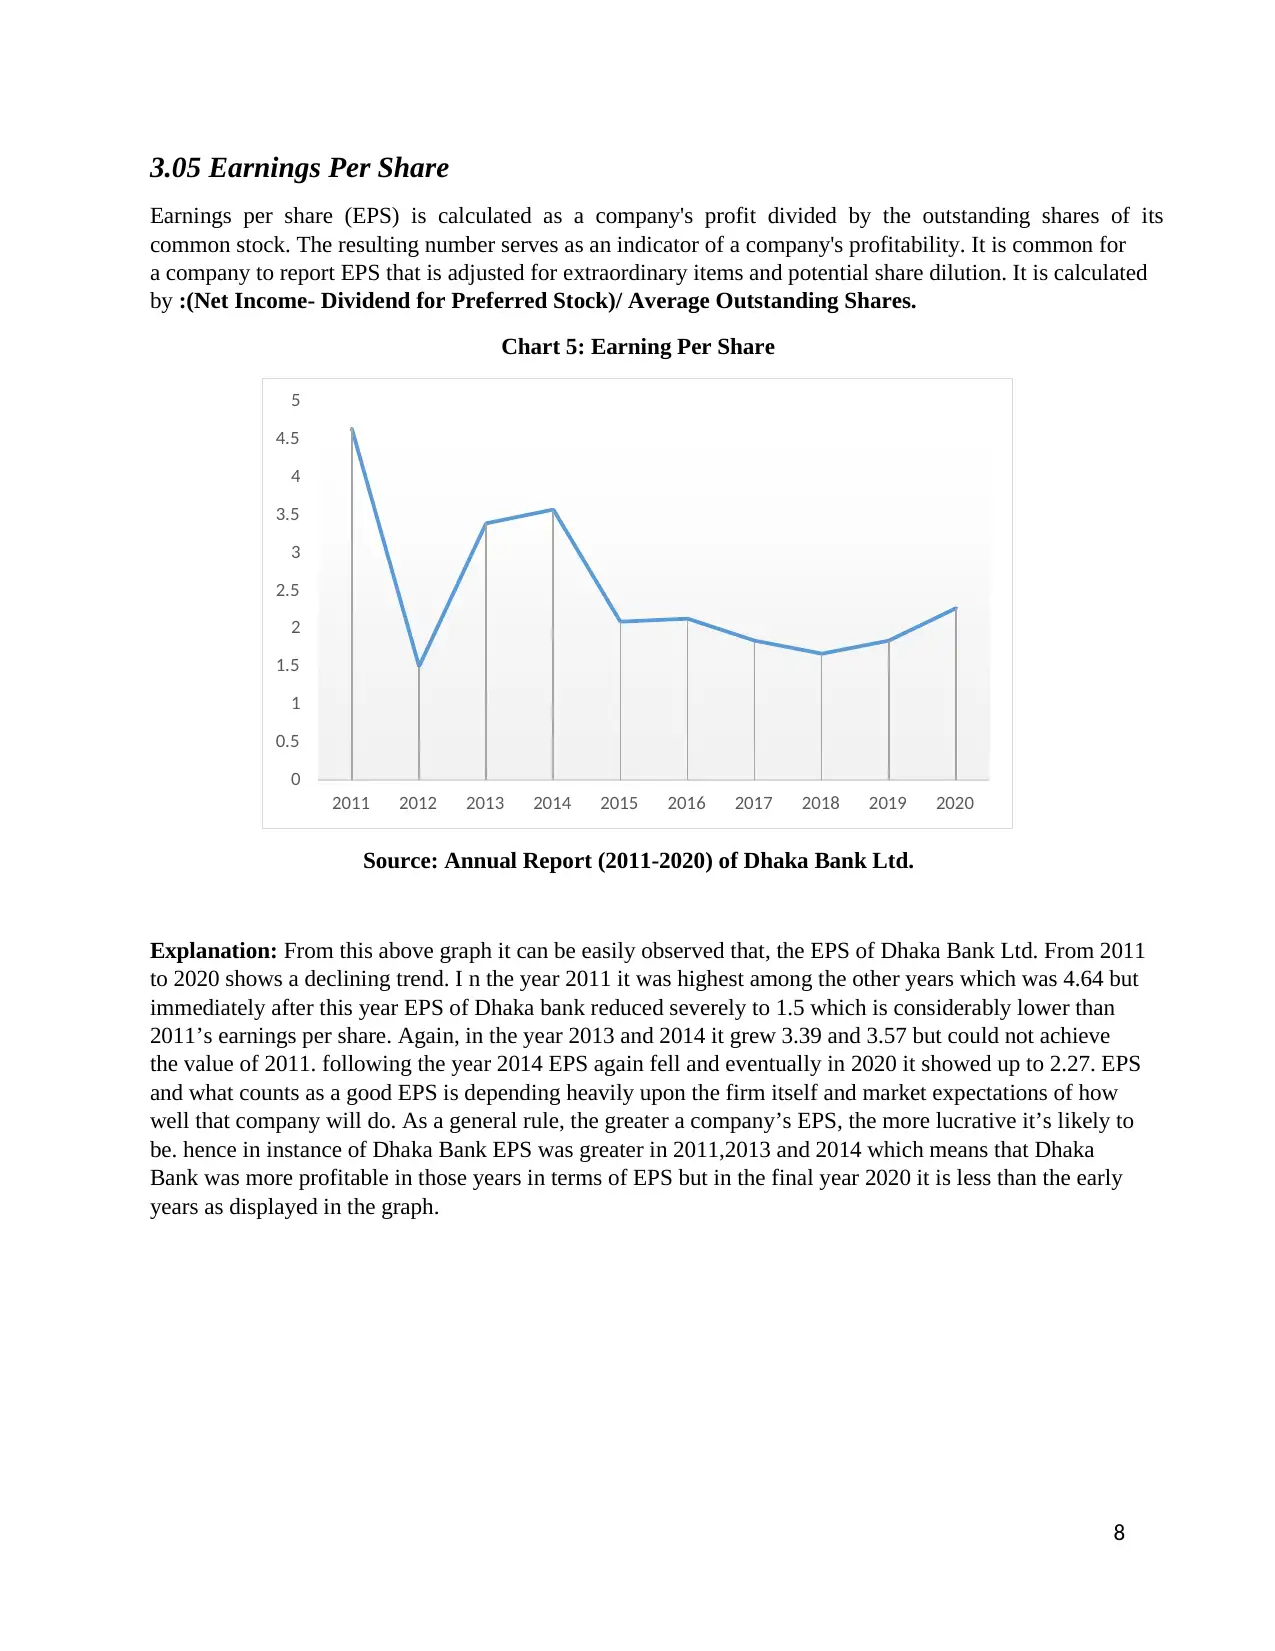
3.05 Earnings Per Share
Earnings per share (EPS) is calculated as a company's profit divided by the outstanding shares of its
common stock. The resulting number serves as an indicator of a company's profitability. It is common for
a company to report EPS that is adjusted for extraordinary items and potential share dilution. It is calculated
by :(Net Income- Dividend for Preferred Stock)/ Average Outstanding Shares.
Chart 5: Earning Per Share
Source: Annual Report (2011-2020) of Dhaka Bank Ltd.
Explanation: From this above graph it can be easily observed that, the EPS of Dhaka Bank Ltd. From 2011
to 2020 shows a declining trend. I n the year 2011 it was highest among the other years which was 4.64 but
immediately after this year EPS of Dhaka bank reduced severely to 1.5 which is considerably lower than
2011’s earnings per share. Again, in the year 2013 and 2014 it grew 3.39 and 3.57 but could not achieve
the value of 2011. following the year 2014 EPS again fell and eventually in 2020 it showed up to 2.27. EPS
and what counts as a good EPS is depending heavily upon the firm itself and market expectations of how
well that company will do. As a general rule, the greater a company’s EPS, the more lucrative it’s likely to
be. hence in instance of Dhaka Bank EPS was greater in 2011,2013 and 2014 which means that Dhaka
Bank was more profitable in those years in terms of EPS but in the final year 2020 it is less than the early
years as displayed in the graph.
0
0.5
1
1.5
2
2.5
3
3.5
4
4.5
5
2011 2012 2013 2014 2015 2016 2017 2018 2019 2020
9
4.0 Findings
From our analysis, we have found out that that investment income has become a crucial financial factor of
Dhaka Bank Ltd.
If we look at the graph of Net profit after tax then we will see that it has declined sharply in 2012, but
during that year interest income and net interest income both have increased, still these did not manage
to increase net profit after tax that is only because of sharp decline in investment income in 2012. On
this year Earning Per Share also declined.
If we look at the graph of Net profit after tax, then we will see that it has increased in 2020 even after
having impact of Covid-19 on the entire economy of the world. During that year interest income and
net interest income both have decreased, still these did not manage to decrease net profit after tax, that
is only because of sharp increase in investment income in 2020. On this year Earning Per Share also
increased.
Net Interest Income and Interest Income have decreased in 2020 after maintaining an increasing trend.
The reason could be the “Single Digit Interest” policy introduced by Bangladesh Bank from
April,2020.
5.0 Recommendation and Conclusion
The investment income is a key factor for Dhaka Bank Ltd, their performance has become mostly dependent
on it. So we can recommend that, the investment plans and strategy of the bank must be strong enough to
make them less vulnerable to risk and to be a better performing bank. At the conclusion we can state that,
at the time of global pandemic, when the entire economy is suffering and when the interest rate spread is
only 3% fixed by Bangladesh Bank, Dhaka Bank Ltd, maintained increasing trend of Investment Income,
Net Profit After Tax and Earning Per Share. This is sign of very good performance by the Bank. People and
Institutions can rely on them in case taking services and investing on them.
6.0 Reference
1. Annual Report Dhaka Bank 2011
2. Annual Report Dhaka Bank 2012
3. Annual Report Dhaka Bank 2013
4. Annual Report Dhaka Bank 2014
5. Annual Report Dhaka Bank 2015
6. Annual Report Dhaka Bank 2016
7. Annual Report Dhaka Bank 2017
8. Annual Report Dhaka Bank 2018
9. Annual Report Dhaka Bank 2019
10. Annual Report Dhaka Bank 2020
⊘ This is a preview!⊘
Do you want full access?
Subscribe today to unlock all pages.
Trusted by 1+ million students worldwide
1 out of 13
Related Documents


Your All-in-One AI-Powered Toolkit for Academic Success.
+13062052269
info@desklib.com
Available 24*7 on WhatsApp / Email
![[object Object]](/_next/static/media/star-bottom.7253800d.svg)
Unlock your academic potential
Copyright © 2020–2026 A2Z Services. All Rights Reserved. Developed and managed by ZUCOL.