Analysis of Financial Position and Corporate Governance: DLM Morocco
VerifiedAdded on 2023/04/08
|12
|3068
|324
Report
AI Summary
This report provides a detailed financial analysis of Delattre Levivier Maroc (DLM), a public company listed on the Casablanca Stock Exchange. The analysis covers the company's financial performance over a four-year period, examining key indicators such as revenue, gross profit, net profit, and diluted EPS. Ratio analysis, including current ratio, quick ratio, return on assets, and profit margins, is performed to assess the company's liquidity and profitability. The report highlights trends in financial performance and discusses the role of corporate governance in maximizing shareholder wealth. The report also provides graphical representations of key financial metrics and concludes with an assessment of the company's financial health and market position.
Financial Management for Manager
Introduction
The research paper deals with analysis of financial position and corporate governance of a
Public company in Morocco. The company chosen is listed on Casablanca Stock Exchange and
the ticker symbol of the company is DLM. The name of the company is Delattre Levivier
Maroc DLM. Further, the report provides insights on how well the company is performing and
wealth added for its shareholders.
The report also considers important qualitative factors, which have been analysed for
understanding the financial performance of the company. Further, the role of Corporate
Governance in maintaining the wealth of shareholders has been analysed.
About the company
The company chosen is Maroc Dellatre Leviver SA (DLM.CS). The company has headquarters
in Morocco. The business of the company is engineering and construction. The company has
various divisions encompassing chemistry, mines, energy, structures, products of petroleum,
building, port, cement, energy, gas etc. The major clients of the company are Mobil Samir,
Lafarge Maroc etc. The company has established subsidiaries for its effective functioning in
Morocco and globally.
Besides, above, the trading price of Security of the company as on 08 April 2019 was 106.85
MAD with a 52 week high of MAD 179. Thus, it can be seen that significant wealth of the
company has subsided in 1 year because of negative market perception and other news in the
market.
Financial Analysis of the company
For analysing the financial performance of the company, the key performance indicators like
profit, revenue, profit before tax, diluted eps etc have been analysed to understand the trend of
profitability of the company over the last 4years. The analysis has been presented here in below
to establish whether the company has been successful in maximising wealth of the shareholders
over the past years:
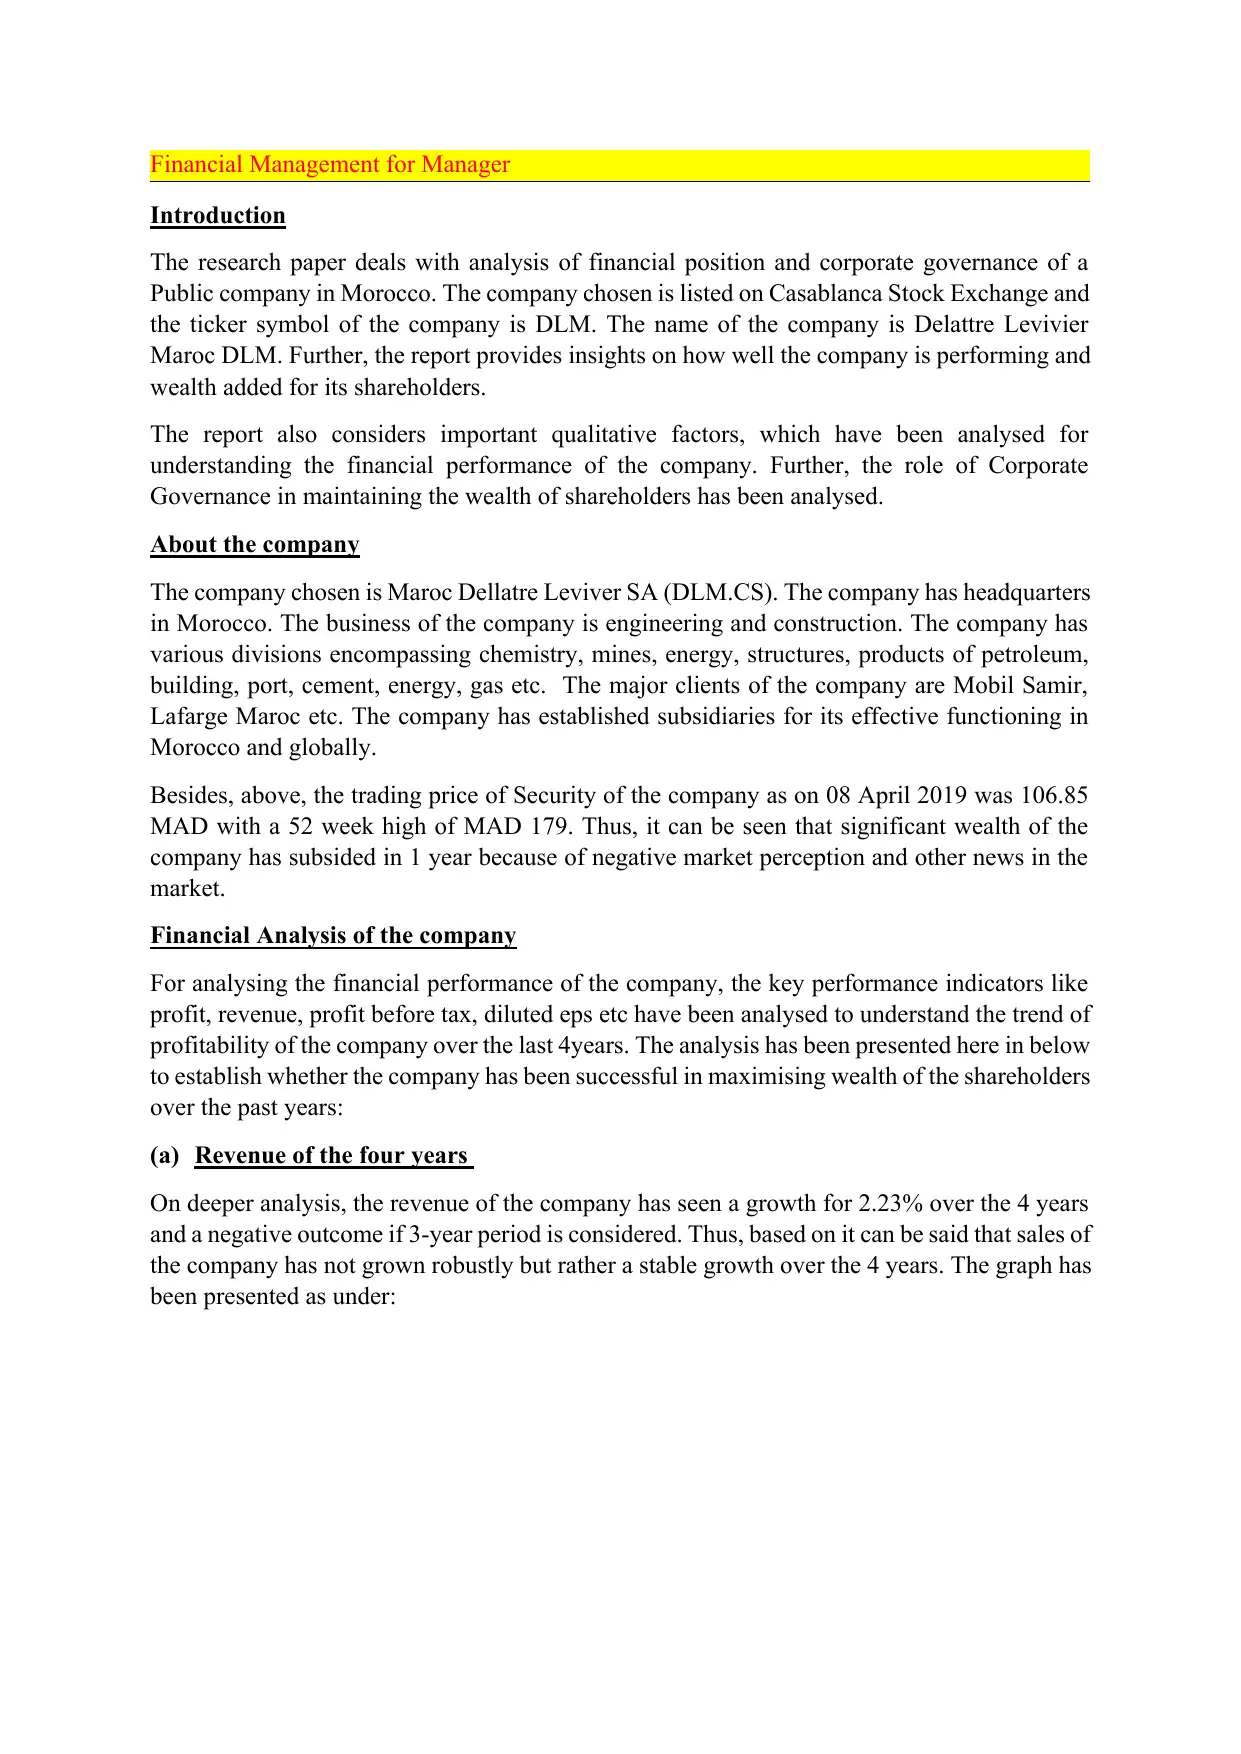
(a) Revenue of the four years
On deeper analysis, the revenue of the company has seen a growth for 2.23% over the 4 years
and a negative outcome if 3-year period is considered. Thus, based on it can be said that sales of
the company has not grown robustly but rather a stable growth over the 4 years. The graph has
been presented as under:
Introduction
The research paper deals with analysis of financial position and corporate governance of a
Public company in Morocco. The company chosen is listed on Casablanca Stock Exchange and
the ticker symbol of the company is DLM. The name of the company is Delattre Levivier
Maroc DLM. Further, the report provides insights on how well the company is performing and
wealth added for its shareholders.
The report also considers important qualitative factors, which have been analysed for
understanding the financial performance of the company. Further, the role of Corporate
Governance in maintaining the wealth of shareholders has been analysed.
About the company
The company chosen is Maroc Dellatre Leviver SA (DLM.CS). The company has headquarters
in Morocco. The business of the company is engineering and construction. The company has
various divisions encompassing chemistry, mines, energy, structures, products of petroleum,
building, port, cement, energy, gas etc. The major clients of the company are Mobil Samir,
Lafarge Maroc etc. The company has established subsidiaries for its effective functioning in
Morocco and globally.
Besides, above, the trading price of Security of the company as on 08 April 2019 was 106.85
MAD with a 52 week high of MAD 179. Thus, it can be seen that significant wealth of the
company has subsided in 1 year because of negative market perception and other news in the
market.
Financial Analysis of the company
For analysing the financial performance of the company, the key performance indicators like
profit, revenue, profit before tax, diluted eps etc have been analysed to understand the trend of
profitability of the company over the last 4years. The analysis has been presented here in below
to establish whether the company has been successful in maximising wealth of the shareholders
over the past years:
(a) Revenue of the four years
On deeper analysis, the revenue of the company has seen a growth for 2.23% over the 4 years
and a negative outcome if 3-year period is considered. Thus, based on it can be said that sales of
the company has not grown robustly but rather a stable growth over the 4 years. The graph has
been presented as under:
Paraphrase This Document
Need a fresh take? Get an instant paraphrase of this document with our AI Paraphraser
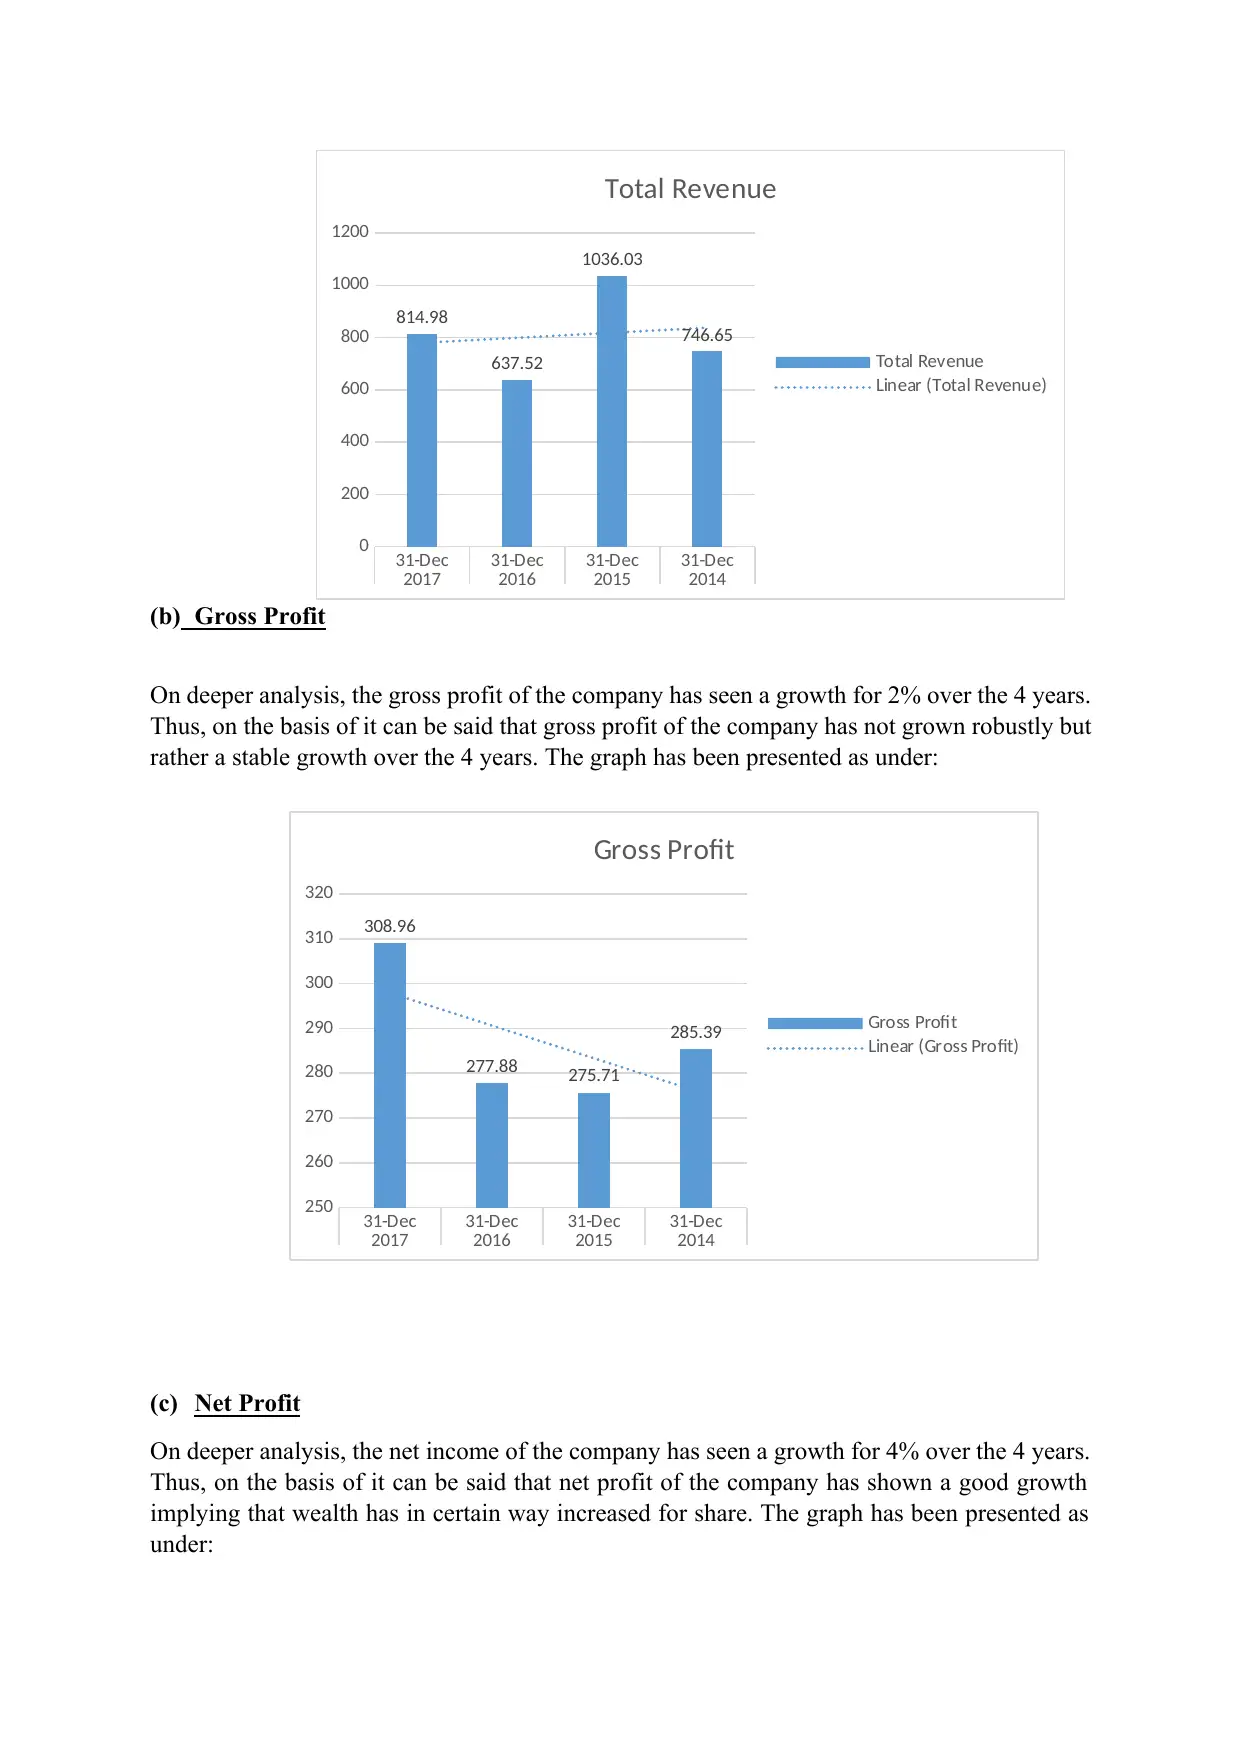
(b) Gross Profit
On deeper analysis, the gross profit of the company has seen a growth for 2% over the 4 years.
Thus, on the basis of it can be said that gross profit of the company has not grown robustly but
rather a stable growth over the 4 years. The graph has been presented as under:
(c) Net Profit
On deeper analysis, the net income of the company has seen a growth for 4% over the 4 years.
Thus, on the basis of it can be said that net profit of the company has shown a good growth
implying that wealth has in certain way increased for share. The graph has been presented as
under:
31-Dec 31-Dec 31-Dec 31-Dec
2017 2016 2015 2014
0
200
400
600
800
1000
1200
814.98
637.52
1036.03
746.65
Total Revenue
Total Revenue
Linear (Total Revenue)
31-Dec 31-Dec 31-Dec 31-Dec
2017 2016 2015 2014
250
260
270
280
290
300
310
320
308.96
277.88 275.71
285.39
Gross Profit
Gross Profit
Linear (Gross Profit)
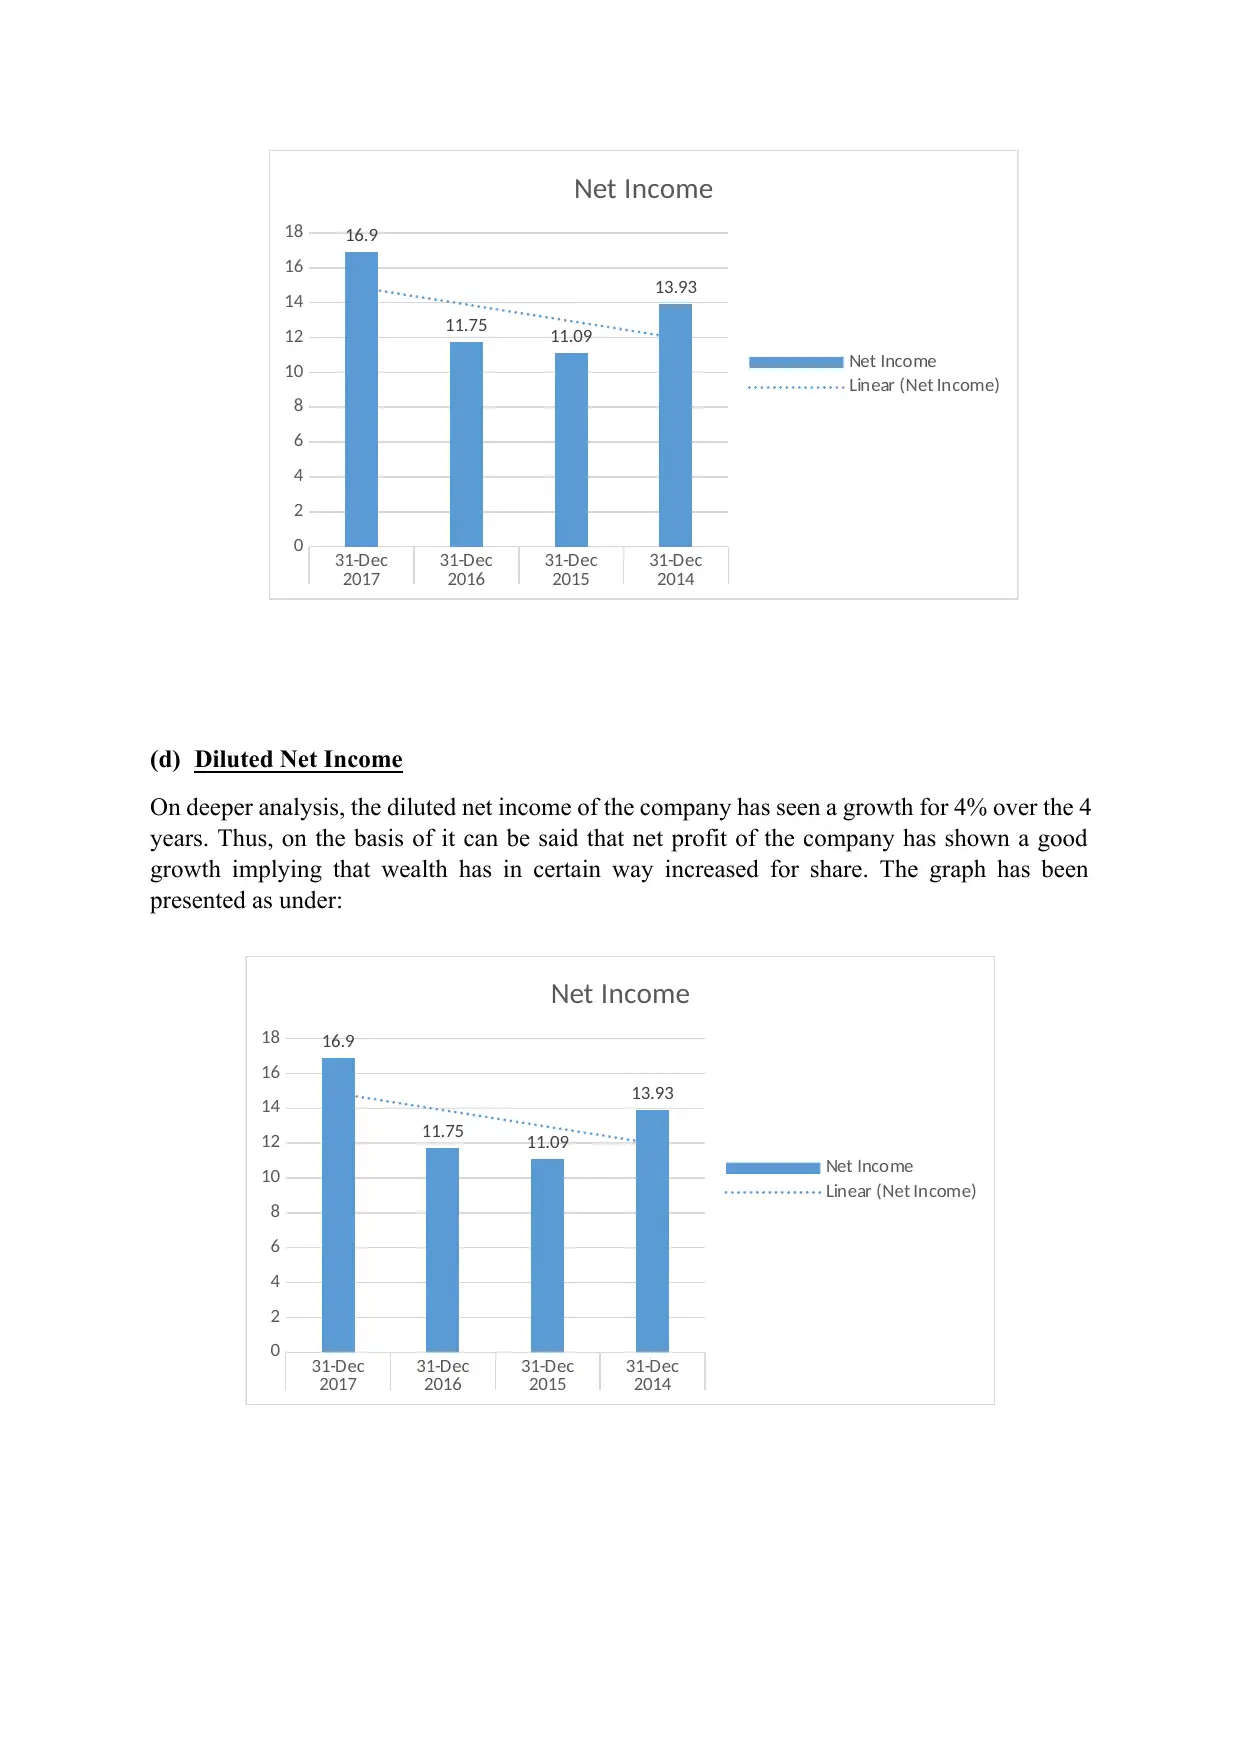
(d) Diluted Net Income
On deeper analysis, the diluted net income of the company has seen a growth for 4% over the 4
years. Thus, on the basis of it can be said that net profit of the company has shown a good
growth implying that wealth has in certain way increased for share. The graph has been
presented as under:
31-Dec 31-Dec 31-Dec 31-Dec
2017 2016 2015 2014
0
2
4
6
8
10
12
14
16
18 16.9
11.75 11.09
13.93
Net Income
Net Income
Linear (Net Income)
31-Dec 31-Dec 31-Dec 31-Dec
2017 2016 2015 2014
0
2
4
6
8
10
12
14
16
18 16.9
11.75 11.09
13.93
Net Income
Net Income
Linear (Net Income)
⊘ This is a preview!⊘
Do you want full access?
Subscribe today to unlock all pages.
Trusted by 1+ million students worldwide
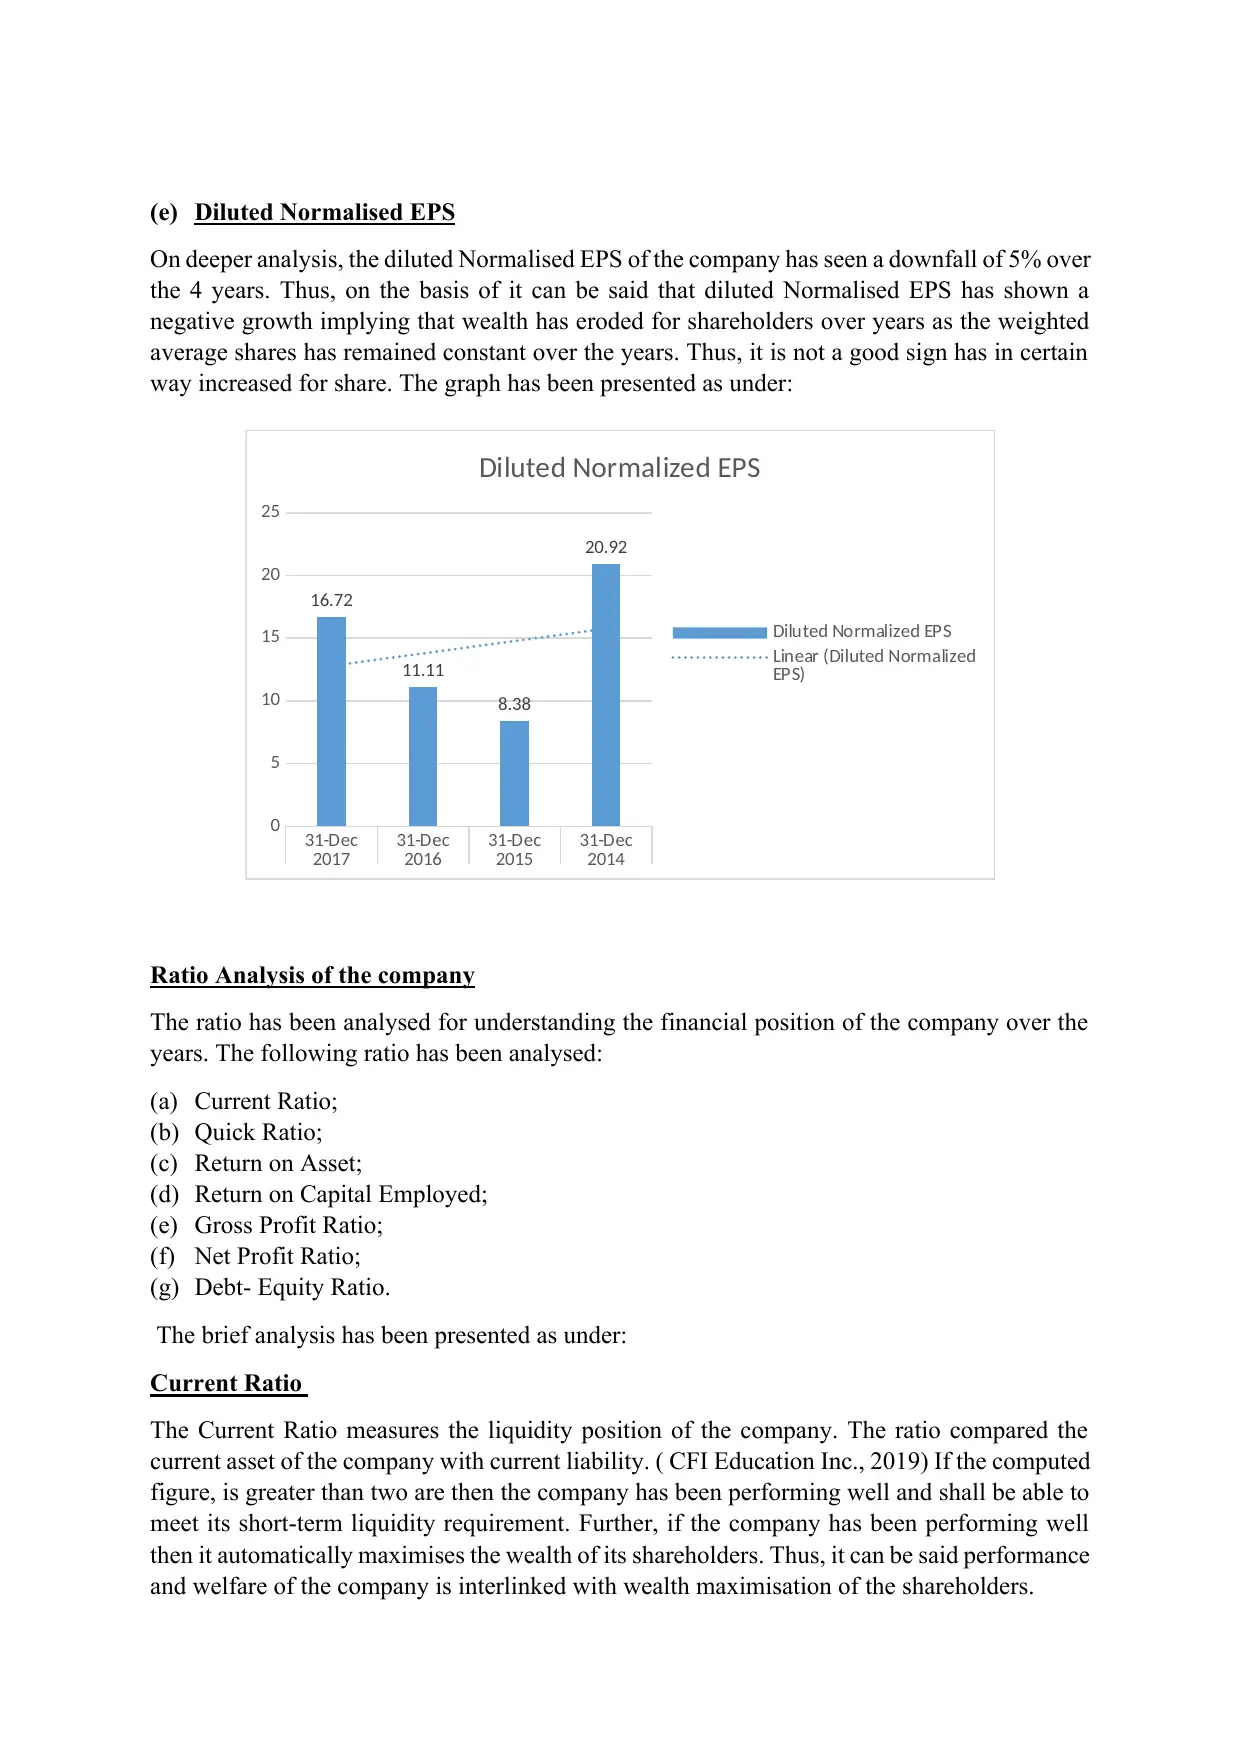
(e) Diluted Normalised EPS
On deeper analysis, the diluted Normalised EPS of the company has seen a downfall of 5% over
the 4 years. Thus, on the basis of it can be said that diluted Normalised EPS has shown a
negative growth implying that wealth has eroded for shareholders over years as the weighted
average shares has remained constant over the years. Thus, it is not a good sign has in certain
way increased for share. The graph has been presented as under:
Ratio Analysis of the company
The ratio has been analysed for understanding the financial position of the company over the
years. The following ratio has been analysed:
(a) Current Ratio;
(b) Quick Ratio;
(c) Return on Asset;
(d) Return on Capital Employed;
(e) Gross Profit Ratio;
(f) Net Profit Ratio;
(g) Debt- Equity Ratio.
The brief analysis has been presented as under:
Current Ratio
The Current Ratio measures the liquidity position of the company. The ratio compared the
current asset of the company with current liability. ( CFI Education Inc., 2019) If the computed
figure, is greater than two are then the company has been performing well and shall be able to
meet its short-term liquidity requirement. Further, if the company has been performing well
then it automatically maximises the wealth of its shareholders. Thus, it can be said performance
and welfare of the company is interlinked with wealth maximisation of the shareholders.
31-Dec 31-Dec 31-Dec 31-Dec
2017 2016 2015 2014
0
5
10
15
20
25
16.72
11.11
8.38
20.92
Diluted Normalized EPS
Diluted Normalized EPS
Linear (Diluted Normalized
EPS)
Paraphrase This Document
Need a fresh take? Get an instant paraphrase of this document with our AI Paraphraser
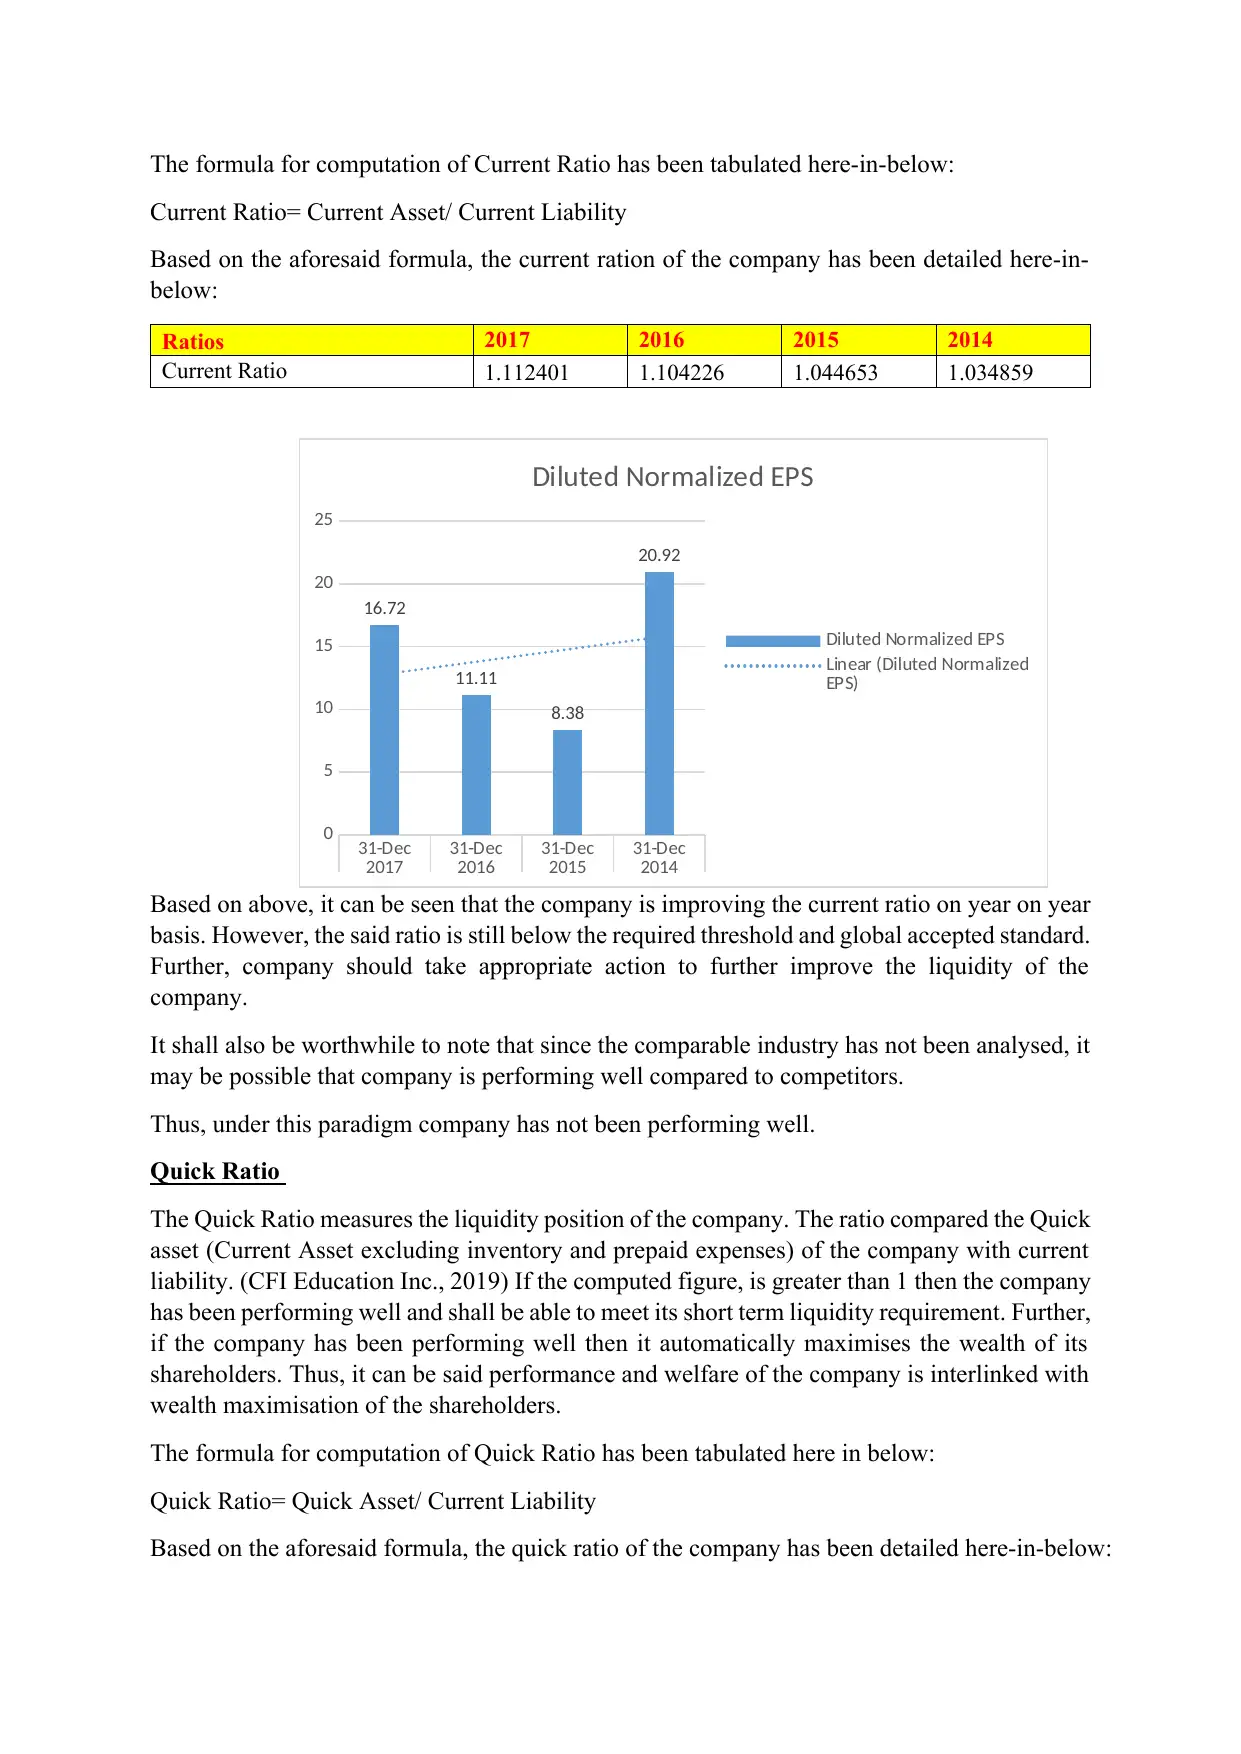
The formula for computation of Current Ratio has been tabulated here-in-below:
Current Ratio= Current Asset/ Current Liability
Based on the aforesaid formula, the current ration of the company has been detailed here-in-
below:
Ratios 2017 2016 2015 2014
Current Ratio 1.112401 1.104226 1.044653 1.034859
Based on above, it can be seen that the company is improving the current ratio on year on year
basis. However, the said ratio is still below the required threshold and global accepted standard.
Further, company should take appropriate action to further improve the liquidity of the
company.
It shall also be worthwhile to note that since the comparable industry has not been analysed, it
may be possible that company is performing well compared to competitors.
Thus, under this paradigm company has not been performing well.
Quick Ratio
The Quick Ratio measures the liquidity position of the company. The ratio compared the Quick
asset (Current Asset excluding inventory and prepaid expenses) of the company with current
liability. (CFI Education Inc., 2019) If the computed figure, is greater than 1 then the company
has been performing well and shall be able to meet its short term liquidity requirement. Further,
if the company has been performing well then it automatically maximises the wealth of its
shareholders. Thus, it can be said performance and welfare of the company is interlinked with
wealth maximisation of the shareholders.
The formula for computation of Quick Ratio has been tabulated here in below:
Quick Ratio= Quick Asset/ Current Liability
Based on the aforesaid formula, the quick ratio of the company has been detailed here-in-below:
31-Dec 31-Dec 31-Dec 31-Dec
2017 2016 2015 2014
0
5
10
15
20
25
16.72
11.11
8.38
20.92
Diluted Normalized EPS
Diluted Normalized EPS
Linear (Diluted Normalized
EPS)
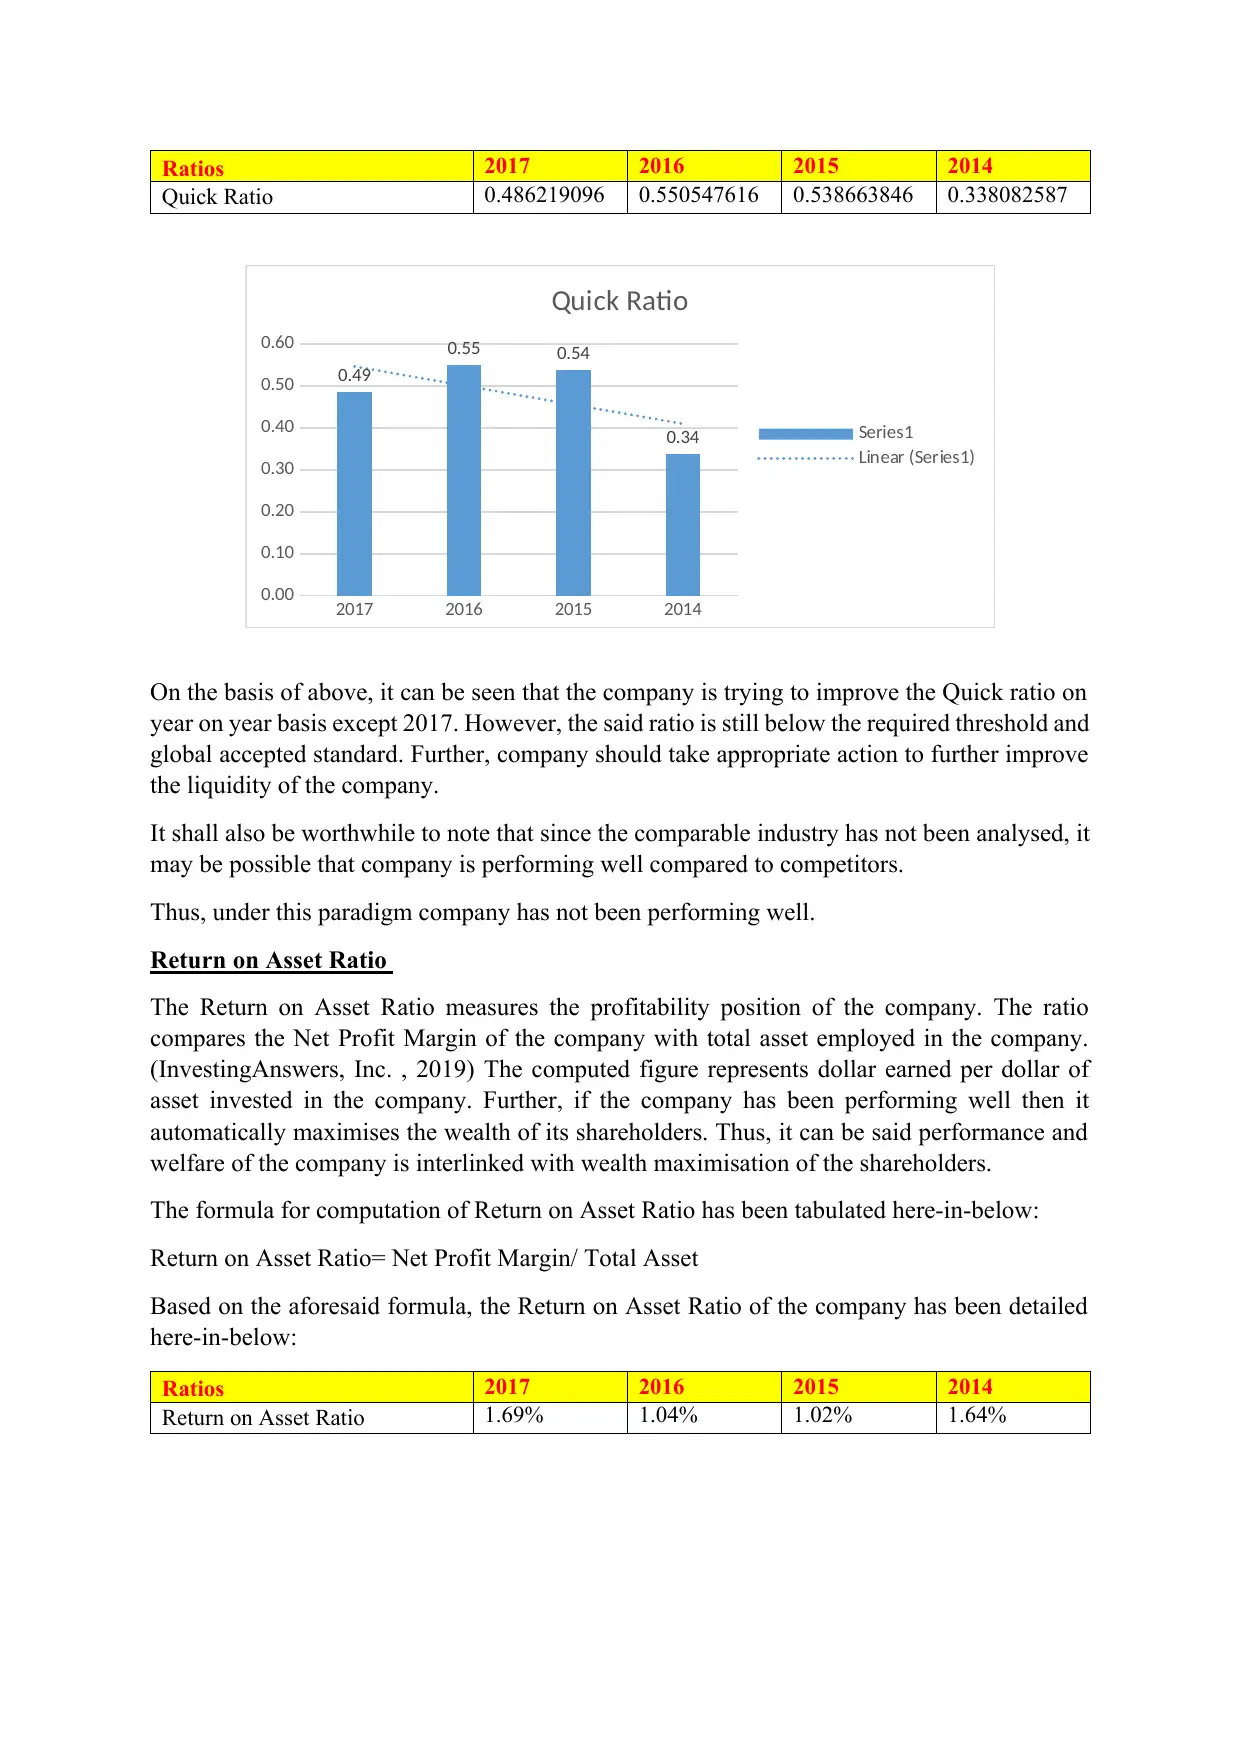
Ratios 2017 2016 2015 2014
Quick Ratio 0.486219096 0.550547616 0.538663846 0.338082587
On the basis of above, it can be seen that the company is trying to improve the Quick ratio on
year on year basis except 2017. However, the said ratio is still below the required threshold and
global accepted standard. Further, company should take appropriate action to further improve
the liquidity of the company.
It shall also be worthwhile to note that since the comparable industry has not been analysed, it
may be possible that company is performing well compared to competitors.
Thus, under this paradigm company has not been performing well.
Return on Asset Ratio
The Return on Asset Ratio measures the profitability position of the company. The ratio
compares the Net Profit Margin of the company with total asset employed in the company.
(InvestingAnswers, Inc. , 2019) The computed figure represents dollar earned per dollar of
asset invested in the company. Further, if the company has been performing well then it
automatically maximises the wealth of its shareholders. Thus, it can be said performance and
welfare of the company is interlinked with wealth maximisation of the shareholders.
The formula for computation of Return on Asset Ratio has been tabulated here-in-below:
Return on Asset Ratio= Net Profit Margin/ Total Asset
Based on the aforesaid formula, the Return on Asset Ratio of the company has been detailed
here-in-below:
Ratios 2017 2016 2015 2014
Return on Asset Ratio 1.69% 1.04% 1.02% 1.64%
2017 2016 2015 2014
0.00
0.10
0.20
0.30
0.40
0.50
0.60
0.49
0.55 0.54
0.34
Quick Ratio
Series1
Linear (Series1)
⊘ This is a preview!⊘
Do you want full access?
Subscribe today to unlock all pages.
Trusted by 1+ million students worldwide
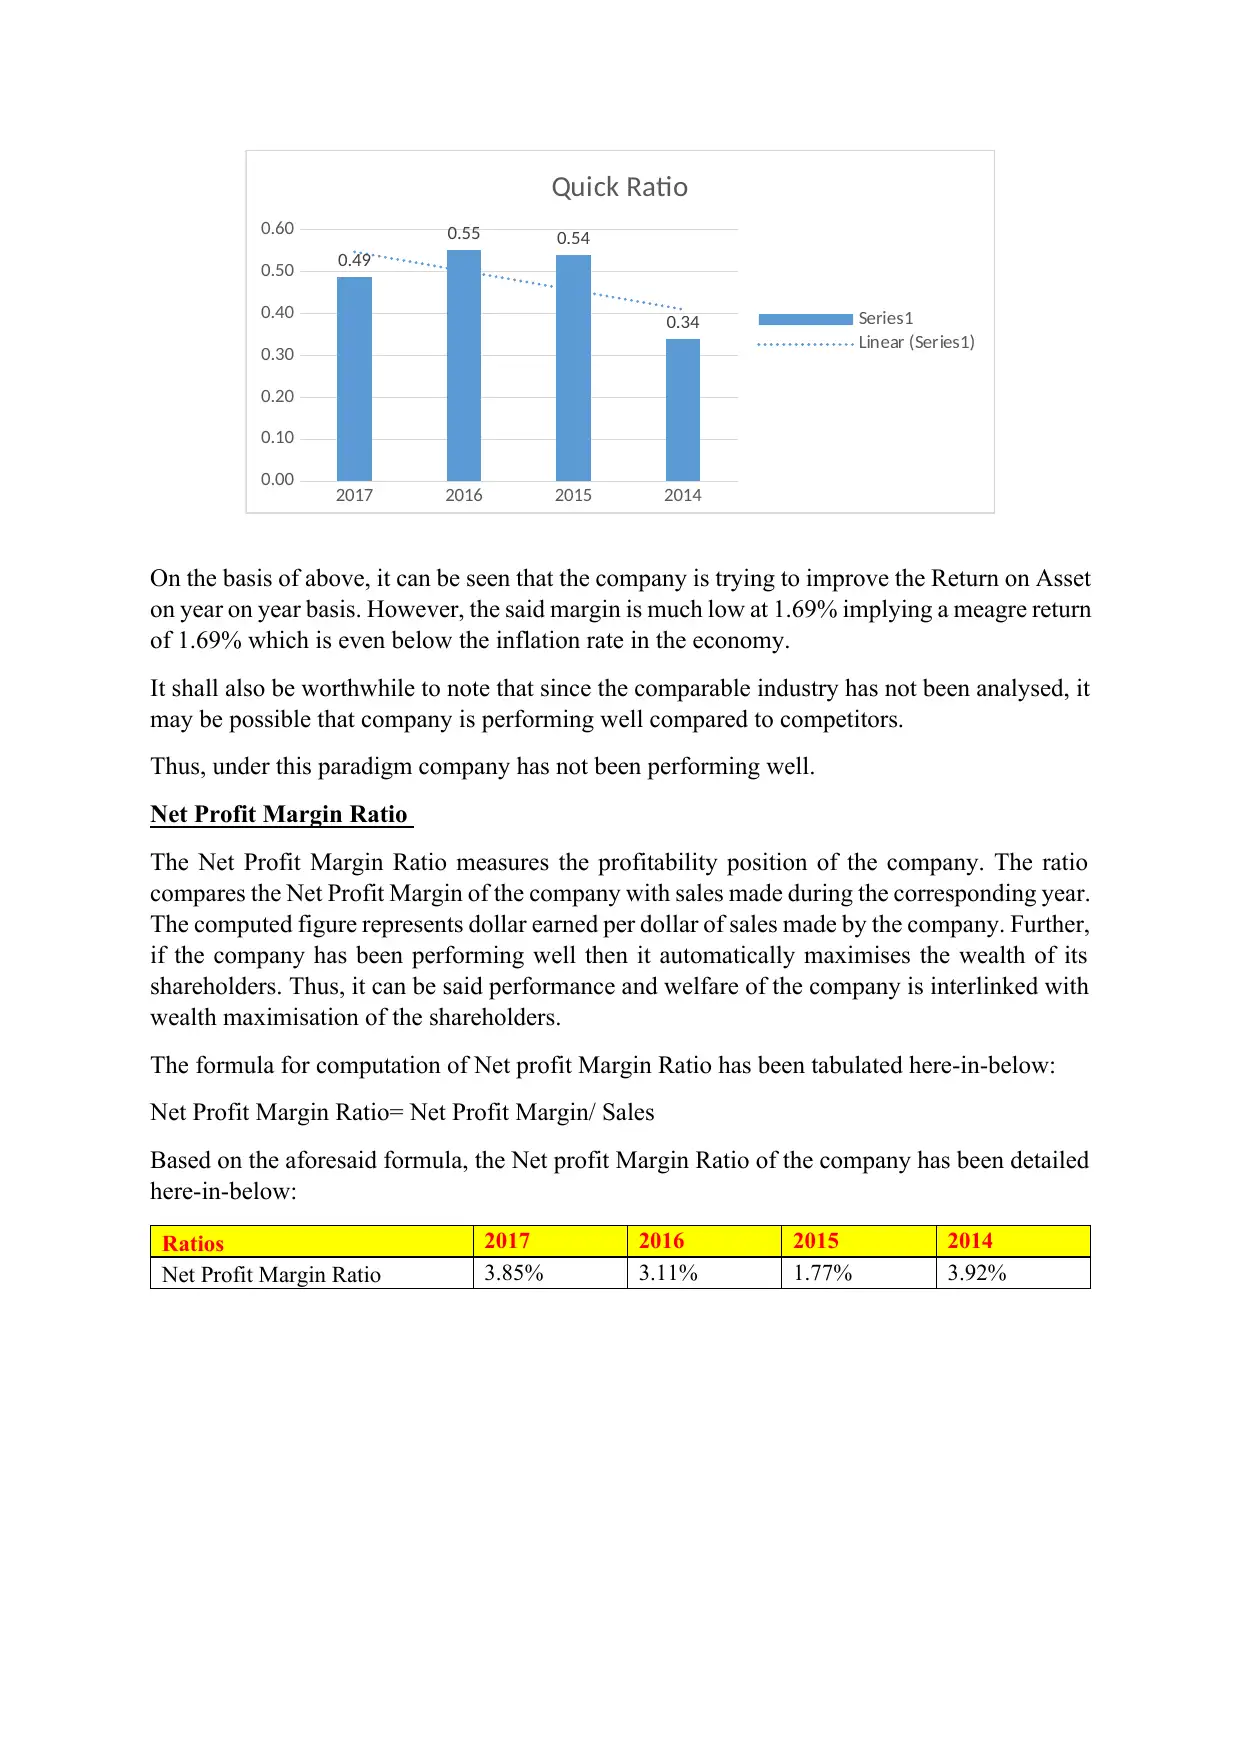
On the basis of above, it can be seen that the company is trying to improve the Return on Asset
on year on year basis. However, the said margin is much low at 1.69% implying a meagre return
of 1.69% which is even below the inflation rate in the economy.
It shall also be worthwhile to note that since the comparable industry has not been analysed, it
may be possible that company is performing well compared to competitors.
Thus, under this paradigm company has not been performing well.
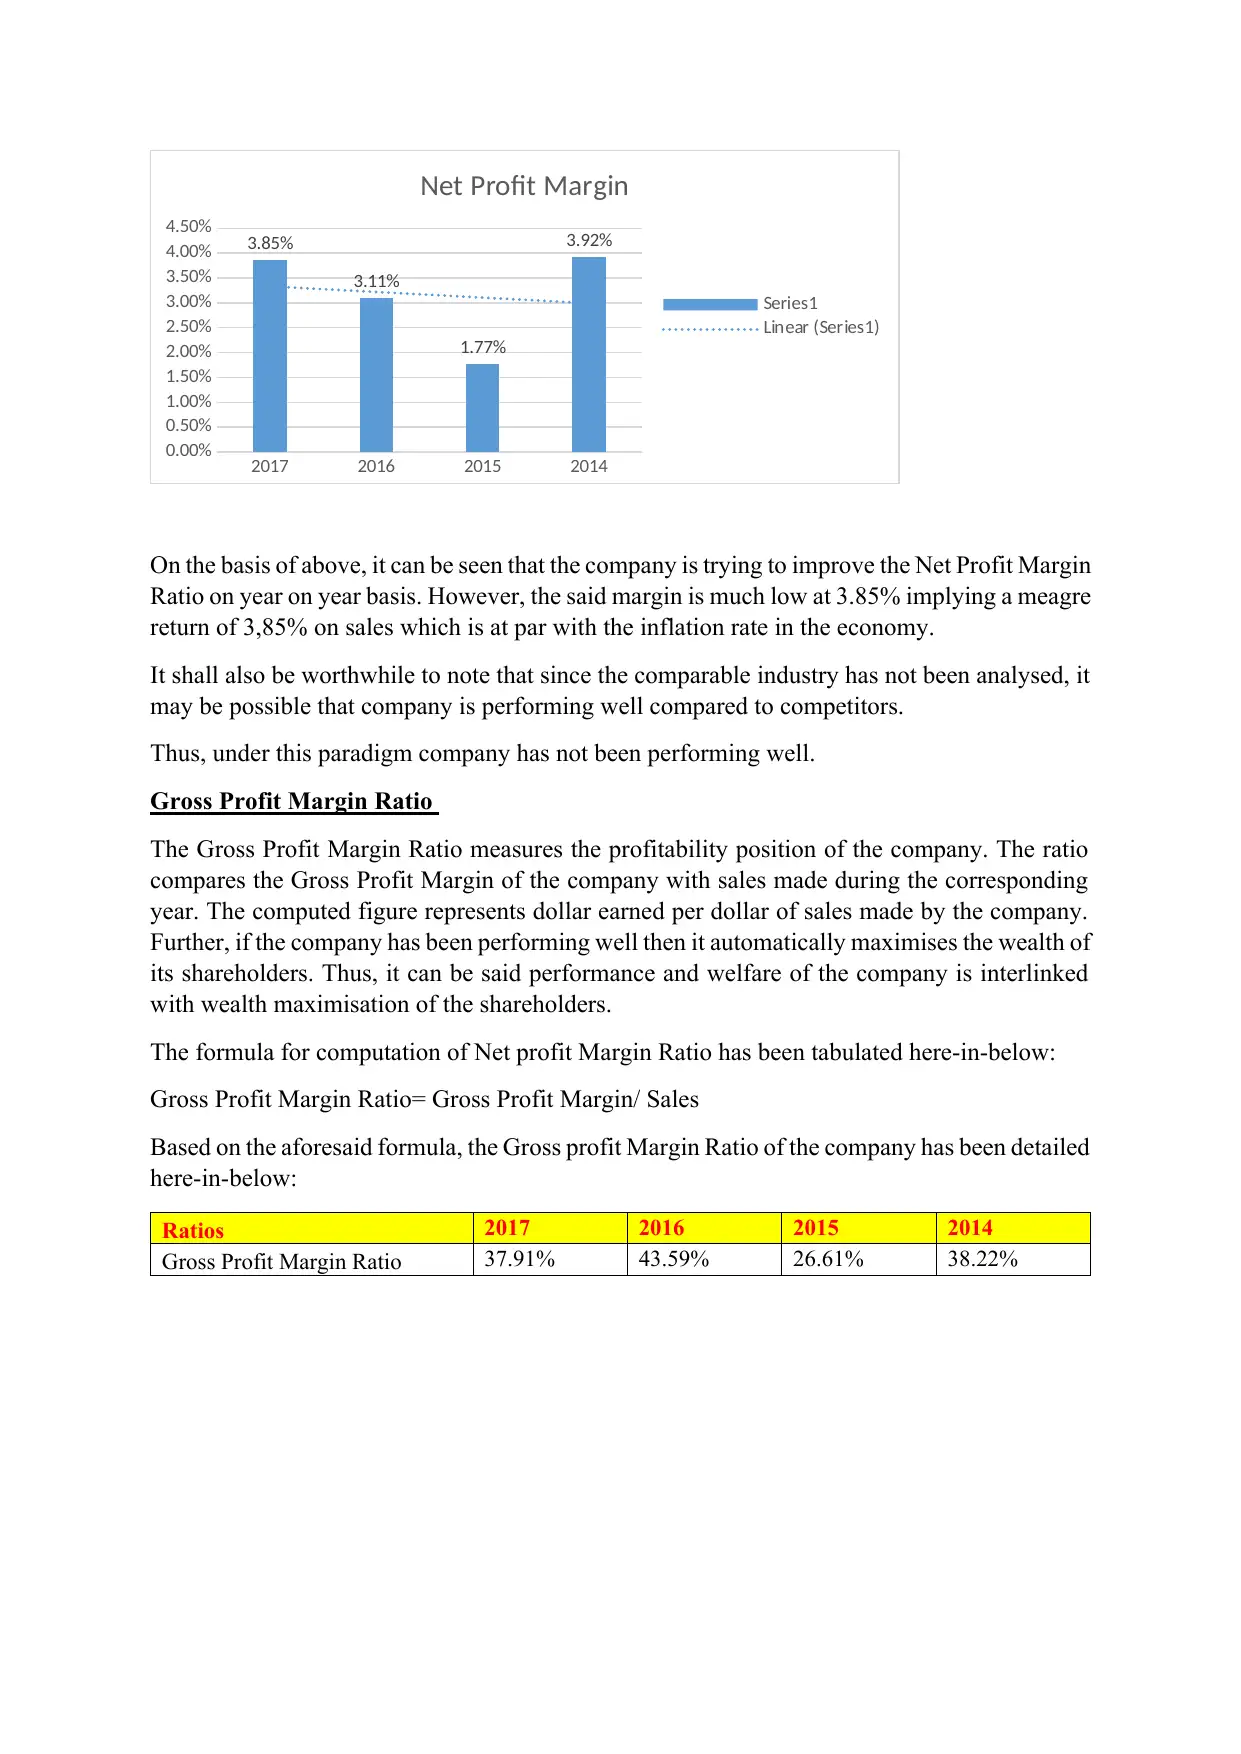
Net Profit Margin Ratio
The Net Profit Margin Ratio measures the profitability position of the company. The ratio
compares the Net Profit Margin of the company with sales made during the corresponding year.
The computed figure represents dollar earned per dollar of sales made by the company. Further,
if the company has been performing well then it automatically maximises the wealth of its
shareholders. Thus, it can be said performance and welfare of the company is interlinked with
wealth maximisation of the shareholders.
The formula for computation of Net profit Margin Ratio has been tabulated here-in-below:
Net Profit Margin Ratio= Net Profit Margin/ Sales
Based on the aforesaid formula, the Net profit Margin Ratio of the company has been detailed
here-in-below:
Ratios 2017 2016 2015 2014
Net Profit Margin Ratio 3.85% 3.11% 1.77% 3.92%
2017 2016 2015 2014
0.00
0.10
0.20
0.30
0.40
0.50
0.60
0.49
0.55 0.54
0.34
Quick Ratio
Series1
Linear (Series1)
on year on year basis. However, the said margin is much low at 1.69% implying a meagre return
of 1.69% which is even below the inflation rate in the economy.
It shall also be worthwhile to note that since the comparable industry has not been analysed, it
may be possible that company is performing well compared to competitors.
Thus, under this paradigm company has not been performing well.
Net Profit Margin Ratio
The Net Profit Margin Ratio measures the profitability position of the company. The ratio
compares the Net Profit Margin of the company with sales made during the corresponding year.
The computed figure represents dollar earned per dollar of sales made by the company. Further,
if the company has been performing well then it automatically maximises the wealth of its
shareholders. Thus, it can be said performance and welfare of the company is interlinked with
wealth maximisation of the shareholders.
The formula for computation of Net profit Margin Ratio has been tabulated here-in-below:
Net Profit Margin Ratio= Net Profit Margin/ Sales
Based on the aforesaid formula, the Net profit Margin Ratio of the company has been detailed
here-in-below:
Ratios 2017 2016 2015 2014
Net Profit Margin Ratio 3.85% 3.11% 1.77% 3.92%
2017 2016 2015 2014
0.00
0.10
0.20
0.30
0.40
0.50
0.60
0.49
0.55 0.54
0.34
Quick Ratio
Series1
Linear (Series1)
Paraphrase This Document
Need a fresh take? Get an instant paraphrase of this document with our AI Paraphraser
2017 2016 2015 2014
0.00%
0.50%
1.00%
1.50%
2.00%
2.50%
3.00%
3.50%
4.00%
4.50% 3.85%
3.11%
1.77%
3.92%
Net Profit Margin
Series1
Linear (Series1)
On the basis of above, it can be seen that the company is trying to improve the Net Profit Margin
Ratio on year on year basis. However, the said margin is much low at 3.85% implying a meagre
return of 3,85% on sales which is at par with the inflation rate in the economy.
It shall also be worthwhile to note that since the comparable industry has not been analysed, it
may be possible that company is performing well compared to competitors.
Thus, under this paradigm company has not been performing well.
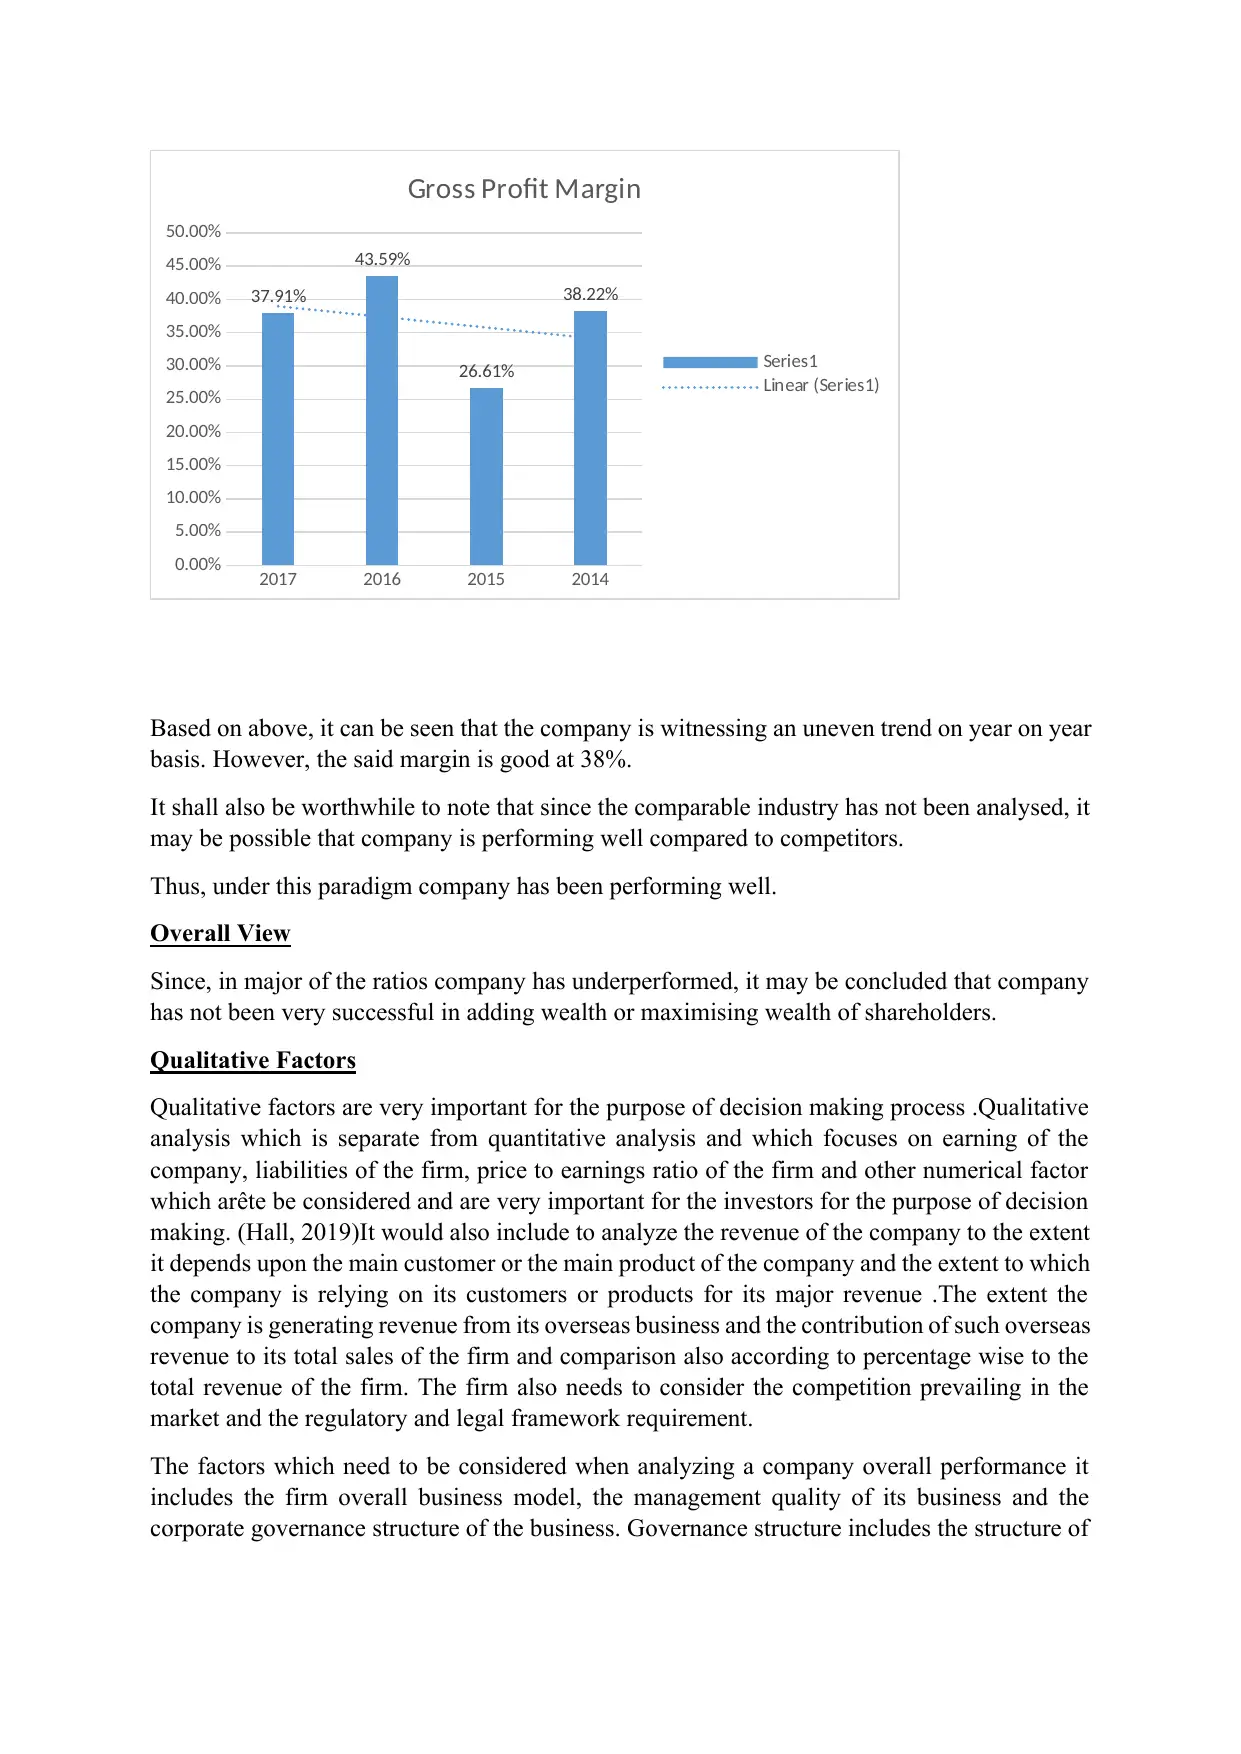
Gross Profit Margin Ratio
The Gross Profit Margin Ratio measures the profitability position of the company. The ratio
compares the Gross Profit Margin of the company with sales made during the corresponding
year. The computed figure represents dollar earned per dollar of sales made by the company.
Further, if the company has been performing well then it automatically maximises the wealth of
its shareholders. Thus, it can be said performance and welfare of the company is interlinked
with wealth maximisation of the shareholders.
The formula for computation of Net profit Margin Ratio has been tabulated here-in-below:
Gross Profit Margin Ratio= Gross Profit Margin/ Sales
Based on the aforesaid formula, the Gross profit Margin Ratio of the company has been detailed
here-in-below:
Ratios 2017 2016 2015 2014
Gross Profit Margin Ratio 37.91% 43.59% 26.61% 38.22%
0.00%
0.50%
1.00%
1.50%
2.00%
2.50%
3.00%
3.50%
4.00%
4.50% 3.85%
3.11%
1.77%
3.92%
Net Profit Margin
Series1
Linear (Series1)
On the basis of above, it can be seen that the company is trying to improve the Net Profit Margin
Ratio on year on year basis. However, the said margin is much low at 3.85% implying a meagre
return of 3,85% on sales which is at par with the inflation rate in the economy.
It shall also be worthwhile to note that since the comparable industry has not been analysed, it
may be possible that company is performing well compared to competitors.
Thus, under this paradigm company has not been performing well.
Gross Profit Margin Ratio
The Gross Profit Margin Ratio measures the profitability position of the company. The ratio
compares the Gross Profit Margin of the company with sales made during the corresponding
year. The computed figure represents dollar earned per dollar of sales made by the company.
Further, if the company has been performing well then it automatically maximises the wealth of
its shareholders. Thus, it can be said performance and welfare of the company is interlinked
with wealth maximisation of the shareholders.
The formula for computation of Net profit Margin Ratio has been tabulated here-in-below:
Gross Profit Margin Ratio= Gross Profit Margin/ Sales
Based on the aforesaid formula, the Gross profit Margin Ratio of the company has been detailed
here-in-below:
Ratios 2017 2016 2015 2014
Gross Profit Margin Ratio 37.91% 43.59% 26.61% 38.22%
2017 2016 2015 2014
0.00%
5.00%
10.00%
15.00%
20.00%
25.00%
30.00%
35.00%
40.00%
45.00%
50.00%
37.91%
43.59%
26.61%
38.22%
Gross Profit Margin
Series1
Linear (Series1)
Based on above, it can be seen that the company is witnessing an uneven trend on year on year
basis. However, the said margin is good at 38%.
It shall also be worthwhile to note that since the comparable industry has not been analysed, it
may be possible that company is performing well compared to competitors.
Thus, under this paradigm company has been performing well.
Overall View
Since, in major of the ratios company has underperformed, it may be concluded that company
has not been very successful in adding wealth or maximising wealth of shareholders.
Qualitative Factors
Qualitative factors are very important for the purpose of decision making process .Qualitative
analysis which is separate from quantitative analysis and which focuses on earning of the
company, liabilities of the firm, price to earnings ratio of the firm and other numerical factor
which arête be considered and are very important for the investors for the purpose of decision
making. (Hall, 2019)It would also include to analyze the revenue of the company to the extent
it depends upon the main customer or the main product of the company and the extent to which
the company is relying on its customers or products for its major revenue .The extent the
company is generating revenue from its overseas business and the contribution of such overseas
revenue to its total sales of the firm and comparison also according to percentage wise to the
total revenue of the firm. The firm also needs to consider the competition prevailing in the
market and the regulatory and legal framework requirement.
The factors which need to be considered when analyzing a company overall performance it
includes the firm overall business model, the management quality of its business and the
corporate governance structure of the business. Governance structure includes the structure of
⊘ This is a preview!⊘
Do you want full access?
Subscribe today to unlock all pages.
Trusted by 1+ million students worldwide
the Board of Directors and the relationship of the board of directors with its shareholders and
management of the company. (Course Hero Inc, 2019)
Another important factor, which needs to be seen, is the regulatory environment of the
company in which it is operating. Few companies have a maximum burden of the government
regulation while in rest of the companies regulation is minimal. Generally if the investment is
not done in a large scale than the qualitative factors are very important to be considered rather
than the quantitative factors. (Accounting Tools, 2018)
Qualitative Information Sources
There are various sources available through which qualitative sources of information can be
extracted for companies like through the firm’s website, which contains worldwide
information. The annual and quarterly reports of the company, which contains huge range of
information about the company and has the quantitative data, can also produce qualitative
information as well. Another way round is listening to all shareholder conference call is another
way to know about the qualitative factors of the firm. The other sources through which the
information amount the company can be extracted is through the financial Times, The wall
street journal and other business related magazines which provides update regarding the
qualitative factors of the company. (Hall, 2019)
Corporate Governance ensure achievement and retention of shareholders wealth
The corporate governance main element is the structure of the board of directors. As the board
of directors of the company seen as the individual person of the company, which has the main
responsibility of leading the company, and protecting the interest of shareholders and
maximising its wealth. Thus, the corporate goals of the company are set by the board of
directors of the firm which main aim is at realizing the long-term shareholders value. The board
of directors is also responsible for the evaluating the appropriateness of the overall strategy
framed and the role-played in the corporate goals. (Prempeh, 2017).A very well established
corporate governance means that there is a effective accounting control ,strong management
process ,stringent monitoring and the utilisation of the firm resources in a very effective manner
so that the performance of the company can be improved a lot. The effect of corporate
governance on the shareholders wealth and the distribution of dividend to the shareholders and
the dividend yield also considered the important factor in determining the corporate governance
relationship with the shareholders wealth.
The board of directors are formed so that the performance of the firm can be monitored
carefully and the interest of the shareholders is protected. It is therefore said that if the board of
directors performs its duties wisely and effectively than the value of the firm is increased and
the shareholders wealth is stored and enhanced accordingly. The act such as Sarbanes Oxley
Act of 2002, regulate the system to ensure that the main principle do-good corporate
governance is followed.
Wealth of the shareholder or to maximise value is a very long-term decision making process
and its success depends upon the value based practice of the management. Great scholars also
believe that the main goal of every entity is to maximise the wealth of shareholders .If the
shareholders wealth are maximised than the shareholders risk are also compensated for the risk
Paraphrase This Document
Need a fresh take? Get an instant paraphrase of this document with our AI Paraphraser
borne by them. When any of the firm or companies failed the most affected person in the
company is the small shareholders who are affected a lot .In this case than the value of the
ordinary shareholders become a mirage.
CONCLUSION
This report analyse how the corporate governance can influence the wealth of shareholder.
Three major key corporate governance, which needs to be, consider like size of the board,
independence of the board and the CEO duality. These three variables are considered very
important part in assessing the relationship of corporate governance with shareholders wealth
maximization. Well-established corporate governance means strong internal control and
effective accounting system. Firms, which have better and established corporate governance,
are able to develop policy and structure that would maximise the value of the shareholder
wealth
References:
CFI Education Inc., 2019. What is the Current Ratio?. [Online]
Available at: https://corporatefinanceinstitute.com/resources/knowledge/finance/current-ratio-
formula/
[Accessed 19 April 2019].
Accounting Tools, 2018. Qualitative factors. [Online]
Available at: https://www.accountingtools.com/articles/2017/5/8/qualitative-factors
[Accessed 19 April 2019].
CFI Education Inc., 2019. What is the Quick Ratio?. [Online]
Available at: https://corporatefinanceinstitute.com/resources/knowledge/finance/quick-ratio-
definition/
[Accessed 19 April 2019].
Course Hero Inc, 2019. What qualitative factors should analysts look for. [Online]
Available at: https://www.coursehero.com/file/p7u6t5n/What-qualitative-factors-should-analysts-
look-for-when-evaluating-a-companys/
[Accessed 19 April 2019].
Hall, S., 2019. Qualitative Analysis of Companies. [Online]
Available at: https://smallbusiness.chron.com/qualitative-analysis-companies-21542.html
[Accessed 19 April 2019].
InvestingAnswers, Inc. , 2019. Return on Assets (ROA). [Online]
Available at: https://investinganswers.com/financial-dictionary/financial-statement-analysis/return-
assets-roa-1627
[Accessed 19 April 2019].

Prempeh, K. B., 2017. Corporate governance structure and shareholder wealth maximisation.
[Online]
Available at: https://mpra.ub.uni-muenchen.de/68087/1/MPRA_paper_68087.pdf
[Accessed 19 April 2019].
[Online]
Available at: https://mpra.ub.uni-muenchen.de/68087/1/MPRA_paper_68087.pdf
[Accessed 19 April 2019].
⊘ This is a preview!⊘
Do you want full access?
Subscribe today to unlock all pages.
Trusted by 1+ million students worldwide
1 out of 12
Related Documents


Your All-in-One AI-Powered Toolkit for Academic Success.
+13062052269
info@desklib.com
Available 24*7 on WhatsApp / Email
![[object Object]](/_next/static/media/star-bottom.7253800d.svg)
Unlock your academic potential
Copyright © 2020–2026 A2Z Services. All Rights Reserved. Developed and managed by ZUCOL.