Financial Performance Evaluation: Ratio Analysis of Zurich Plc
VerifiedAdded on 2023/06/14
|23
|5139
|390
Report
AI Summary
This report provides a comprehensive financial analysis of Zurich Plc, a manufacturing and distributing company specializing in office equipment. Part A evaluates Zurich Plc's financial performance using ratio analysis, including profitability, liquidity, gearing, asset utilization, and investment ratios, based on financial statements from 2015 and 2016. It identifies the company's strengths and weaknesses in profit generation, short-term debt management, capital structure, asset management, and investment levels. Part B focuses on investment appraisal techniques for Johnson Limited, calculating the payback period, discounted payback period, accounting rate of return, net present value, and internal rate of return to assess an investment opportunity. The report also discusses the benefits and limitations of each appraisal method and explores internal and external sources of company financing. The findings are intended to inform decision-making regarding Zurich Plc's financial strategies and Johnson Limited's investment decisions. Desklib provides access to similar solved assignments and past papers for students.

RUNNUNG HEAD: Financial management and control 1
Project Report: Financial management and control
Project Report: Financial management and control
Paraphrase This Document
Need a fresh take? Get an instant paraphrase of this document with our AI Paraphraser
Financial management and control 2
Contents
Introduction:..........................................................................................................................................4
Part A.....................................................................................................................................................4
A report on the performance of Zurich Plc Ltd......................................................................................4
Ratios:....................................................................................................................................................4
Profitability ratios:.............................................................................................................................4
Limitations:........................................................................................................................................5
Liquidity ratios:..................................................................................................................................6
Limitations.........................................................................................................................................6
Gearing Ratios:..................................................................................................................................6
Limitations.........................................................................................................................................7
Asset Utilization ratio:.......................................................................................................................7
Limitations.........................................................................................................................................8
Investment ratio:...............................................................................................................................8
Limitations.........................................................................................................................................8
Task 2:.................................................................................................................................................10
Que a...............................................................................................................................................10
Investment appraisal techniques.....................................................................................................10
Calculation of payback period.....................................................................................................10
Calculation of discounted payback period...................................................................................10
The accounting rate of return......................................................................................................11
The net present value..................................................................................................................12
The initial rate of return..............................................................................................................13
Que b)..............................................................................................................................................14
The Payback Period:........................................................................................................................14
Key Benefits.................................................................................................................................14
Limitations...................................................................................................................................14
The discounted Payback Period.......................................................................................................14
Key Benefits.................................................................................................................................14
Limitations...................................................................................................................................15
The Accounting Rate of Return........................................................................................................15
Key Benefits.................................................................................................................................15
Financial management and control 3
Limitations...................................................................................................................................15
The Net Present Value.....................................................................................................................15
Key Benefits.................................................................................................................................16
Limitations...................................................................................................................................16
The Internal Rate of Return.............................................................................................................16
Key Benefits.................................................................................................................................16
Limitations...................................................................................................................................16
Que c)..............................................................................................................................................16
Internal and external sources of the company................................................................................16
References:..........................................................................................................................................18
Appendix.............................................................................................................................................20
⊘ This is a preview!⊘
Do you want full access?
Subscribe today to unlock all pages.
Trusted by 1+ million students worldwide
Financial management and control 4
Introduction:
The report explains about various financial analysis concepts. Financial analysis is a
process which is done by the companies and its stakeholders to identify and evaluate various
financial concept of an organization such as evaluation on financial statements, evaluation on
the various investment proposals etc. in the given report, performance of Zurich plc has been
evaluated on the basis of ratio analysis. And the investment opportunity of Johnson limited
has been evaluated on the basis of various capital budgeting techniques and the
recommendation has been given to the company that the company should invest into the
project or not.
Part A:
A report on the performance of Zurich Plc Ltd:
The performance of position of Zurich Plc has been evaluated through identifying the
financial performance and strength of the company. For evaluating the financial performance
and the position of Zurich plc, ratio analysis study has been conducted. The financial
statement of Zurich plc of 2015 and 2016 has been evaluated and it has been analyzed that
how much changes have taken place into the financial performance of the company from last
year and how is the current position of the company. Various ratios have been calculated to
identify the position of the company. Following is the calculations and analysis:
Ratios:
Ratio analysis is a quantitative analysis which contains and evaluates information
related to the financial statement of an organization. It is used to analyze the company’s
operating and financial knowledge such as profitability level, solvency level, efficiency level
and liquidity level (Shapiro, 2005). Following is the study of ratio analysis on Zurich plc:
Profitability ratios:
Profitability ratios are a part of ratio analysis which expresses about the total ability of an
organization to generate and enhance the revenue in context with the various expenses such
as selling expenses, operating expenses; cost of goods sold etc. following is the calculations
of profitability ratio:
1. Gross profit margin – Gross profit/revenue x 100
Paraphrase This Document
Need a fresh take? Get an instant paraphrase of this document with our AI Paraphraser
Financial management and control 5
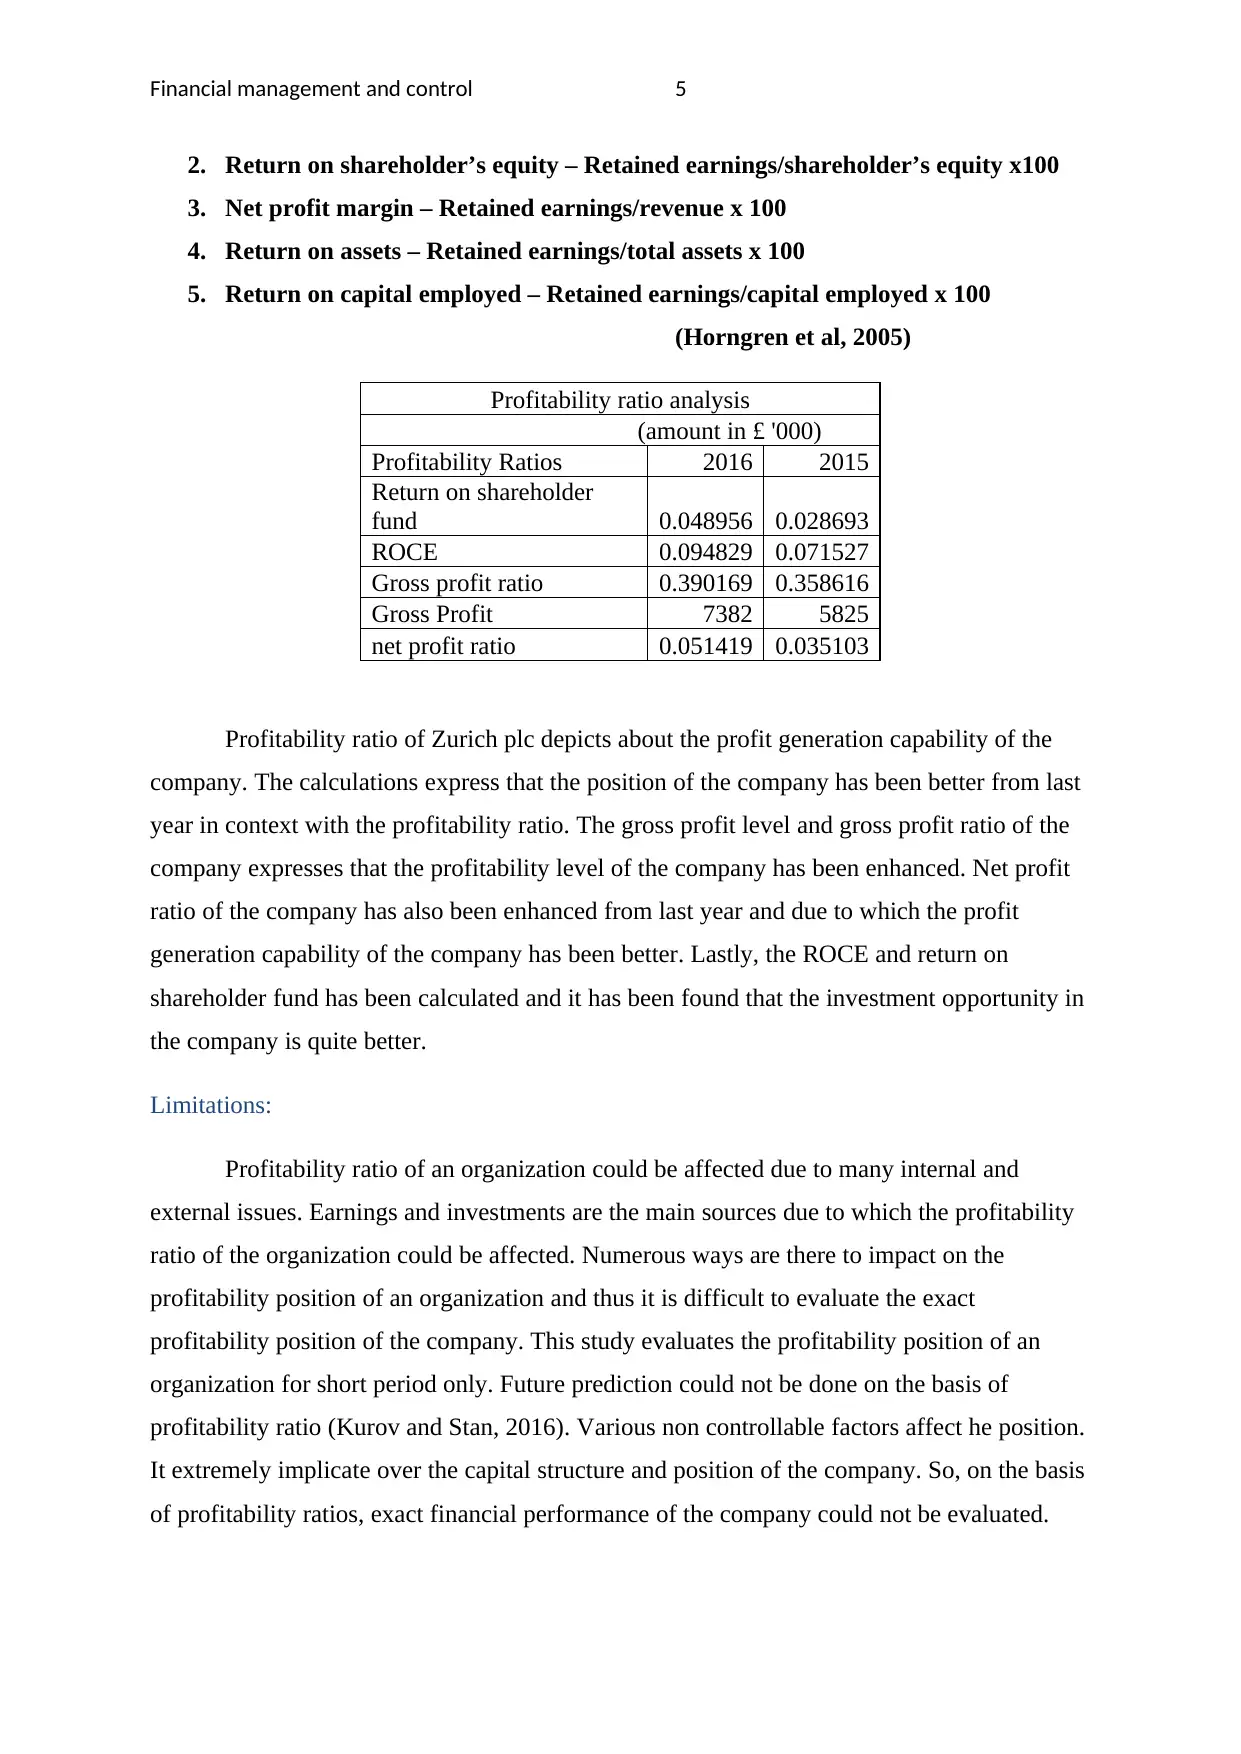
2. Return on shareholder’s equity – Retained earnings/shareholder’s equity x100
3. Net profit margin – Retained earnings/revenue x 100
4. Return on assets – Retained earnings/total assets x 100
5. Return on capital employed – Retained earnings/capital employed x 100
(Horngren et al, 2005)
Profitability ratio analysis
(amount in £ '000)
Profitability Ratios 2016 2015
Return on shareholder
fund 0.048956 0.028693
ROCE 0.094829 0.071527
Gross profit ratio 0.390169 0.358616
Gross Profit 7382 5825
net profit ratio 0.051419 0.035103
Profitability ratio of Zurich plc depicts about the profit generation capability of the
company. The calculations express that the position of the company has been better from last
year in context with the profitability ratio. The gross profit level and gross profit ratio of the
company expresses that the profitability level of the company has been enhanced. Net profit
ratio of the company has also been enhanced from last year and due to which the profit
generation capability of the company has been better. Lastly, the ROCE and return on
shareholder fund has been calculated and it has been found that the investment opportunity in
the company is quite better.
Limitations:
Profitability ratio of an organization could be affected due to many internal and
external issues. Earnings and investments are the main sources due to which the profitability
ratio of the organization could be affected. Numerous ways are there to impact on the
profitability position of an organization and thus it is difficult to evaluate the exact
profitability position of the company. This study evaluates the profitability position of an
organization for short period only. Future prediction could not be done on the basis of
profitability ratio (Kurov and Stan, 2016). Various non controllable factors affect he position.
It extremely implicate over the capital structure and position of the company. So, on the basis
of profitability ratios, exact financial performance of the company could not be evaluated.
Financial management and control 6
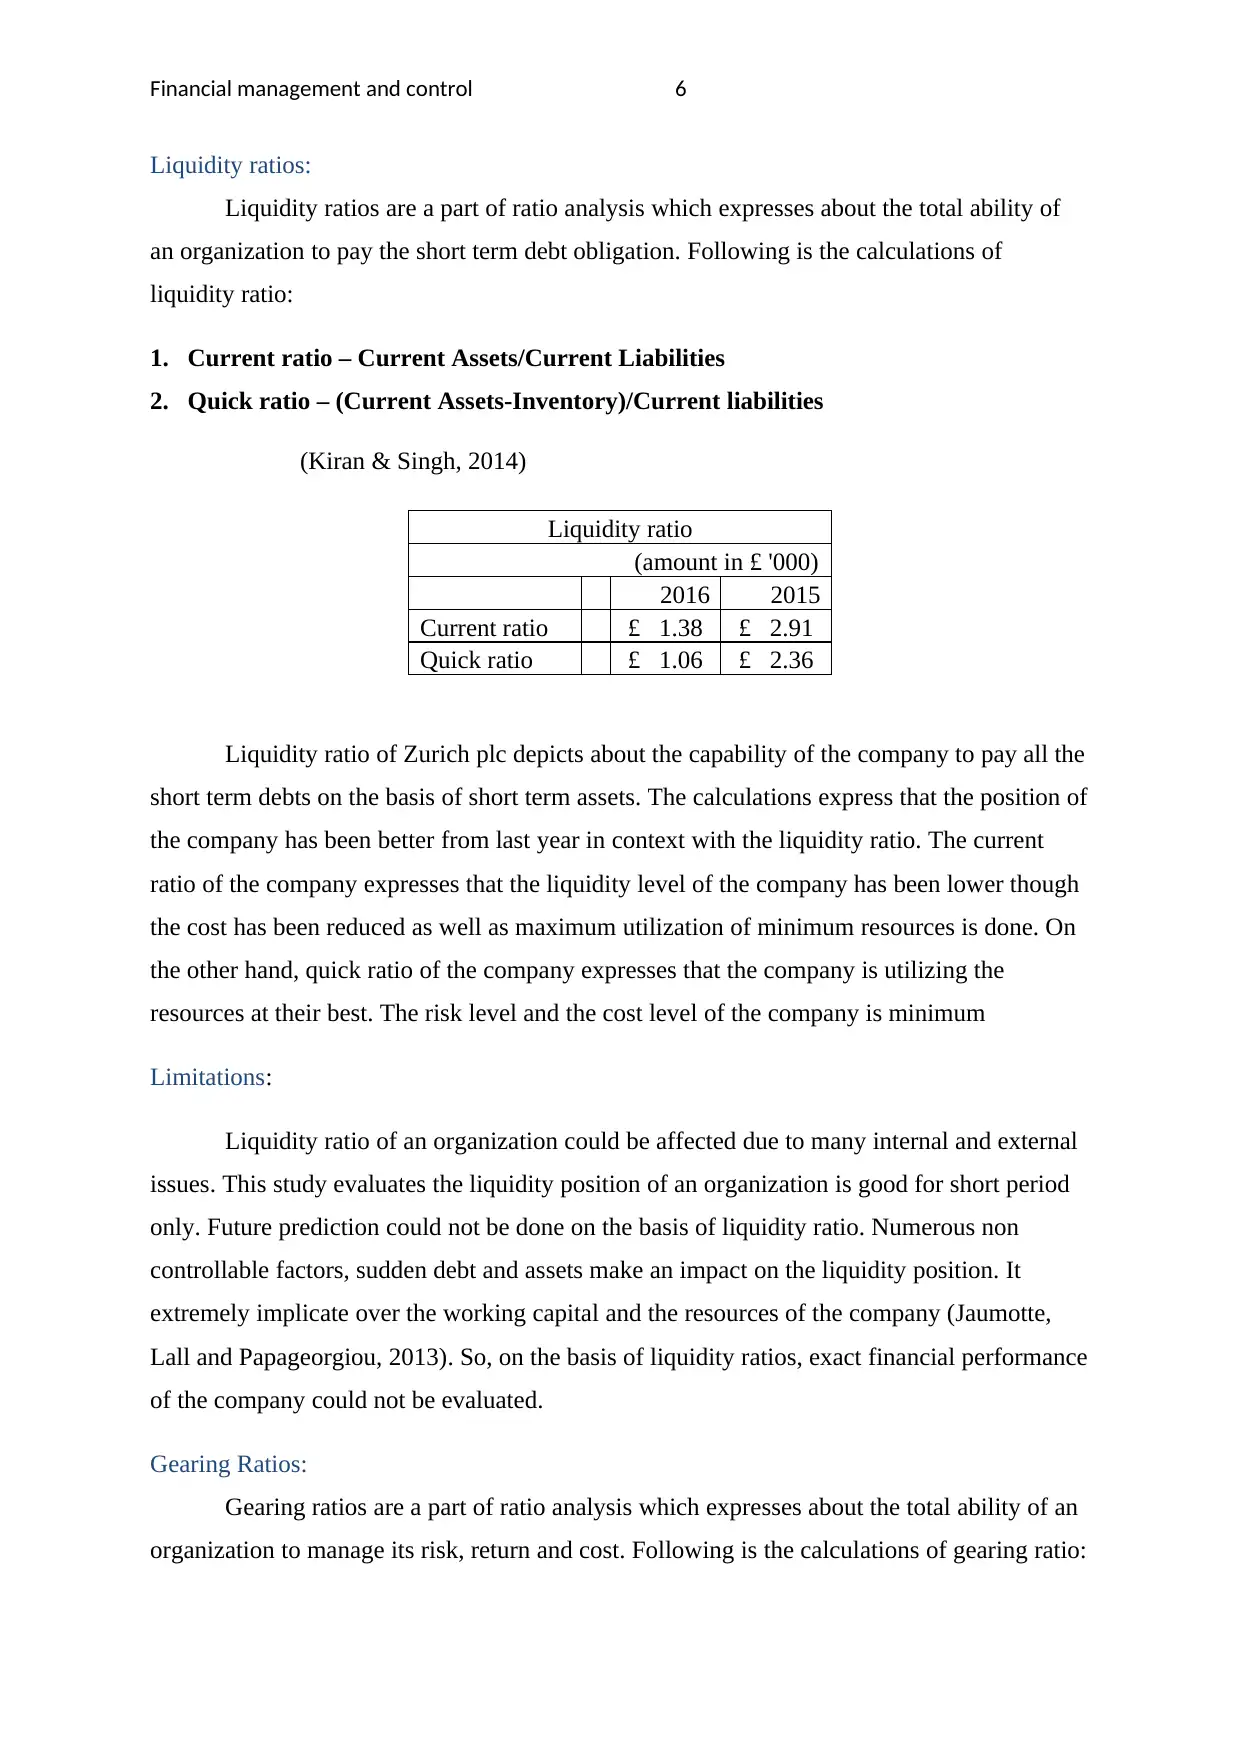
Liquidity ratios:
Liquidity ratios are a part of ratio analysis which expresses about the total ability of
an organization to pay the short term debt obligation. Following is the calculations of
liquidity ratio:
1. Current ratio – Current Assets/Current Liabilities
2. Quick ratio – (Current Assets-Inventory)/Current liabilities
(Kiran & Singh, 2014)
Liquidity ratio
(amount in £ '000)
2016 2015
Current ratio £ 1.38 £ 2.91
Quick ratio £ 1.06 £ 2.36
Liquidity ratio of Zurich plc depicts about the capability of the company to pay all the
short term debts on the basis of short term assets. The calculations express that the position of
the company has been better from last year in context with the liquidity ratio. The current
ratio of the company expresses that the liquidity level of the company has been lower though
the cost has been reduced as well as maximum utilization of minimum resources is done. On
the other hand, quick ratio of the company expresses that the company is utilizing the
resources at their best. The risk level and the cost level of the company is minimum
Limitations:
Liquidity ratio of an organization could be affected due to many internal and external
issues. This study evaluates the liquidity position of an organization is good for short period
only. Future prediction could not be done on the basis of liquidity ratio. Numerous non
controllable factors, sudden debt and assets make an impact on the liquidity position. It
extremely implicate over the working capital and the resources of the company (Jaumotte,
Lall and Papageorgiou, 2013). So, on the basis of liquidity ratios, exact financial performance
of the company could not be evaluated.
Gearing Ratios:
Gearing ratios are a part of ratio analysis which expresses about the total ability of an
organization to manage its risk, return and cost. Following is the calculations of gearing ratio:
⊘ This is a preview!⊘
Do you want full access?
Subscribe today to unlock all pages.
Trusted by 1+ million students worldwide
Financial management and control 7
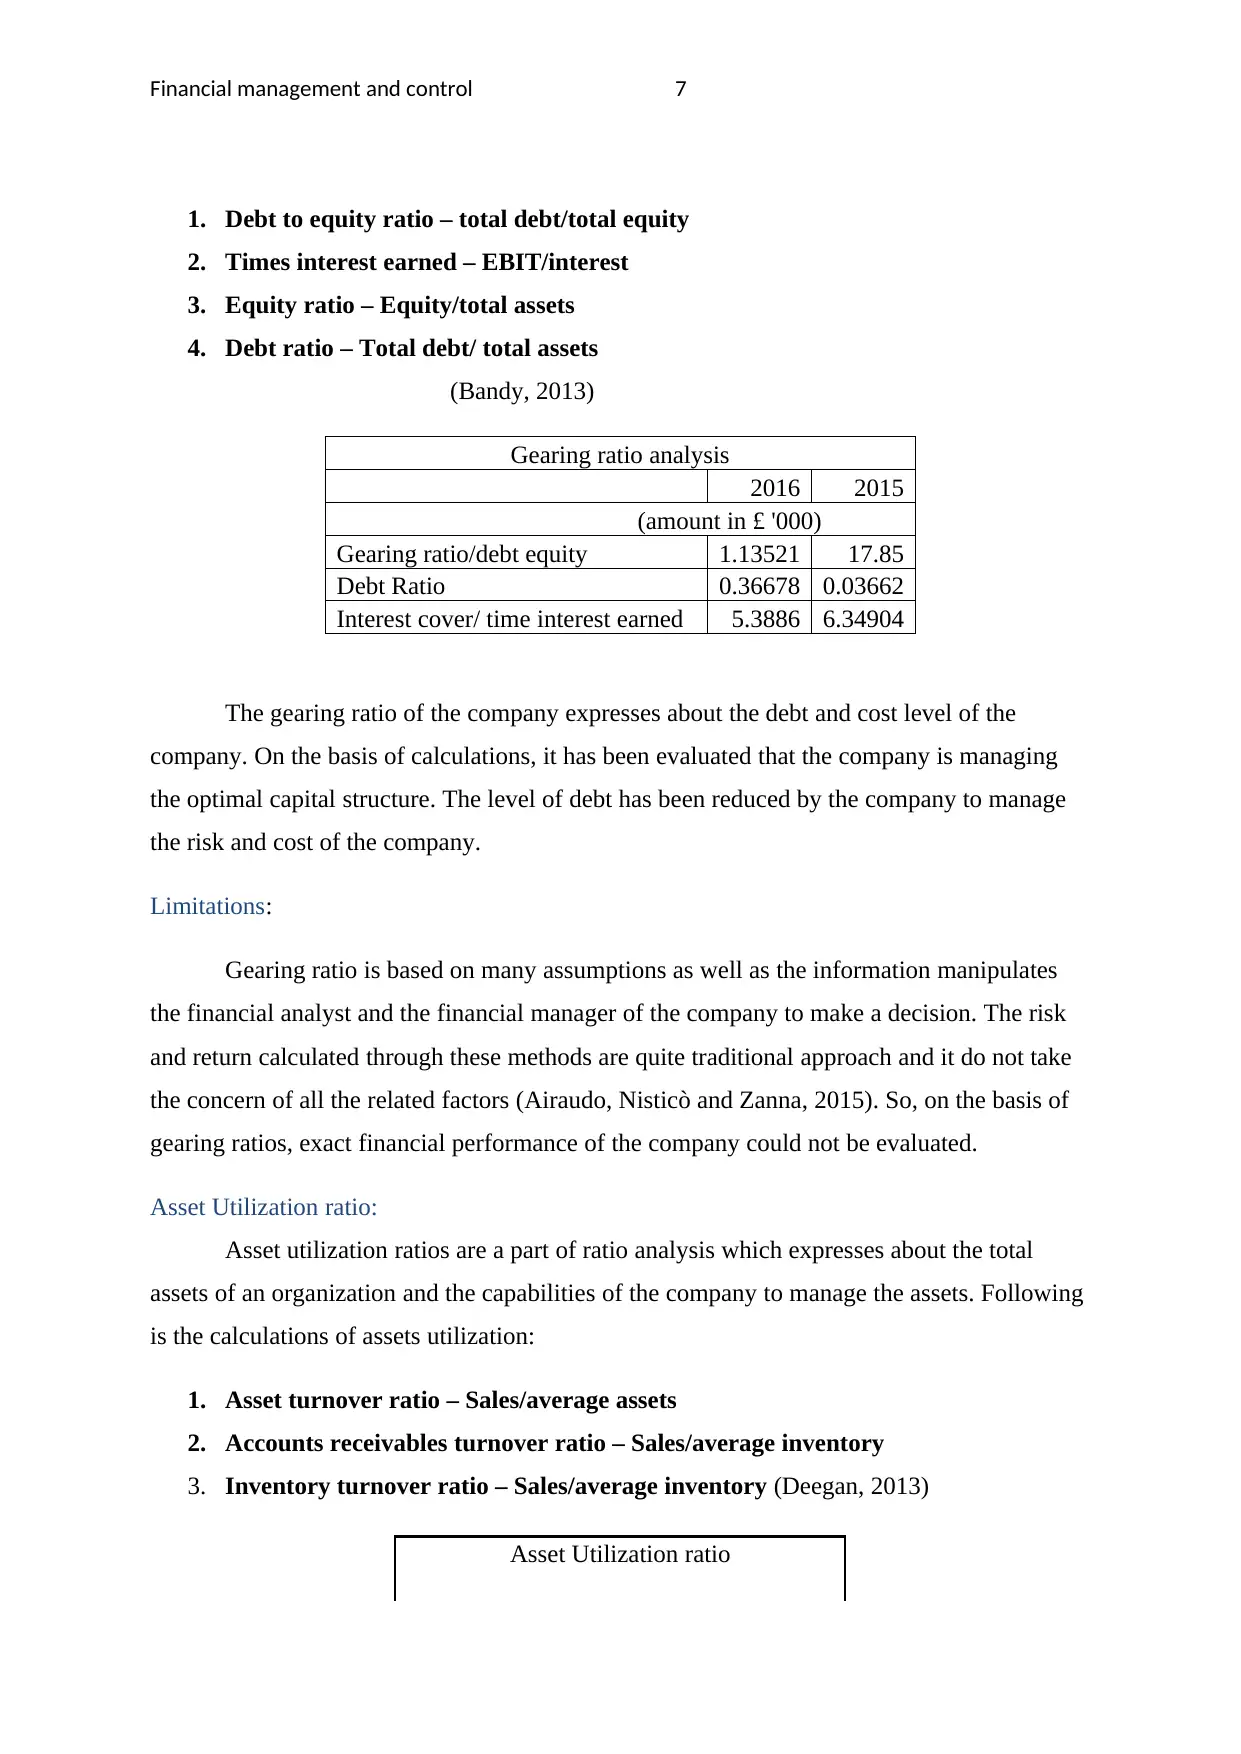
1. Debt to equity ratio – total debt/total equity
2. Times interest earned – EBIT/interest
3. Equity ratio – Equity/total assets
4. Debt ratio – Total debt/ total assets
(Bandy, 2013)
Gearing ratio analysis
2016 2015
(amount in £ '000)
Gearing ratio/debt equity 1.13521 17.85
Debt Ratio 0.36678 0.03662
Interest cover/ time interest earned 5.3886 6.34904
The gearing ratio of the company expresses about the debt and cost level of the
company. On the basis of calculations, it has been evaluated that the company is managing
the optimal capital structure. The level of debt has been reduced by the company to manage
the risk and cost of the company.
Limitations:
Gearing ratio is based on many assumptions as well as the information manipulates
the financial analyst and the financial manager of the company to make a decision. The risk
and return calculated through these methods are quite traditional approach and it do not take
the concern of all the related factors (Airaudo, Nisticò and Zanna, 2015). So, on the basis of
gearing ratios, exact financial performance of the company could not be evaluated.
Asset Utilization ratio:
Asset utilization ratios are a part of ratio analysis which expresses about the total
assets of an organization and the capabilities of the company to manage the assets. Following
is the calculations of assets utilization:
1. Asset turnover ratio – Sales/average assets
2. Accounts receivables turnover ratio – Sales/average inventory
3. Inventory turnover ratio – Sales/average inventory (Deegan, 2013)
Asset Utilization ratio
Paraphrase This Document
Need a fresh take? Get an instant paraphrase of this document with our AI Paraphraser
Financial management and control 8
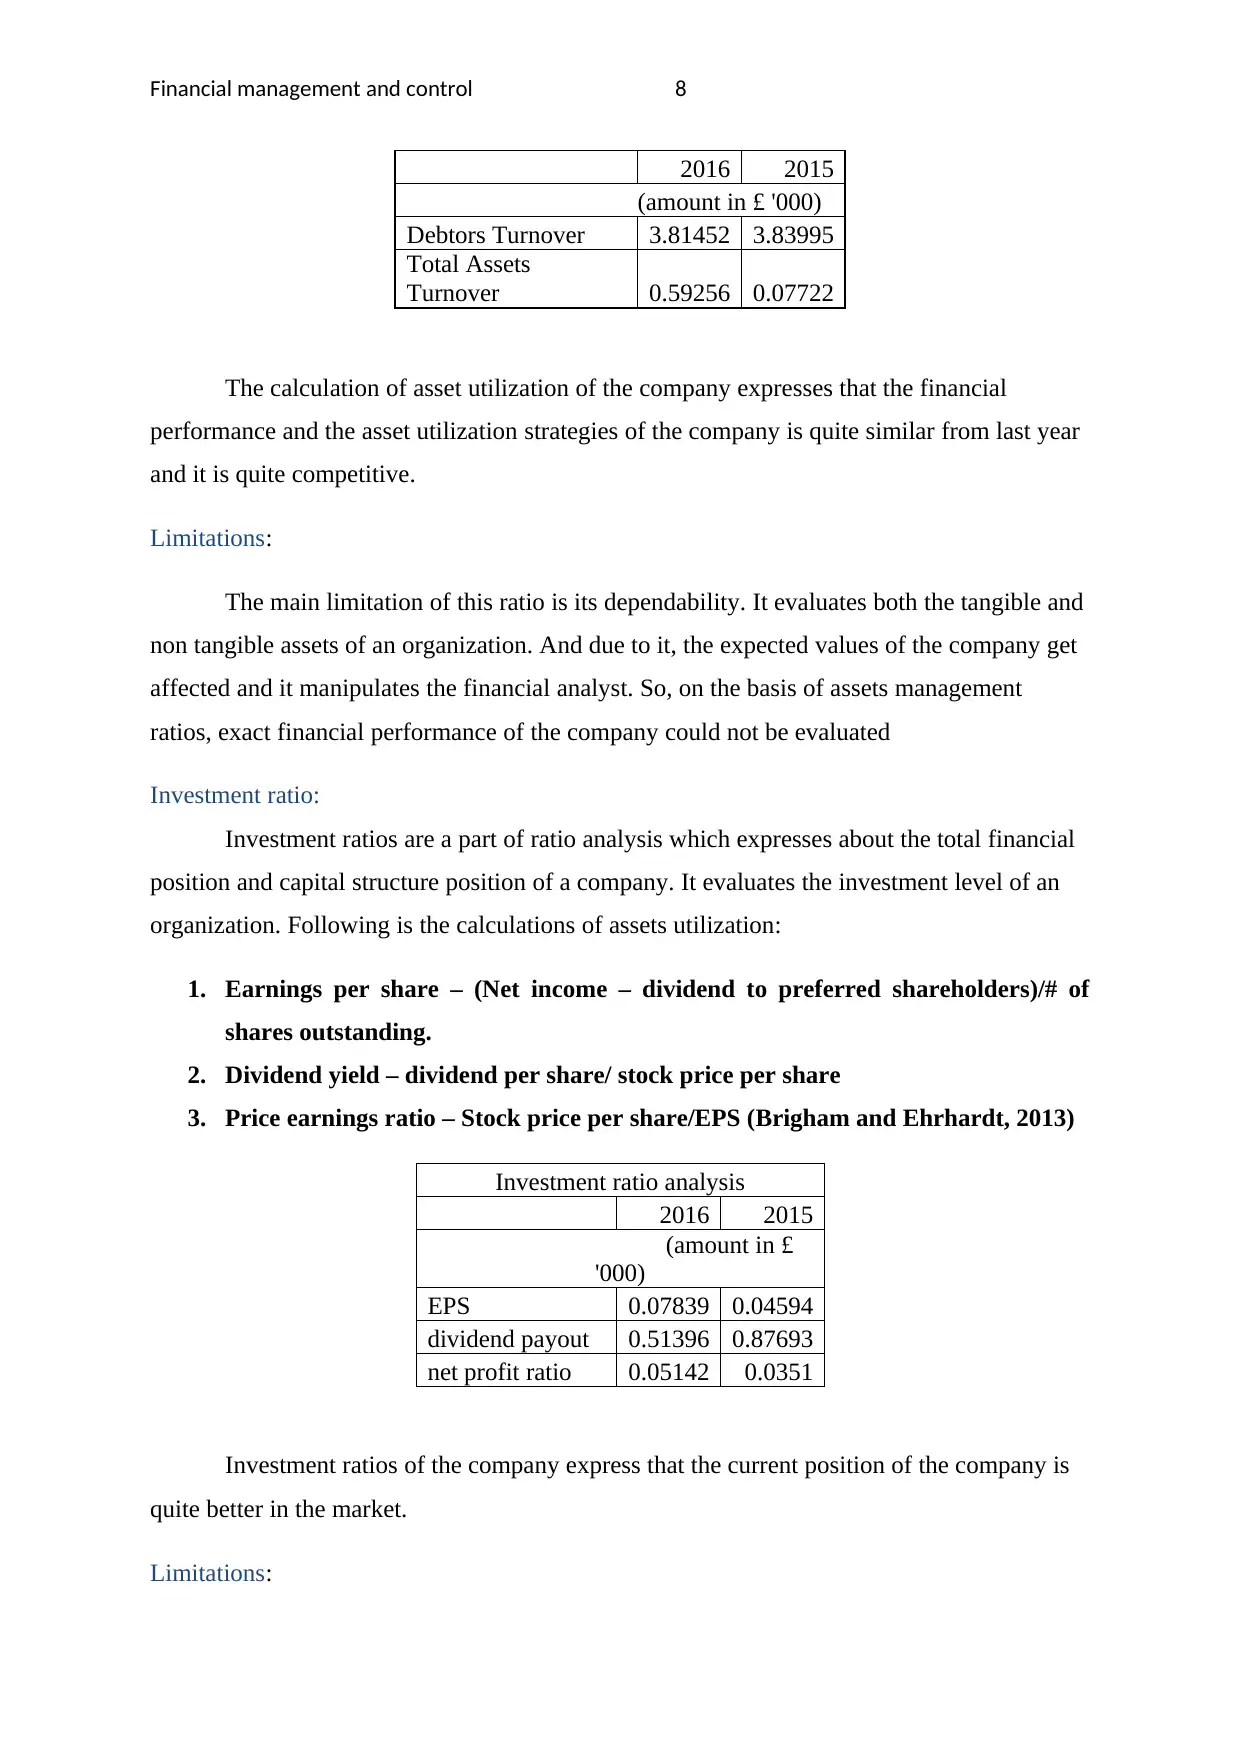
2016 2015
(amount in £ '000)
Debtors Turnover 3.81452 3.83995
Total Assets
Turnover 0.59256 0.07722
The calculation of asset utilization of the company expresses that the financial
performance and the asset utilization strategies of the company is quite similar from last year
and it is quite competitive.
Limitations:
The main limitation of this ratio is its dependability. It evaluates both the tangible and
non tangible assets of an organization. And due to it, the expected values of the company get
affected and it manipulates the financial analyst. So, on the basis of assets management
ratios, exact financial performance of the company could not be evaluated
Investment ratio:
Investment ratios are a part of ratio analysis which expresses about the total financial
position and capital structure position of a company. It evaluates the investment level of an
organization. Following is the calculations of assets utilization:
1. Earnings per share – (Net income – dividend to preferred shareholders)/# of
shares outstanding.
2. Dividend yield – dividend per share/ stock price per share
3. Price earnings ratio – Stock price per share/EPS (Brigham and Ehrhardt, 2013)
Investment ratio analysis
2016 2015
(amount in £
'000)
EPS 0.07839 0.04594
dividend payout 0.51396 0.87693
net profit ratio 0.05142 0.0351
Investment ratios of the company express that the current position of the company is
quite better in the market.
Limitations:
2016 2015
(amount in £ '000)
Debtors Turnover 3.81452 3.83995
Total Assets
Turnover 0.59256 0.07722
The calculation of asset utilization of the company expresses that the financial
performance and the asset utilization strategies of the company is quite similar from last year
and it is quite competitive.
Limitations:
The main limitation of this ratio is its dependability. It evaluates both the tangible and
non tangible assets of an organization. And due to it, the expected values of the company get
affected and it manipulates the financial analyst. So, on the basis of assets management
ratios, exact financial performance of the company could not be evaluated
Investment ratio:
Investment ratios are a part of ratio analysis which expresses about the total financial
position and capital structure position of a company. It evaluates the investment level of an
organization. Following is the calculations of assets utilization:
1. Earnings per share – (Net income – dividend to preferred shareholders)/# of
shares outstanding.
2. Dividend yield – dividend per share/ stock price per share
3. Price earnings ratio – Stock price per share/EPS (Brigham and Ehrhardt, 2013)
Investment ratio analysis
2016 2015
(amount in £
'000)
EPS 0.07839 0.04594
dividend payout 0.51396 0.87693
net profit ratio 0.05142 0.0351
Investment ratios of the company express that the current position of the company is
quite better in the market.
Limitations:

Financial management and control 9
Investment ratio takes the concern of irrelevant information and thus it becomes
difficult for the organization and the financial analyst to reach over a better conclusion about
the investment level of the company. So, on the basis of investment ratios, exact financial
performance of the company could not be evaluated
⊘ This is a preview!⊘
Do you want full access?
Subscribe today to unlock all pages.
Trusted by 1+ million students worldwide
Financial management and control 10
Task 2:
Que a)
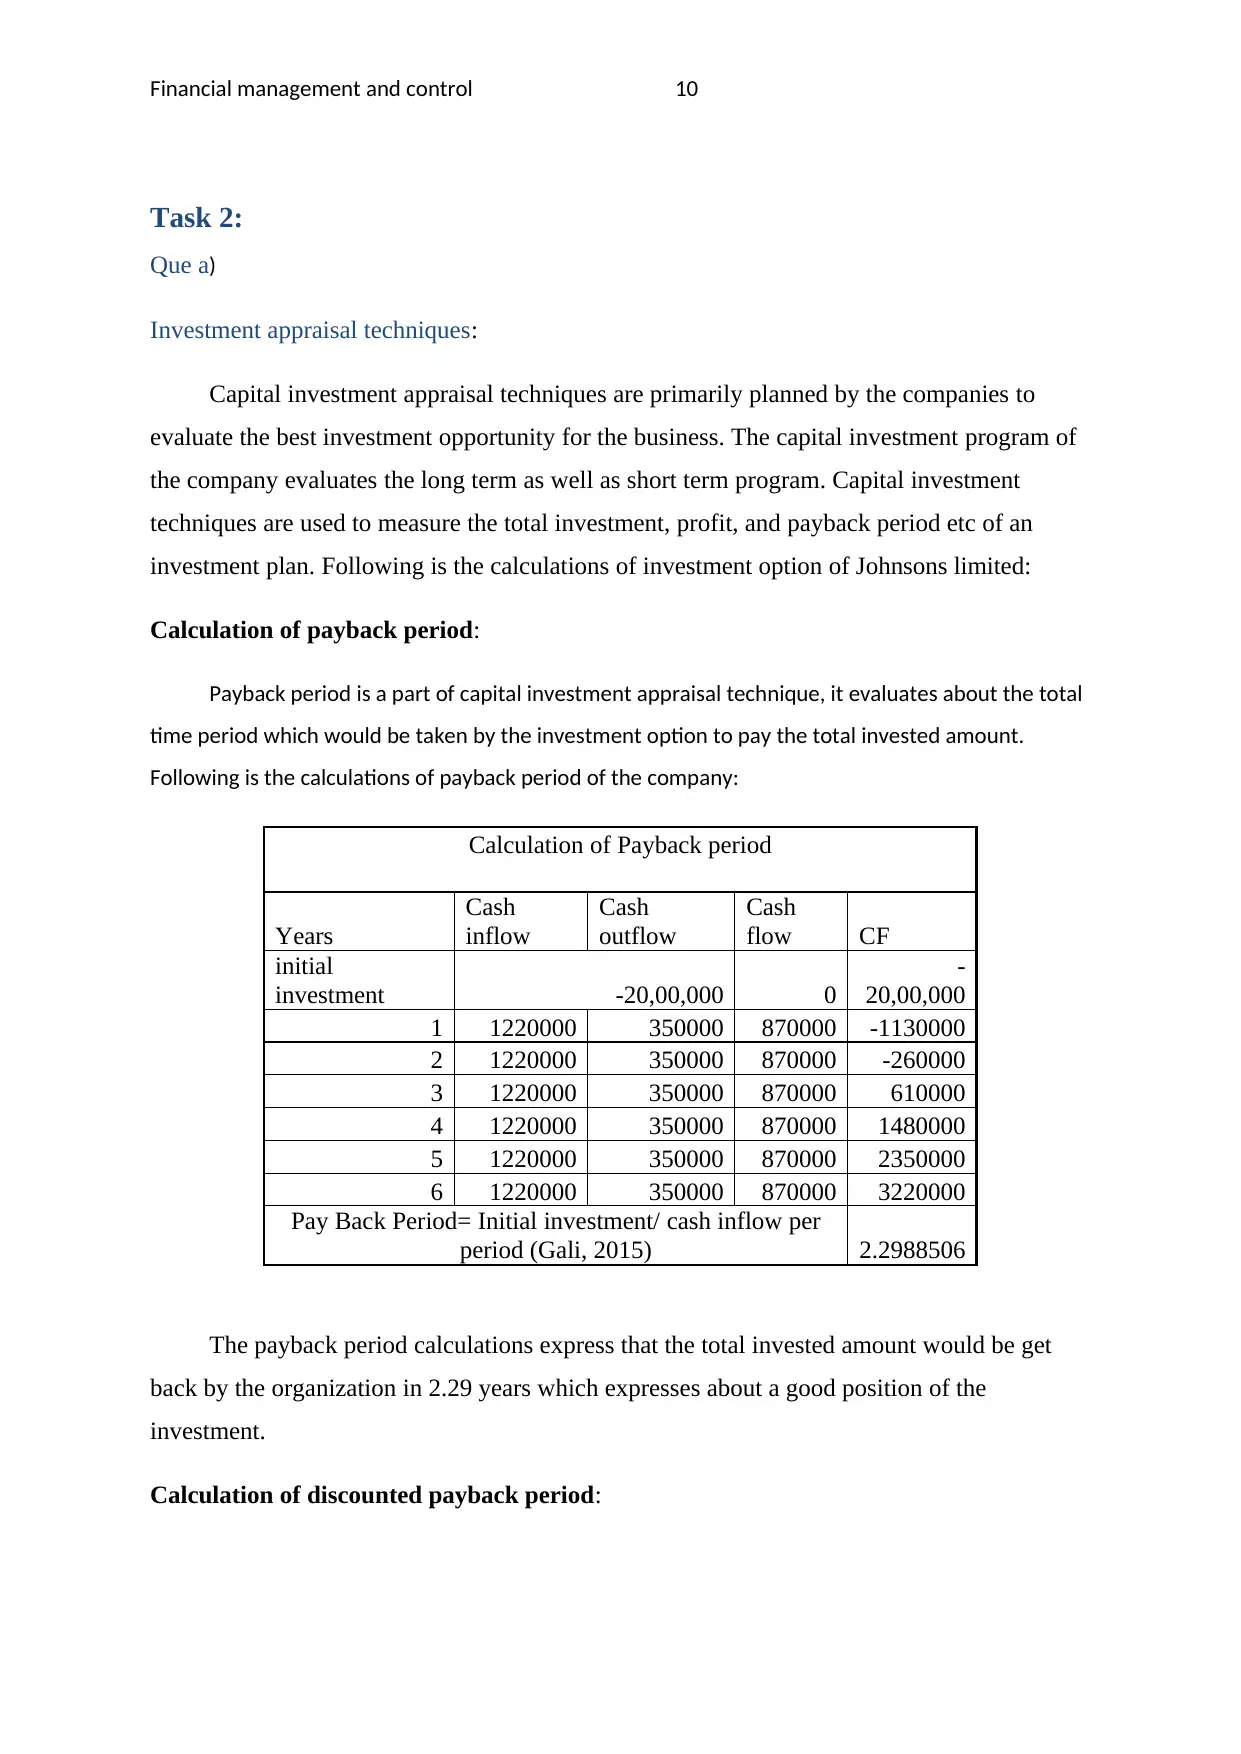
Investment appraisal techniques:
Capital investment appraisal techniques are primarily planned by the companies to
evaluate the best investment opportunity for the business. The capital investment program of
the company evaluates the long term as well as short term program. Capital investment
techniques are used to measure the total investment, profit, and payback period etc of an
investment plan. Following is the calculations of investment option of Johnsons limited:
Calculation of payback period:
Payback period is a part of capital investment appraisal technique, it evaluates about the total
time period which would be taken by the investment option to pay the total invested amount.
Following is the calculations of payback period of the company:
Calculation of Payback period
Years
Cash
inflow
Cash
outflow
Cash
flow CF
initial
investment -20,00,000 0
-
20,00,000
1 1220000 350000 870000 -1130000
2 1220000 350000 870000 -260000
3 1220000 350000 870000 610000
4 1220000 350000 870000 1480000
5 1220000 350000 870000 2350000
6 1220000 350000 870000 3220000
Pay Back Period= Initial investment/ cash inflow per
period (Gali, 2015) 2.2988506
The payback period calculations express that the total invested amount would be get
back by the organization in 2.29 years which expresses about a good position of the
investment.
Calculation of discounted payback period:
Task 2:
Que a)
Investment appraisal techniques:
Capital investment appraisal techniques are primarily planned by the companies to
evaluate the best investment opportunity for the business. The capital investment program of
the company evaluates the long term as well as short term program. Capital investment
techniques are used to measure the total investment, profit, and payback period etc of an
investment plan. Following is the calculations of investment option of Johnsons limited:
Calculation of payback period:
Payback period is a part of capital investment appraisal technique, it evaluates about the total
time period which would be taken by the investment option to pay the total invested amount.
Following is the calculations of payback period of the company:
Calculation of Payback period
Years
Cash
inflow
Cash
outflow
Cash
flow CF
initial
investment -20,00,000 0
-
20,00,000
1 1220000 350000 870000 -1130000
2 1220000 350000 870000 -260000
3 1220000 350000 870000 610000
4 1220000 350000 870000 1480000
5 1220000 350000 870000 2350000
6 1220000 350000 870000 3220000
Pay Back Period= Initial investment/ cash inflow per
period (Gali, 2015) 2.2988506
The payback period calculations express that the total invested amount would be get
back by the organization in 2.29 years which expresses about a good position of the
investment.
Calculation of discounted payback period:
Paraphrase This Document
Need a fresh take? Get an instant paraphrase of this document with our AI Paraphraser
Financial management and control 11
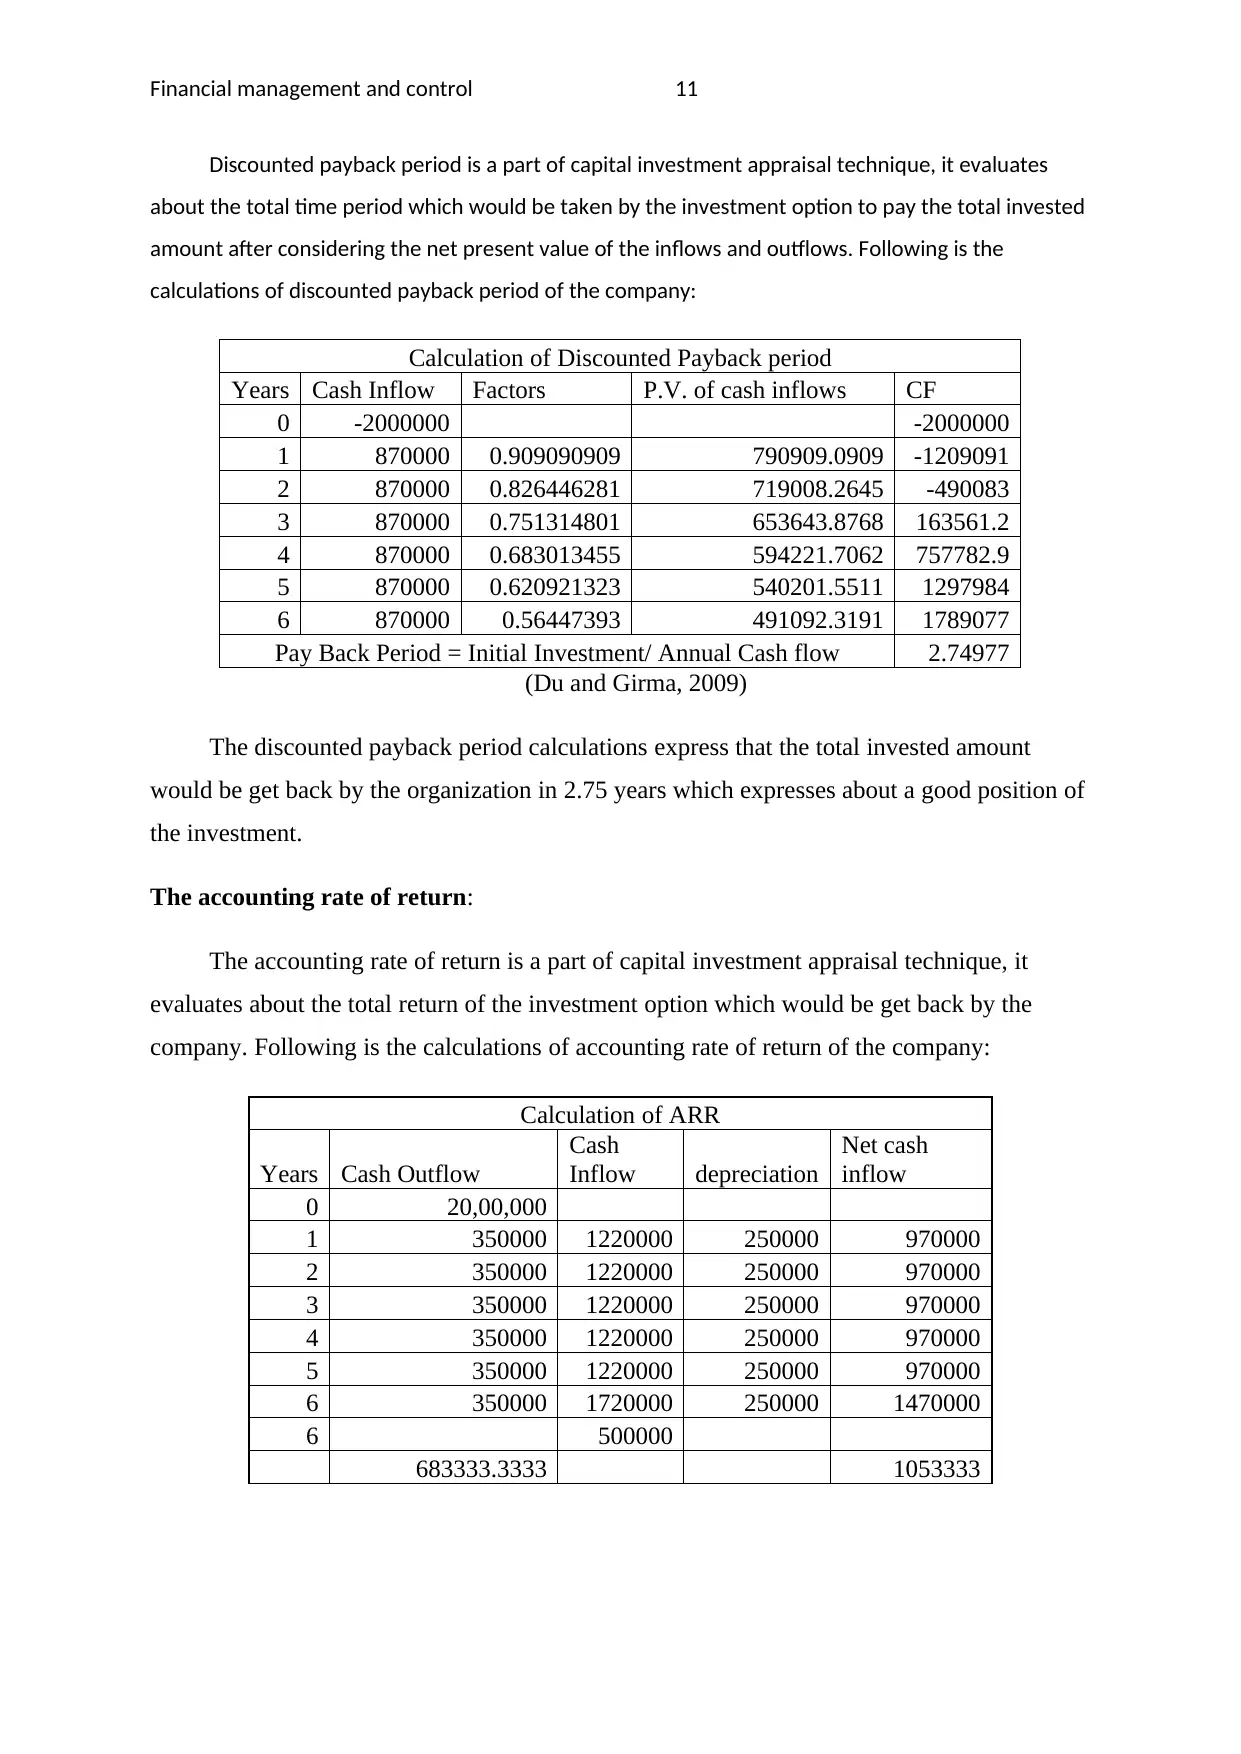
Discounted payback period is a part of capital investment appraisal technique, it evaluates
about the total time period which would be taken by the investment option to pay the total invested
amount after considering the net present value of the inflows and outflows. Following is the
calculations of discounted payback period of the company:
Calculation of Discounted Payback period
Years Cash Inflow Factors P.V. of cash inflows CF
0 -2000000 -2000000
1 870000 0.909090909 790909.0909 -1209091
2 870000 0.826446281 719008.2645 -490083
3 870000 0.751314801 653643.8768 163561.2
4 870000 0.683013455 594221.7062 757782.9
5 870000 0.620921323 540201.5511 1297984
6 870000 0.56447393 491092.3191 1789077
Pay Back Period = Initial Investment/ Annual Cash flow 2.74977
(Du and Girma, 2009)
The discounted payback period calculations express that the total invested amount
would be get back by the organization in 2.75 years which expresses about a good position of
the investment.
The accounting rate of return:
The accounting rate of return is a part of capital investment appraisal technique, it
evaluates about the total return of the investment option which would be get back by the
company. Following is the calculations of accounting rate of return of the company:
Calculation of ARR
Years Cash Outflow
Cash
Inflow depreciation
Net cash
inflow
0 20,00,000
1 350000 1220000 250000 970000
2 350000 1220000 250000 970000
3 350000 1220000 250000 970000
4 350000 1220000 250000 970000
5 350000 1220000 250000 970000
6 350000 1720000 250000 1470000
6 500000
683333.3333 1053333
Financial management and control 12
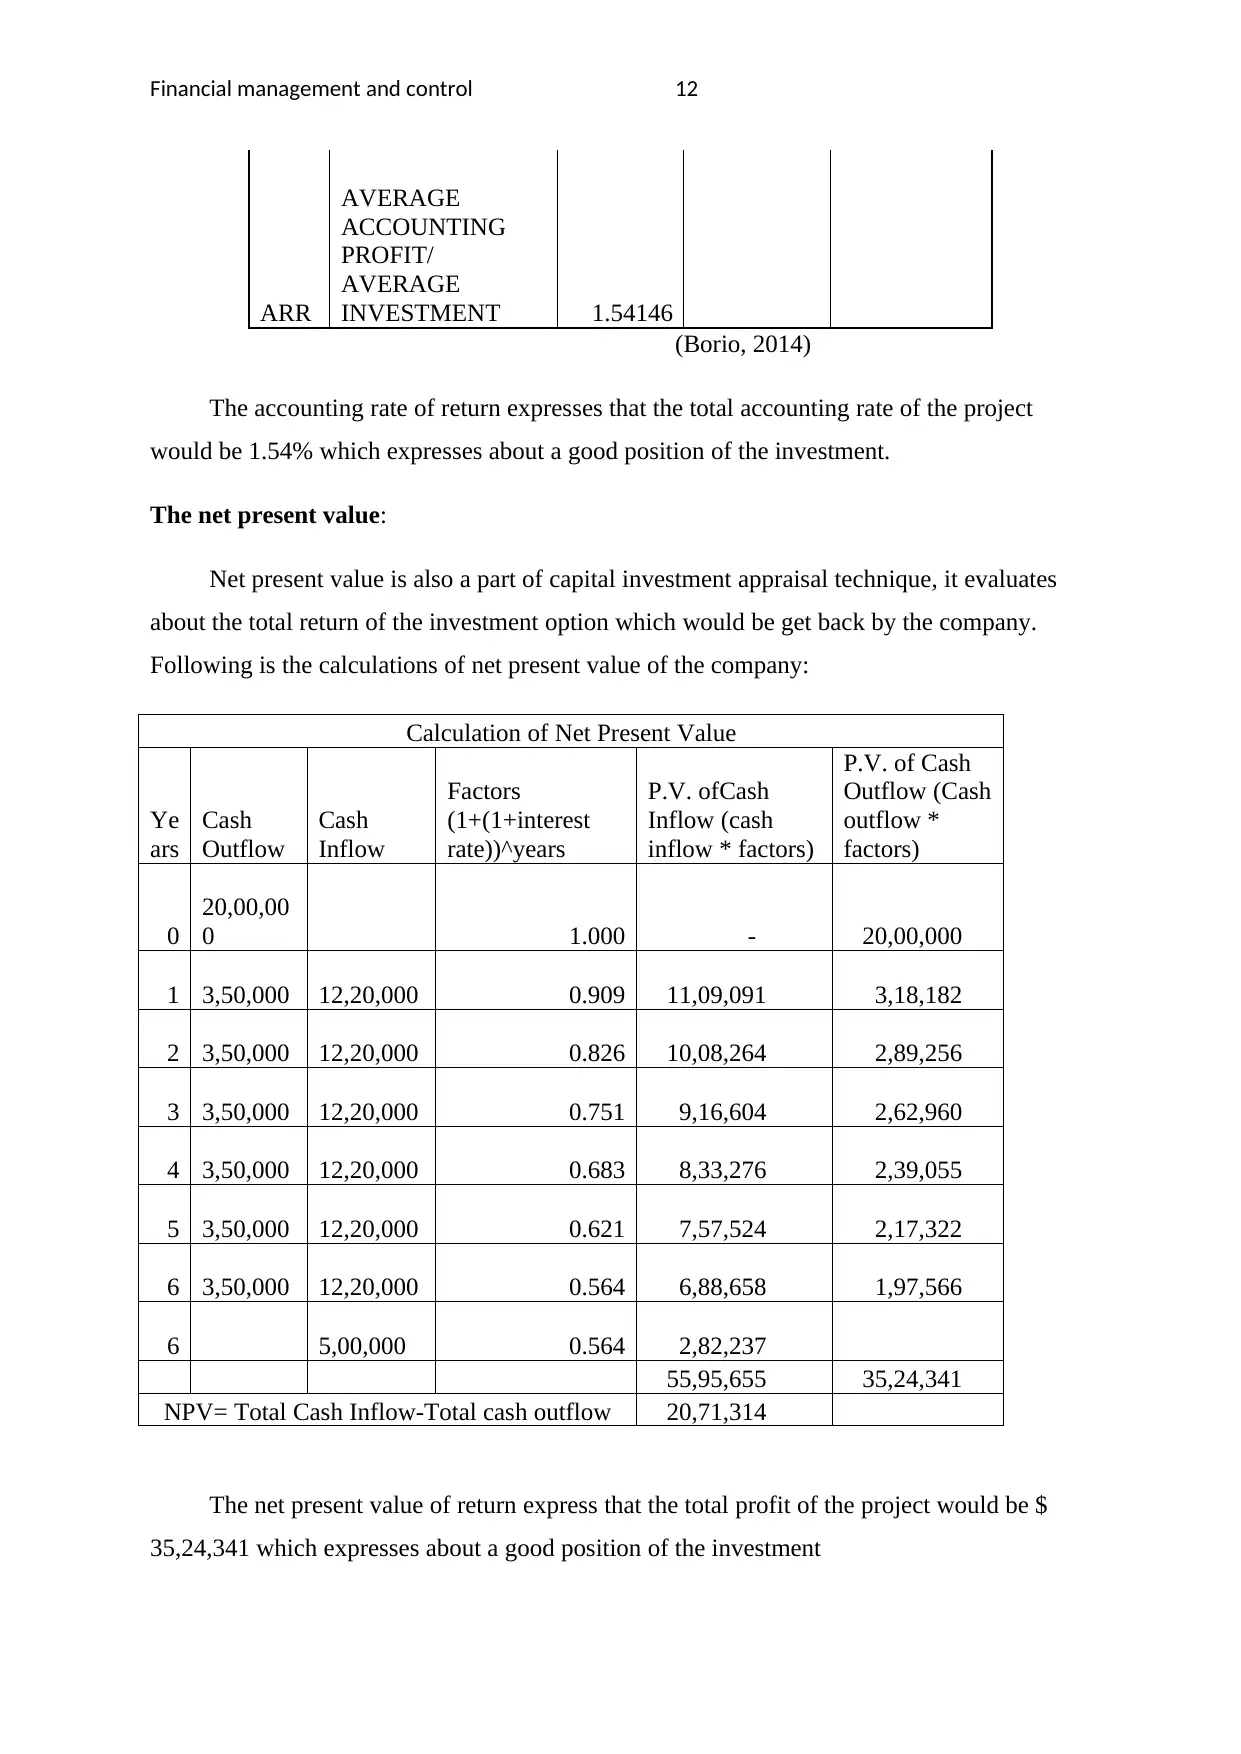
ARR
AVERAGE
ACCOUNTING
PROFIT/
AVERAGE
INVESTMENT 1.54146
(Borio, 2014)
The accounting rate of return expresses that the total accounting rate of the project
would be 1.54% which expresses about a good position of the investment.
The net present value:
Net present value is also a part of capital investment appraisal technique, it evaluates
about the total return of the investment option which would be get back by the company.
Following is the calculations of net present value of the company:
Calculation of Net Present Value
Ye
ars
Cash
Outflow
Cash
Inflow
Factors
(1+(1+interest
rate))^years
P.V. ofCash
Inflow (cash
inflow * factors)
P.V. of Cash
Outflow (Cash
outflow *
factors)
0
20,00,00
0 1.000 - 20,00,000
1 3,50,000 12,20,000 0.909 11,09,091 3,18,182
2 3,50,000 12,20,000 0.826 10,08,264 2,89,256
3 3,50,000 12,20,000 0.751 9,16,604 2,62,960
4 3,50,000 12,20,000 0.683 8,33,276 2,39,055
5 3,50,000 12,20,000 0.621 7,57,524 2,17,322
6 3,50,000 12,20,000 0.564 6,88,658 1,97,566
6 5,00,000 0.564 2,82,237
55,95,655 35,24,341
NPV= Total Cash Inflow-Total cash outflow 20,71,314
The net present value of return express that the total profit of the project would be $
35,24,341 which expresses about a good position of the investment
⊘ This is a preview!⊘
Do you want full access?
Subscribe today to unlock all pages.
Trusted by 1+ million students worldwide
1 out of 23
Related Documents


Your All-in-One AI-Powered Toolkit for Academic Success.
+13062052269
info@desklib.com
Available 24*7 on WhatsApp / Email
![[object Object]](/_next/static/media/star-bottom.7253800d.svg)
Unlock your academic potential
Copyright © 2020–2026 A2Z Services. All Rights Reserved. Developed and managed by ZUCOL.