RMIT ACCT2127 Assignment 2: Financial Performance Evaluation
VerifiedAdded on 2021/06/02
|11
|2728
|80
Homework Assignment
AI Summary
This document presents a comprehensive solution to an ACCT2127 assignment, focusing on accounting for management decisions at RMIT University. The assignment covers several key areas of financial analysis. Question one involves investment appraisal, including calculating and comparing the Average Rate of Return (ARR), Payback Period, and Net Present Value (NPV) for different project proposals. The solution ranks projects based on these metrics and discusses the advantages and disadvantages of NPV. Question two analyzes the income statement and cash flow statement, explaining the differences between operating cash flow and financial performance. Question three explores flexed budgets, analyzing the impact of various factors on actual outcomes and calculating variances. The solution provides a detailed budget reconciliation and explains the implications of each variance. Finally, question four examines the decision-making process for pricing strategies and the importance of considering stakeholders beyond shareholders. The solution offers a clear understanding of financial concepts and decision-making.
Cover sheet for submission of work for assessment 1111 page 1 of 1
Cover sheet for submission of
work for assessment
SCHOOL: RMIT University
Program name Master of Business
Information Technology Program code MC200P15 Office use only
School date stamp
Course/unit name Accounting for
Management Decision Course/unit code ACCT2127
TAFE National Module Unit
of Competency (UOC) name
TAFE National Module Unit
of Competency (UOC) ID
Assignment no.
2 (version 2)
Due date 21st October
2019 Name of lecturer/teacher Cameron Nichol
Campus Class day/time Wednesday –
6:30 PM Tutor/marker’s name
STUDENT/S
Family name Given name Student number
LY TRONG TIEN S3790425
DECLARATION AND STATEMENT OF AUTHORSHIP
1. I/we hold a copy of this work which can be produced if the original is lost/damaged.
2. This work is my/our original work and no part of it has been copied from any other student’s work or from any other source except where due
acknowledgement is made.
3. No part of this work has been written for me/us by any other person except where such collaboration has been authorised by the lecturer/teacher
concerned.
4. I/we have not previously submitted this work for this or any other course/unit.
5. I/we give permission for this work to be reproduced, communicated, compared and archived for the purpose of detecting plagiarism.
6. I/we give permission for a copy of my/our marked work to be retained by the school for review and comparison, including review by external
examiners.
I/we understand that:
7. Plagiarism is the presentation of the work, idea or creation of another person as though it is my/our own. It is a form of cheating and is a very serious
academic offence that may lead to exclusion from the University. Plagiarised material can be drawn from, and presented in, written, graphic and
visual form, including electronic data and oral presentations. Plagiarism occurs when the origin of the material used is not appropriately cited.
8. Plagiarism includes the act of assisting or allowing another person to plagiarise or to copy my/our work.
Student signature/s
I/we declare that I/we have read and understood the declaration and statement of authorship.
Further information relating to the penalties for plagiarism, which range from a notation on your student file to expulsion from the University, is contained
in Regulation 6.1.1 Student Discipline and the Plagiarism Policy which are available on the Policies and Procedures website at
www.rmit.edu.au/policies.
Copies of this form can be downloaded from the student forms web page at www.rmit.edu.au/students/forms.
1
Paraphrase This Document
Need a fresh take? Get an instant paraphrase of this document with our AI Paraphraser
QUESTION ONE
(a)
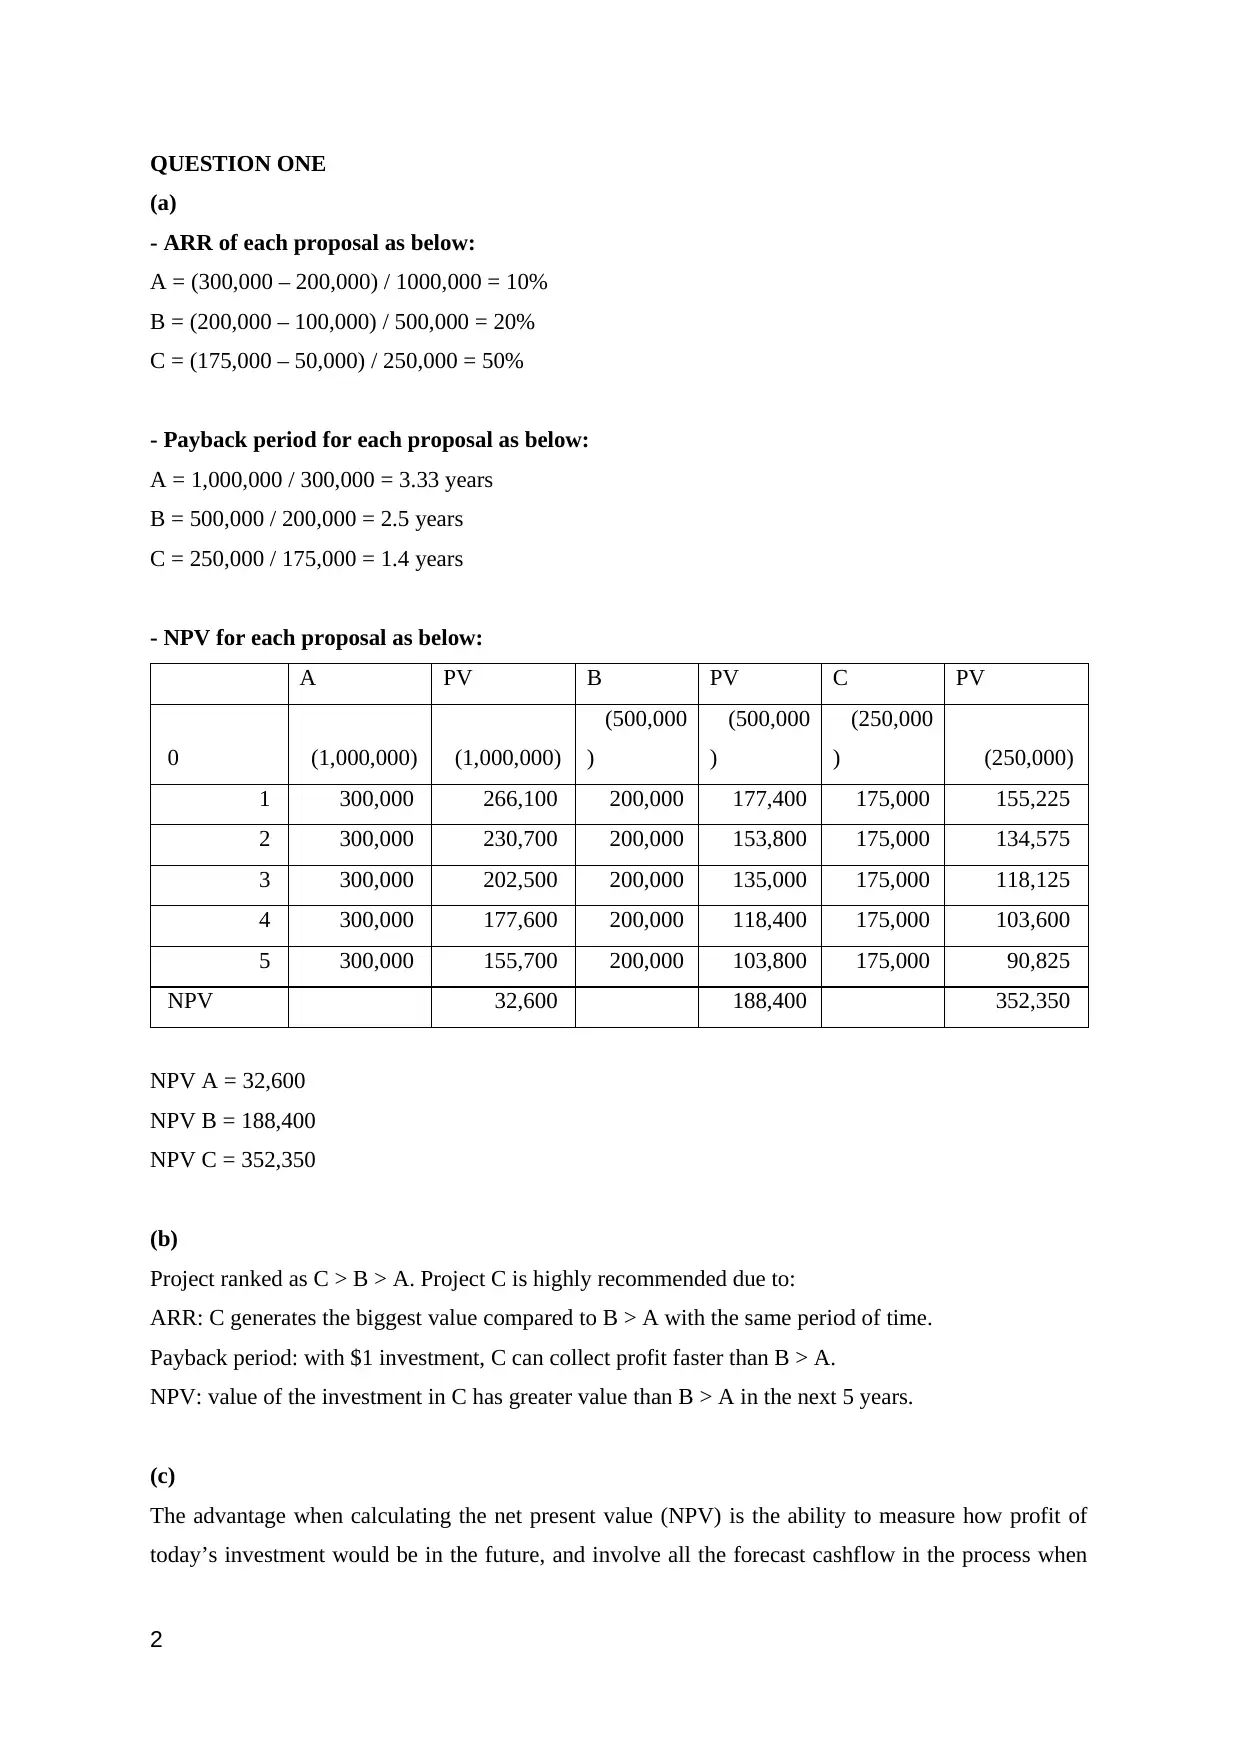
- ARR of each proposal as below:
A = (300,000 – 200,000) / 1000,000 = 10%
B = (200,000 – 100,000) / 500,000 = 20%
C = (175,000 – 50,000) / 250,000 = 50%
- Payback period for each proposal as below:
A = 1,000,000 / 300,000 = 3.33 years
B = 500,000 / 200,000 = 2.5 years
C = 250,000 / 175,000 = 1.4 years
- NPV for each proposal as below:
A PV B PV C PV
0 (1,000,000) (1,000,000)
(500,000
)
(500,000
)
(250,000
) (250,000)
1 300,000 266,100 200,000 177,400 175,000 155,225
2 300,000 230,700 200,000 153,800 175,000 134,575
3 300,000 202,500 200,000 135,000 175,000 118,125
4 300,000 177,600 200,000 118,400 175,000 103,600
5 300,000 155,700 200,000 103,800 175,000 90,825
NPV 32,600 188,400 352,350
NPV A = 32,600
NPV B = 188,400
NPV C = 352,350
(b)
Project ranked as C > B > A. Project C is highly recommended due to:
ARR: C generates the biggest value compared to B > A with the same period of time.
Payback period: with $1 investment, C can collect profit faster than B > A.
NPV: value of the investment in C has greater value than B > A in the next 5 years.
(c)
The advantage when calculating the net present value (NPV) is the ability to measure how profit of
today’s investment would be in the future, and involve all the forecast cashflow in the process when
2
(a)
- ARR of each proposal as below:
A = (300,000 – 200,000) / 1000,000 = 10%
B = (200,000 – 100,000) / 500,000 = 20%
C = (175,000 – 50,000) / 250,000 = 50%
- Payback period for each proposal as below:
A = 1,000,000 / 300,000 = 3.33 years
B = 500,000 / 200,000 = 2.5 years
C = 250,000 / 175,000 = 1.4 years
- NPV for each proposal as below:
A PV B PV C PV
0 (1,000,000) (1,000,000)
(500,000
)
(500,000
)
(250,000
) (250,000)
1 300,000 266,100 200,000 177,400 175,000 155,225
2 300,000 230,700 200,000 153,800 175,000 134,575
3 300,000 202,500 200,000 135,000 175,000 118,125
4 300,000 177,600 200,000 118,400 175,000 103,600
5 300,000 155,700 200,000 103,800 175,000 90,825
NPV 32,600 188,400 352,350
NPV A = 32,600
NPV B = 188,400
NPV C = 352,350
(b)
Project ranked as C > B > A. Project C is highly recommended due to:
ARR: C generates the biggest value compared to B > A with the same period of time.
Payback period: with $1 investment, C can collect profit faster than B > A.
NPV: value of the investment in C has greater value than B > A in the next 5 years.
(c)
The advantage when calculating the net present value (NPV) is the ability to measure how profit of
today’s investment would be in the future, and involve all the forecast cashflow in the process when
2
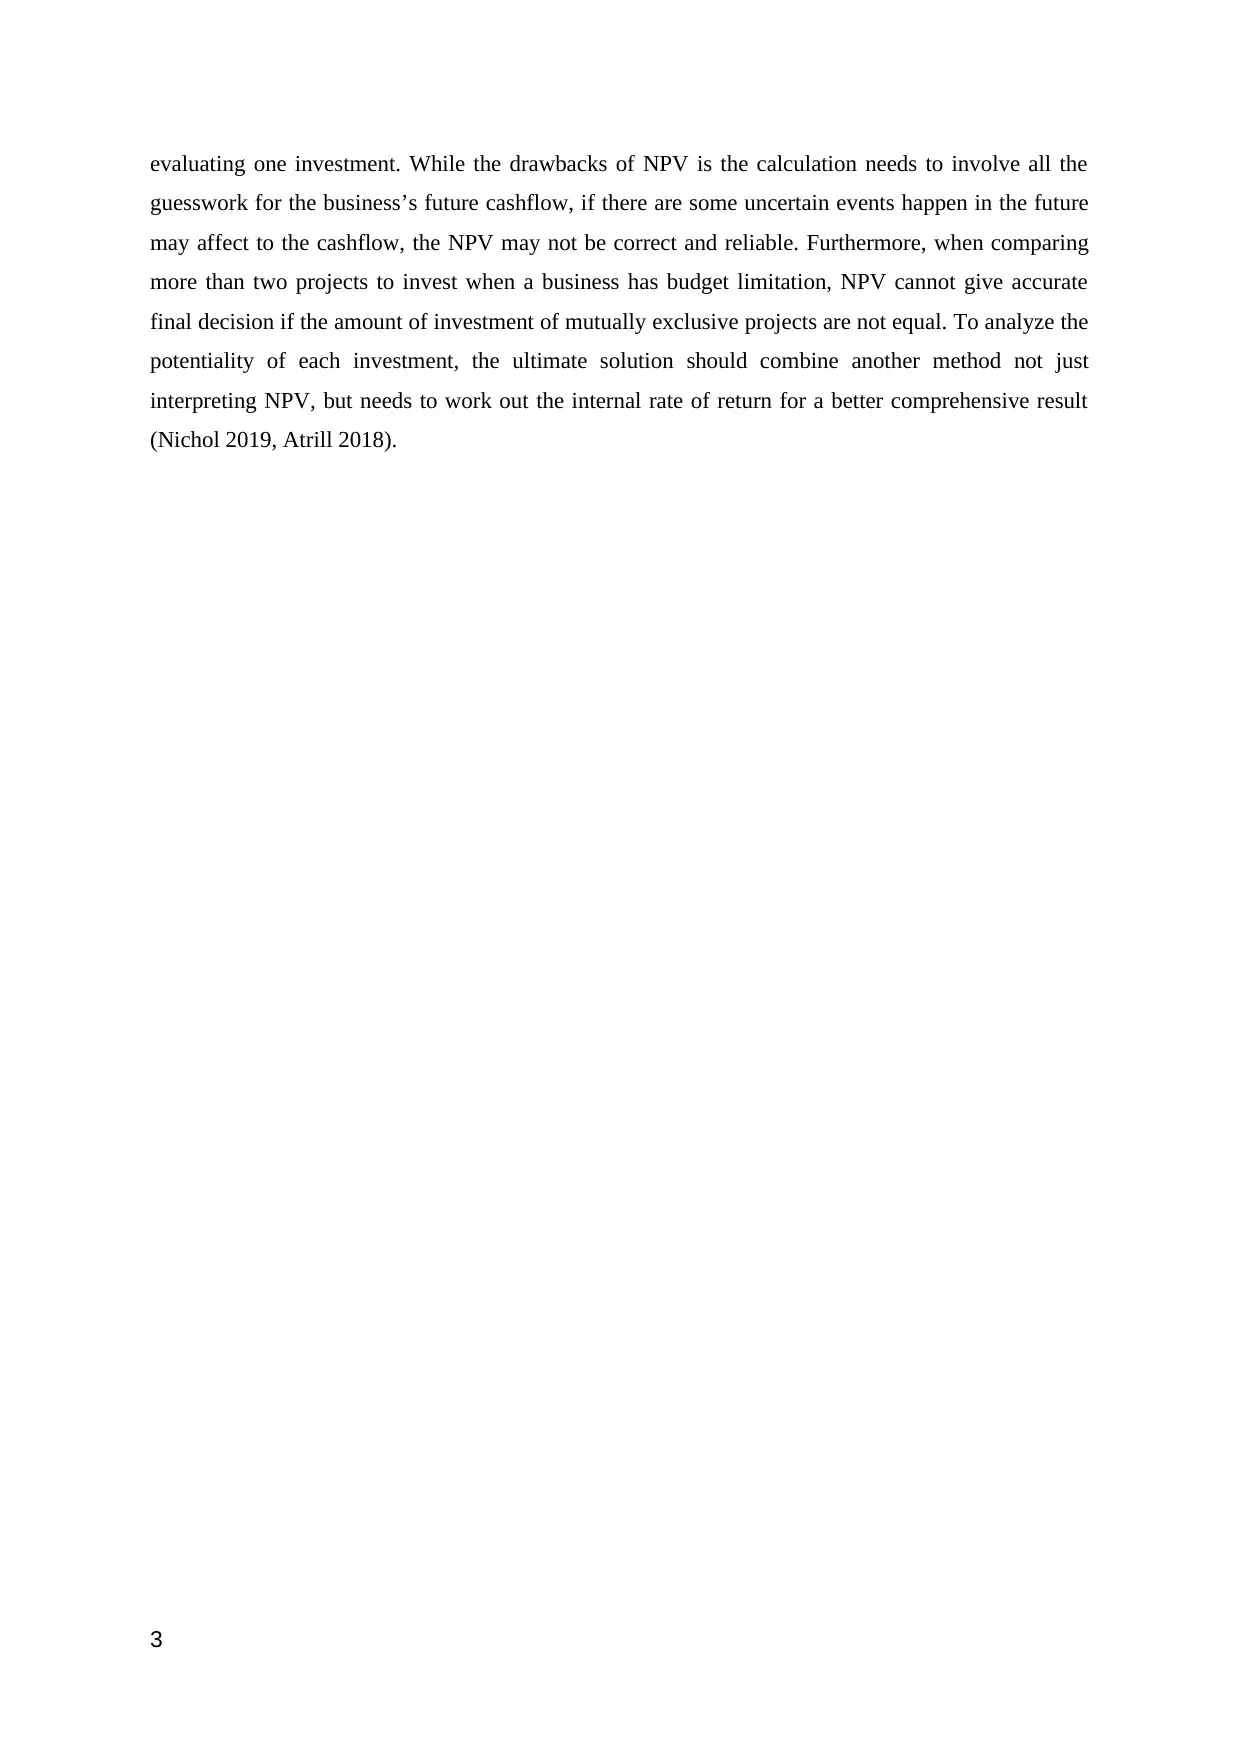
evaluating one investment. While the drawbacks of NPV is the calculation needs to involve all the
guesswork for the business’s future cashflow, if there are some uncertain events happen in the future
may affect to the cashflow, the NPV may not be correct and reliable. Furthermore, when comparing
more than two projects to invest when a business has budget limitation, NPV cannot give accurate
final decision if the amount of investment of mutually exclusive projects are not equal. To analyze the
potentiality of each investment, the ultimate solution should combine another method not just
interpreting NPV, but needs to work out the internal rate of return for a better comprehensive result
(Nichol 2019, Atrill 2018).
3
⊘ This is a preview!⊘
Do you want full access?
Subscribe today to unlock all pages.
Trusted by 1+ million students worldwide
QUESTION TWO
(a)
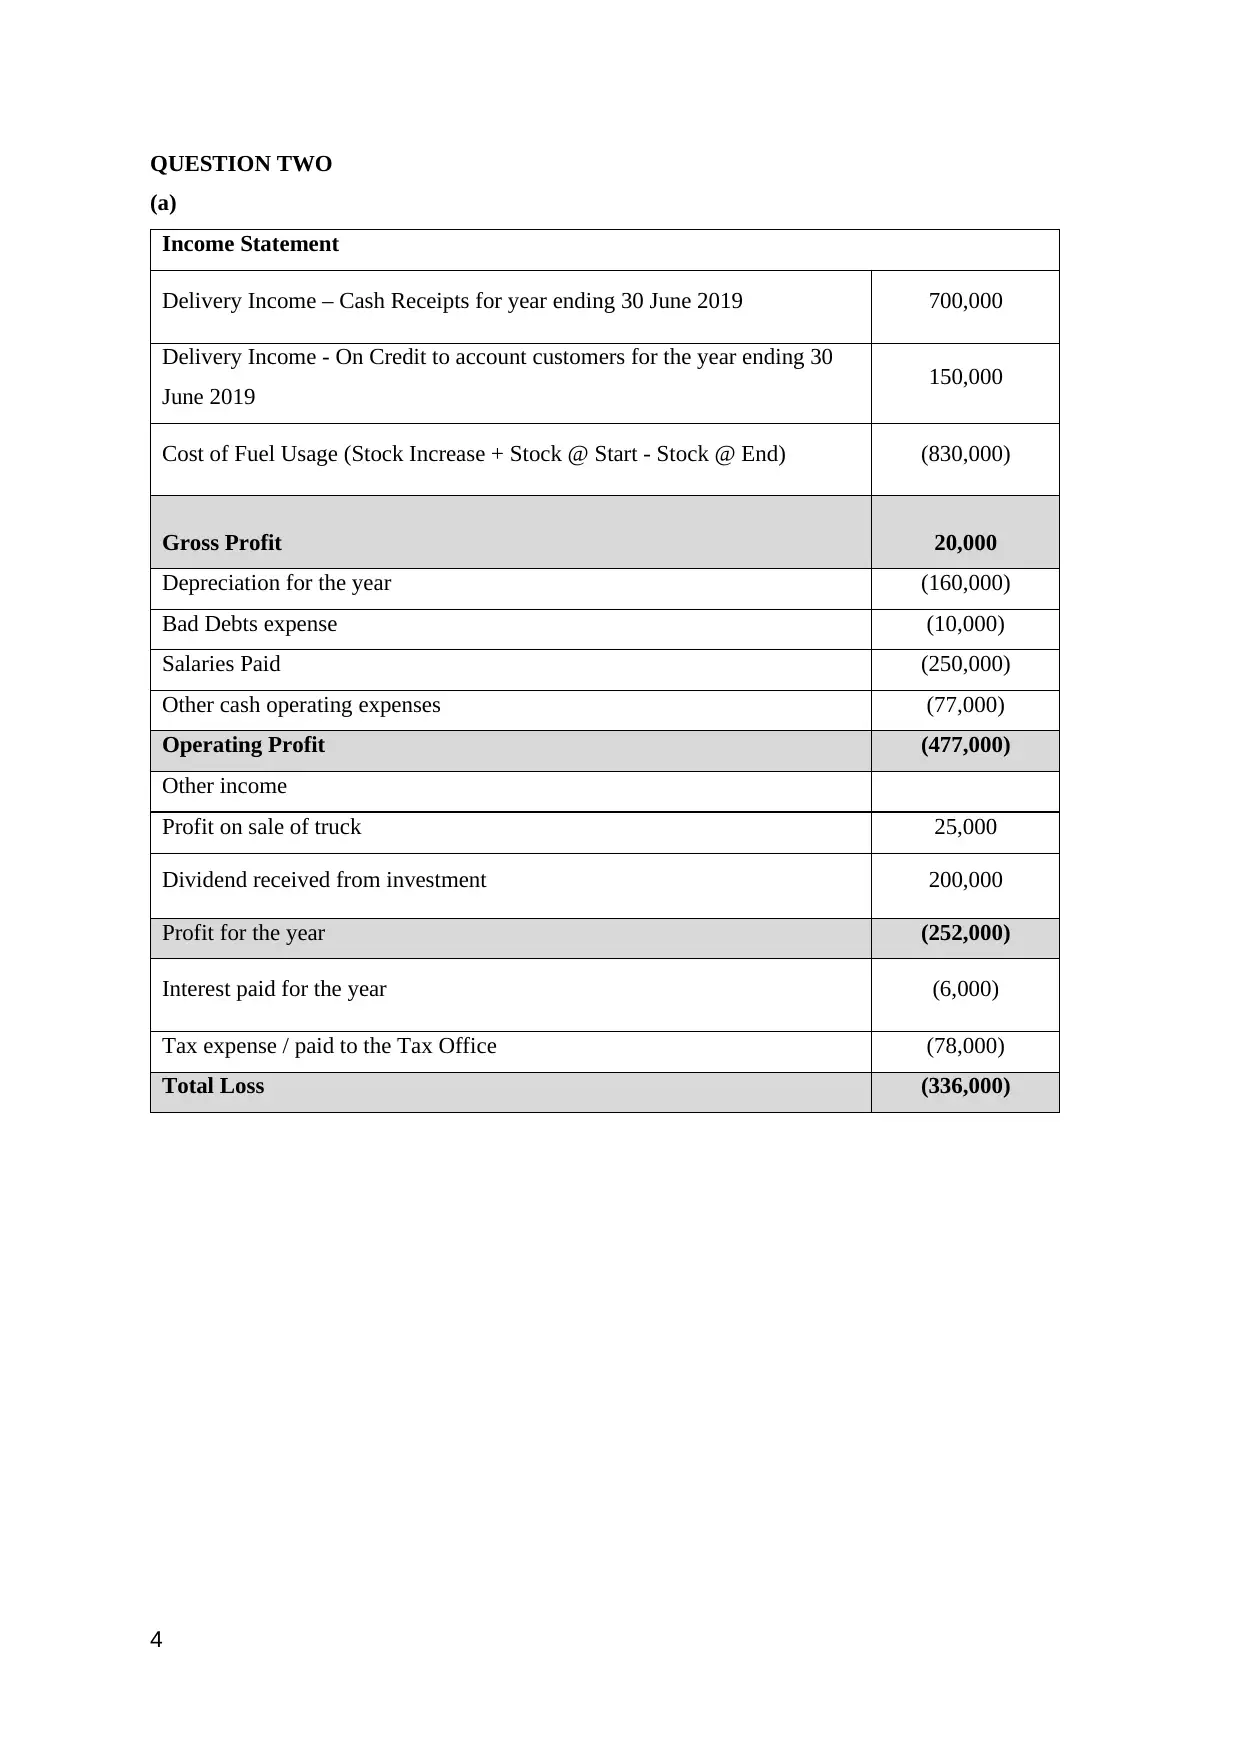
Income Statement
Delivery Income – Cash Receipts for year ending 30 June 2019 700,000
Delivery Income - On Credit to account customers for the year ending 30
June 2019 150,000
Cost of Fuel Usage (Stock Increase + Stock @ Start - Stock @ End) (830,000)
Gross Profit 20,000
Depreciation for the year (160,000)
Bad Debts expense (10,000)
Salaries Paid (250,000)
Other cash operating expenses (77,000)
Operating Profit (477,000)
Other income
Profit on sale of truck 25,000
Dividend received from investment 200,000
Profit for the year (252,000)
Interest paid for the year (6,000)
Tax expense / paid to the Tax Office (78,000)
Total Loss (336,000)
4
(a)
Income Statement
Delivery Income – Cash Receipts for year ending 30 June 2019 700,000
Delivery Income - On Credit to account customers for the year ending 30
June 2019 150,000
Cost of Fuel Usage (Stock Increase + Stock @ Start - Stock @ End) (830,000)
Gross Profit 20,000
Depreciation for the year (160,000)
Bad Debts expense (10,000)
Salaries Paid (250,000)
Other cash operating expenses (77,000)
Operating Profit (477,000)
Other income
Profit on sale of truck 25,000
Dividend received from investment 200,000
Profit for the year (252,000)
Interest paid for the year (6,000)
Tax expense / paid to the Tax Office (78,000)
Total Loss (336,000)
4
Paraphrase This Document
Need a fresh take? Get an instant paraphrase of this document with our AI Paraphraser

Operating Cashflow
5
5
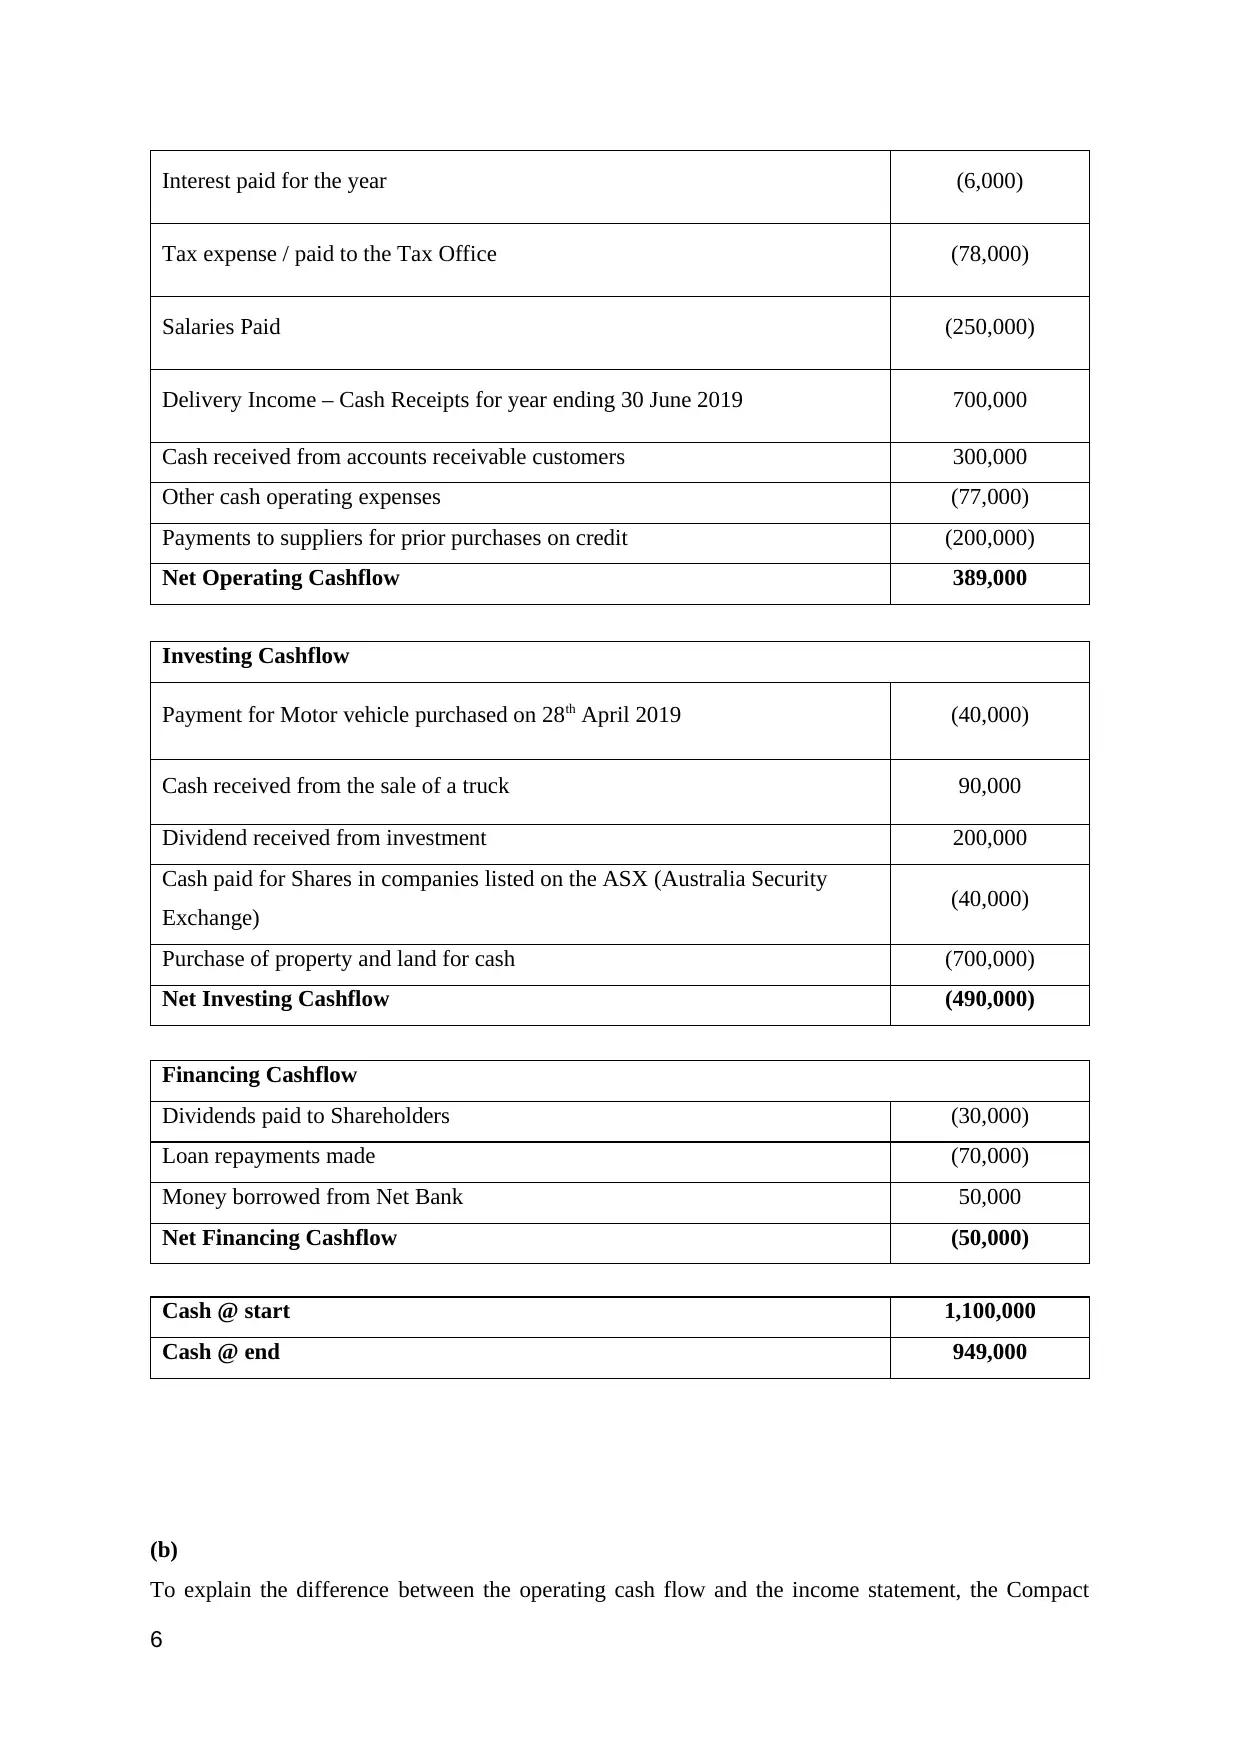
Interest paid for the year (6,000)
Tax expense / paid to the Tax Office (78,000)
Salaries Paid (250,000)
Delivery Income – Cash Receipts for year ending 30 June 2019 700,000
Cash received from accounts receivable customers 300,000
Other cash operating expenses (77,000)
Payments to suppliers for prior purchases on credit (200,000)
Net Operating Cashflow 389,000
Investing Cashflow
Payment for Motor vehicle purchased on 28th April 2019 (40,000)
Cash received from the sale of a truck 90,000
Dividend received from investment 200,000
Cash paid for Shares in companies listed on the ASX (Australia Security
Exchange) (40,000)
Purchase of property and land for cash (700,000)
Net Investing Cashflow (490,000)
Financing Cashflow
Dividends paid to Shareholders (30,000)
Loan repayments made (70,000)
Money borrowed from Net Bank 50,000
Net Financing Cashflow (50,000)
Cash @ start 1,100,000
Cash @ end 949,000
(b)
To explain the difference between the operating cash flow and the income statement, the Compact
6
⊘ This is a preview!⊘
Do you want full access?
Subscribe today to unlock all pages.
Trusted by 1+ million students worldwide
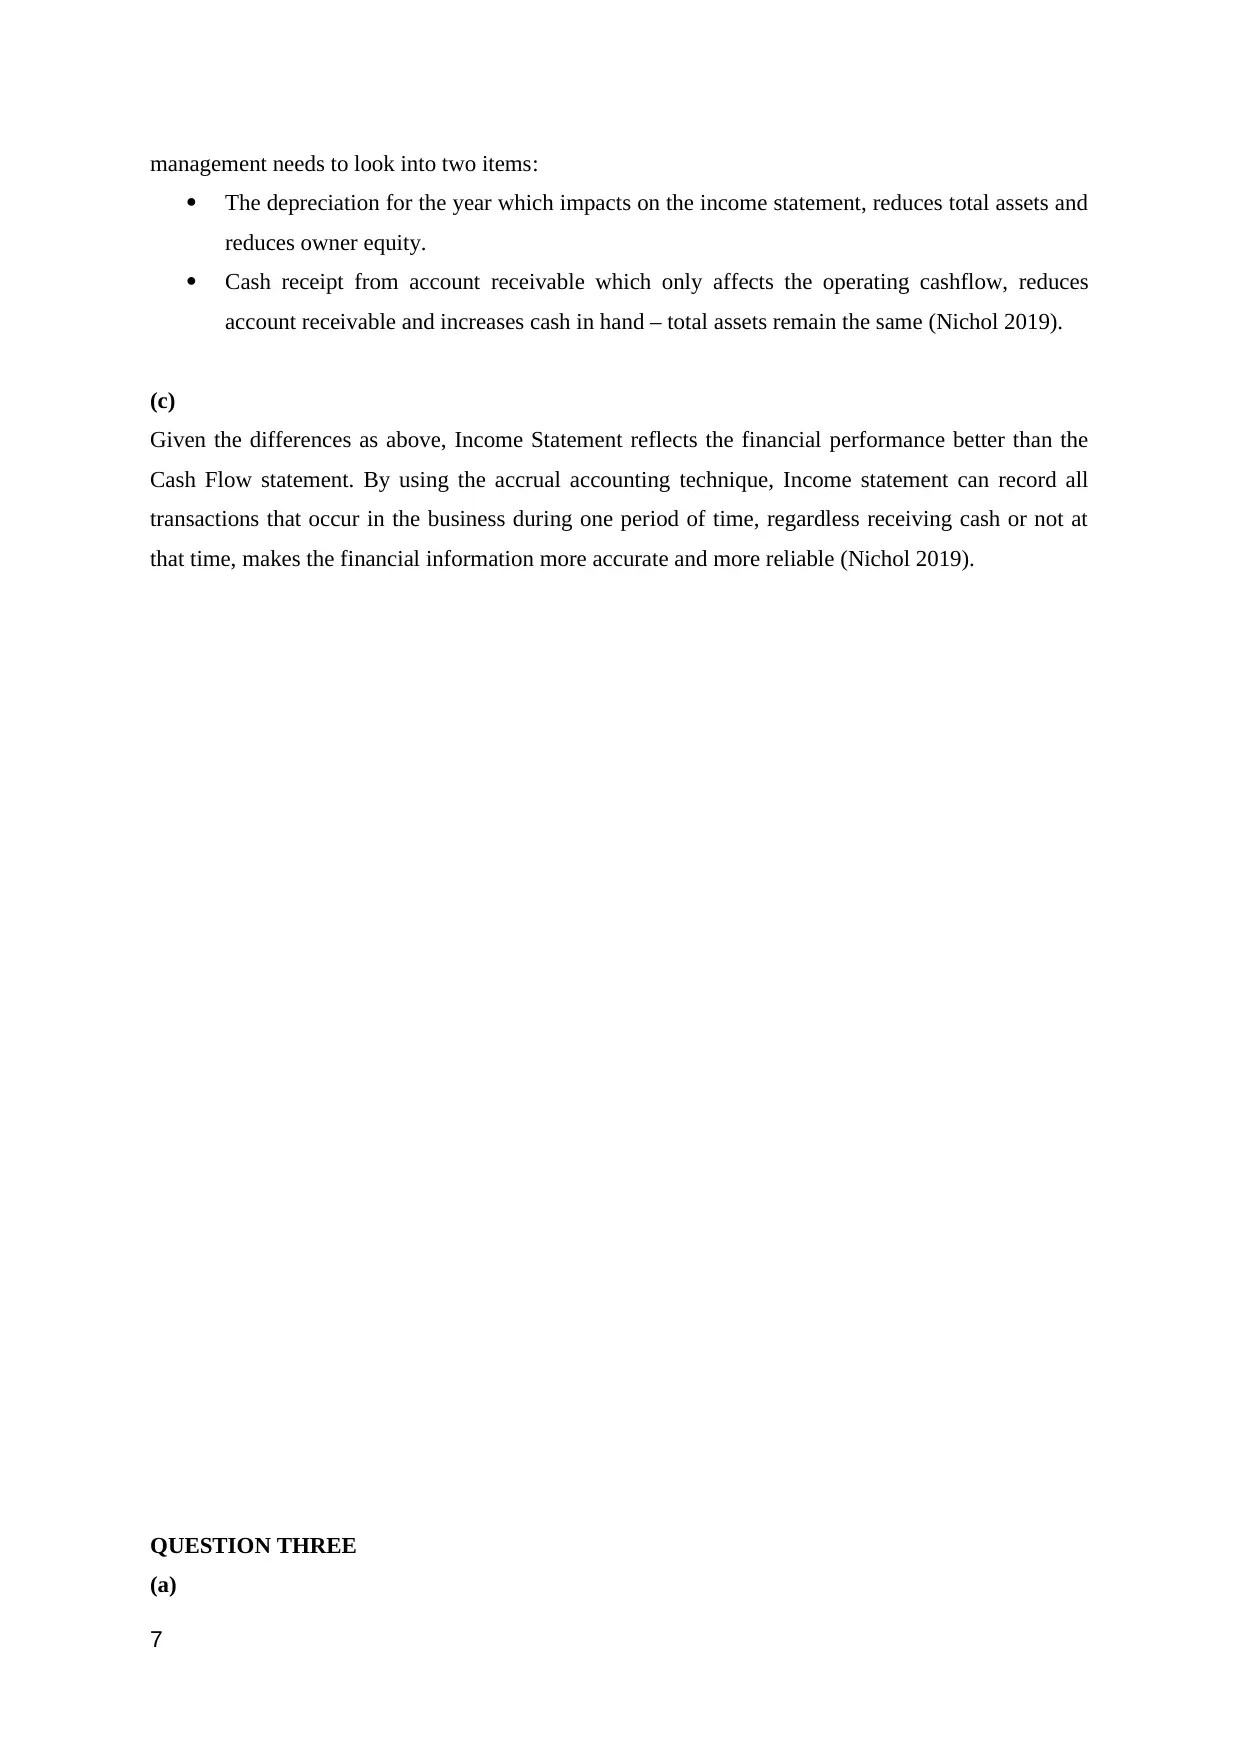
management needs to look into two items:
The depreciation for the year which impacts on the income statement, reduces total assets and
reduces owner equity.
Cash receipt from account receivable which only affects the operating cashflow, reduces
account receivable and increases cash in hand – total assets remain the same (Nichol 2019).
(c)
Given the differences as above, Income Statement reflects the financial performance better than the
Cash Flow statement. By using the accrual accounting technique, Income statement can record all
transactions that occur in the business during one period of time, regardless receiving cash or not at
that time, makes the financial information more accurate and more reliable (Nichol 2019).
QUESTION THREE
(a)
7
Paraphrase This Document
Need a fresh take? Get an instant paraphrase of this document with our AI Paraphraser
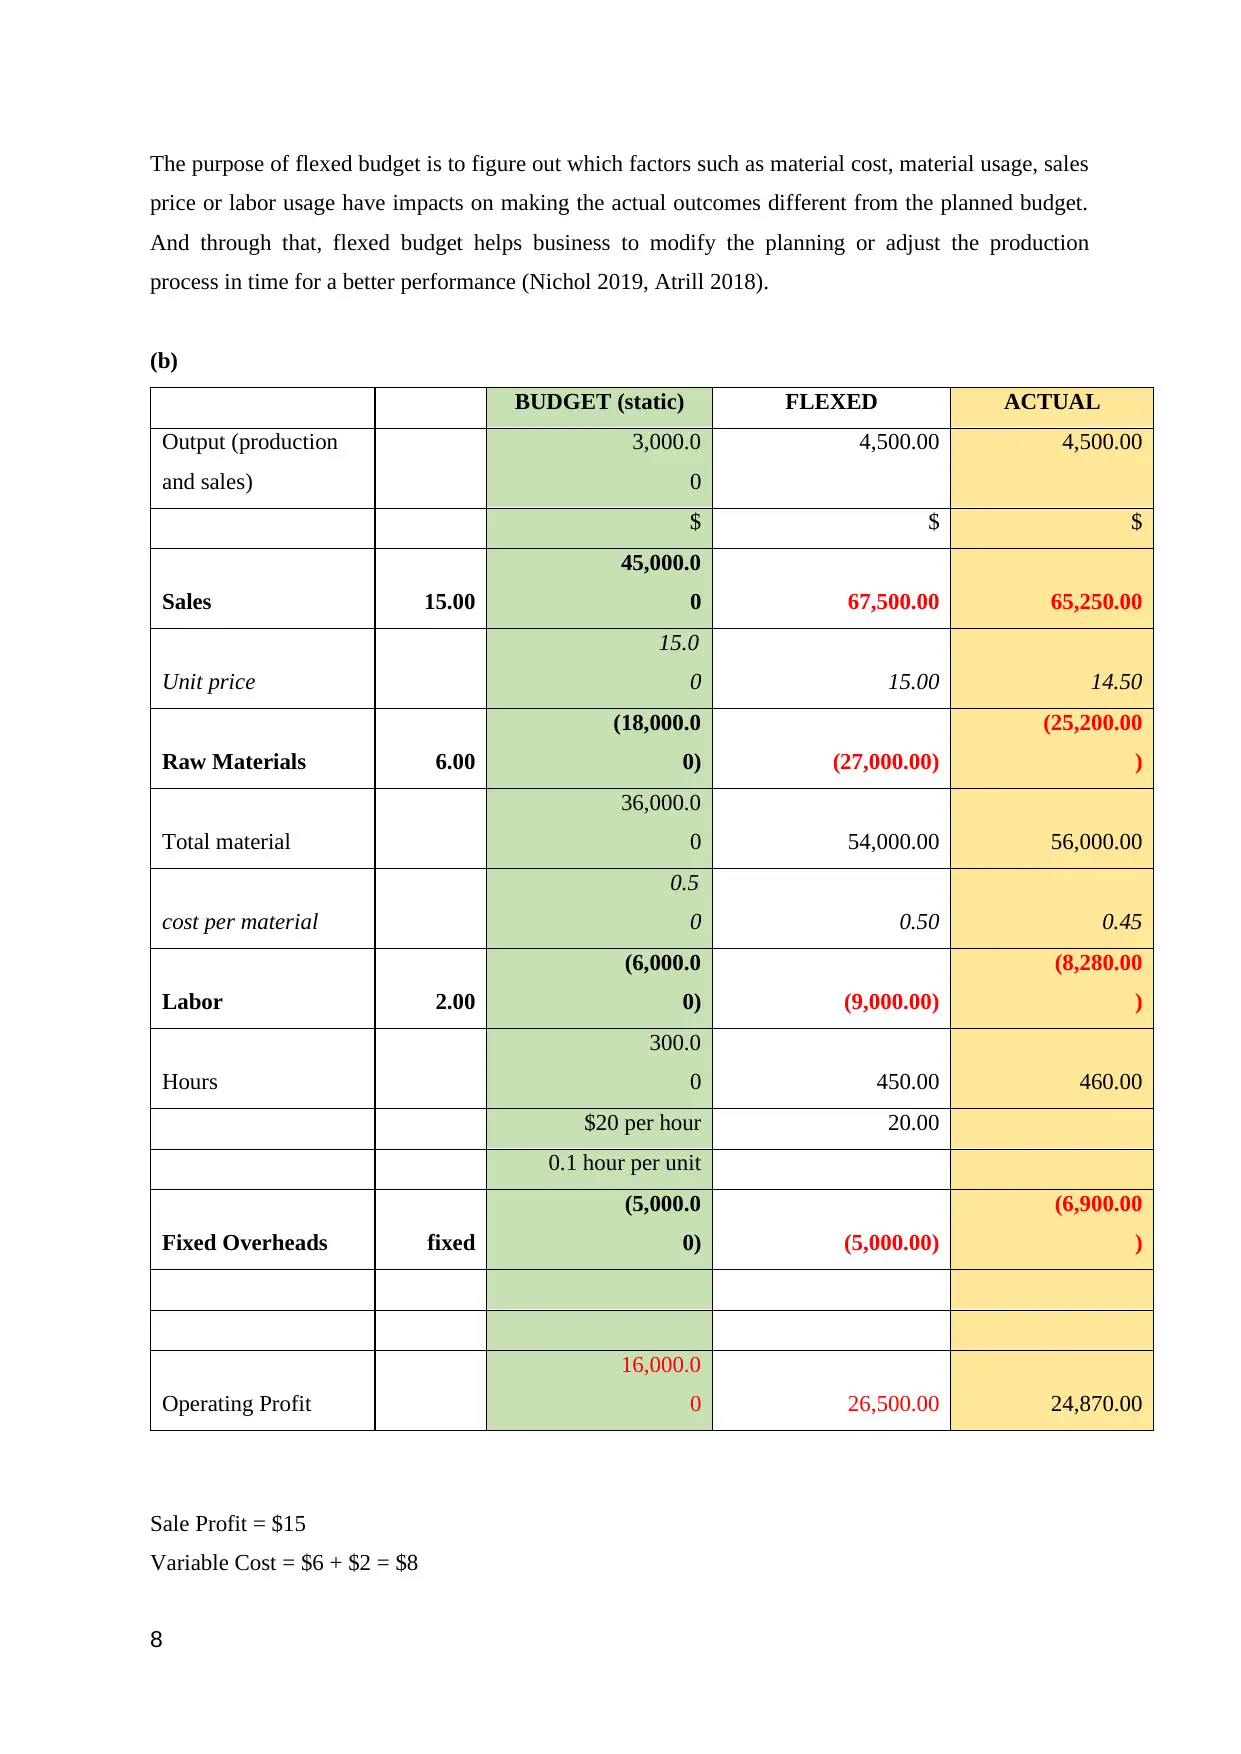
The purpose of flexed budget is to figure out which factors such as material cost, material usage, sales
price or labor usage have impacts on making the actual outcomes different from the planned budget.
And through that, flexed budget helps business to modify the planning or adjust the production
process in time for a better performance (Nichol 2019, Atrill 2018).
(b)
BUDGET (static) FLEXED ACTUAL
Output (production
and sales)
3,000.0
0
4,500.00 4,500.00
$ $ $
Sales 15.00
45,000.0
0 67,500.00 65,250.00
Unit price
15.0
0 15.00 14.50
Raw Materials 6.00
(18,000.0
0) (27,000.00)
(25,200.00
)
Total material
36,000.0
0 54,000.00 56,000.00
cost per material
0.5
0 0.50 0.45
Labor 2.00
(6,000.0
0) (9,000.00)
(8,280.00
)
Hours
300.0
0 450.00 460.00
$20 per hour 20.00
0.1 hour per unit
Fixed Overheads fixed
(5,000.0
0) (5,000.00)
(6,900.00
)
Operating Profit
16,000.0
0 26,500.00 24,870.00
Sale Profit = $15
Variable Cost = $6 + $2 = $8
8
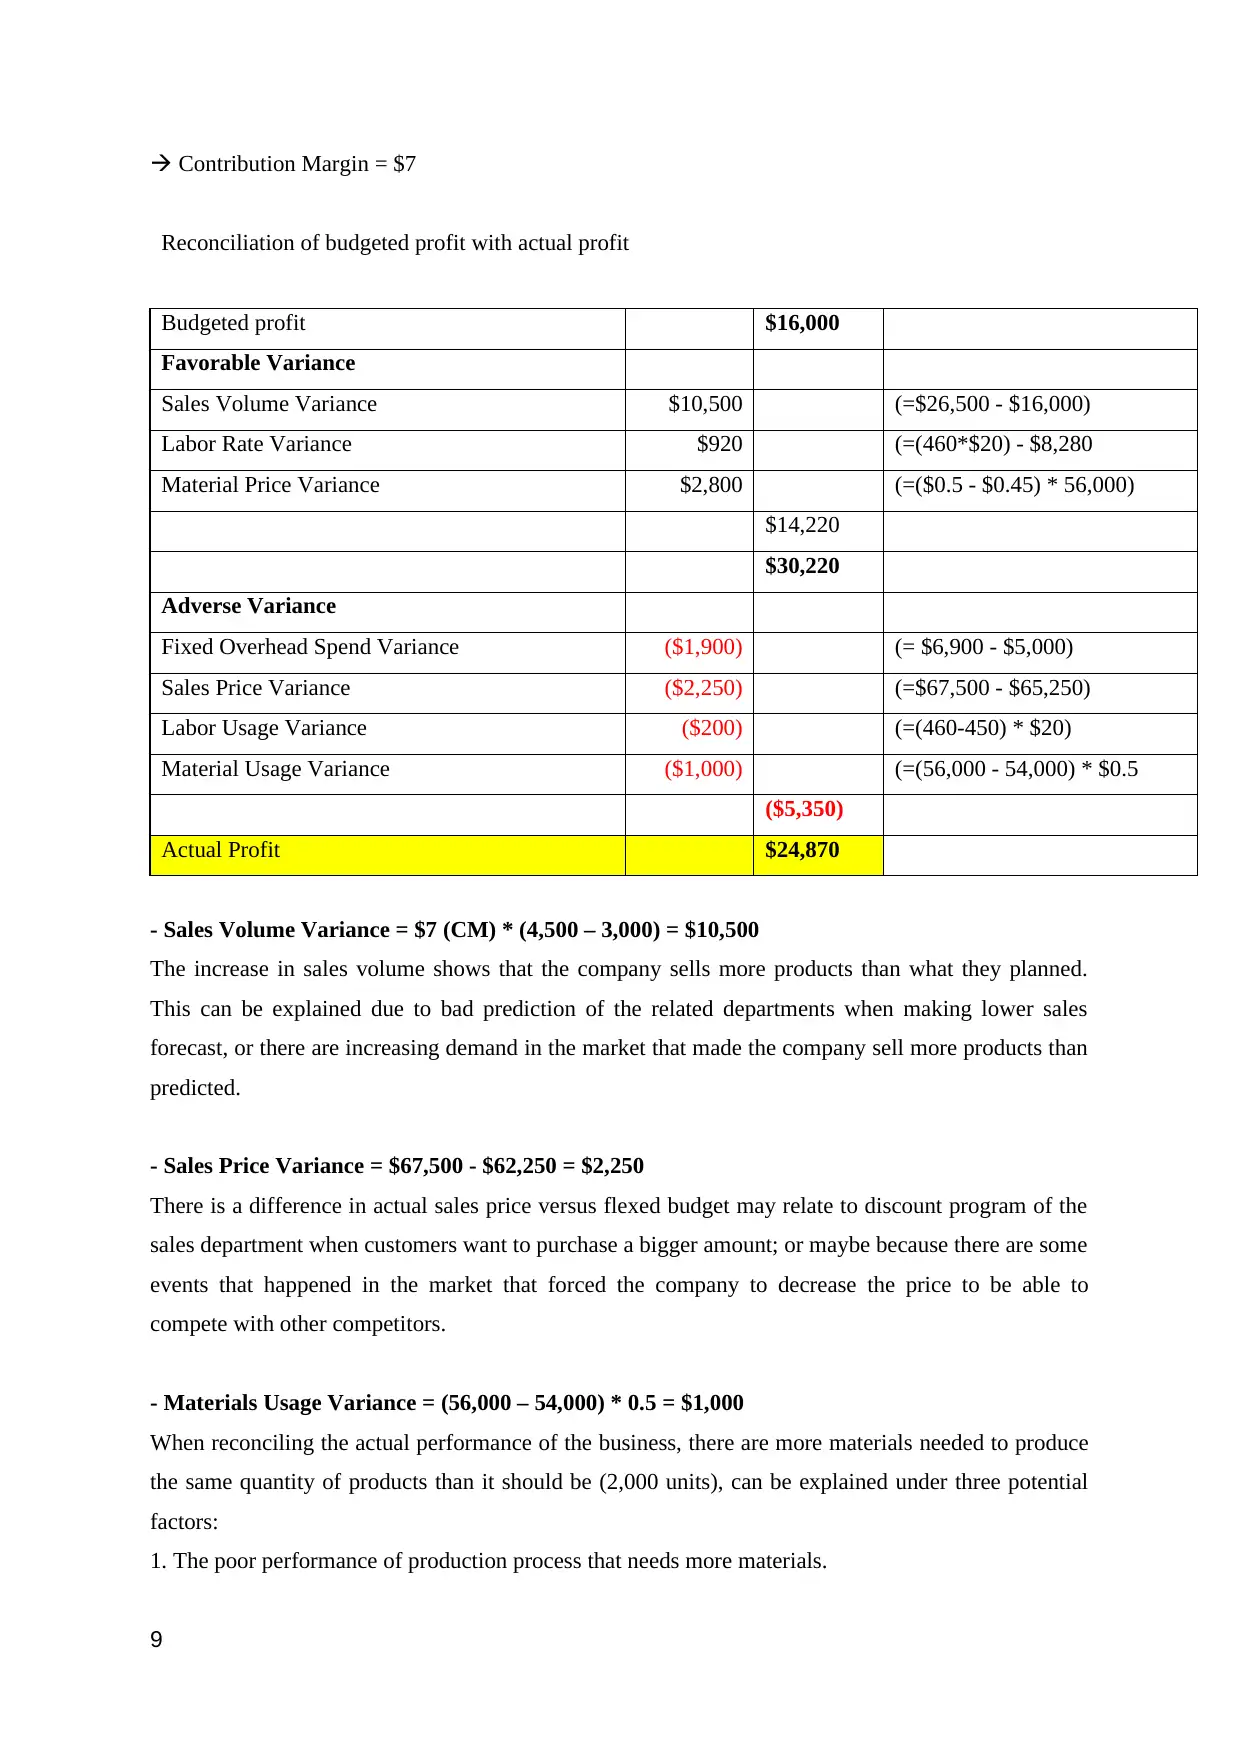
Contribution Margin = $7
Reconciliation of budgeted profit with actual profit
Budgeted profit $16,000
Favorable Variance
Sales Volume Variance $10,500 (=$26,500 - $16,000)
Labor Rate Variance $920 (=(460*$20) - $8,280
Material Price Variance $2,800 (=($0.5 - $0.45) * 56,000)
$14,220
$30,220
Adverse Variance
Fixed Overhead Spend Variance ($1,900) (= $6,900 - $5,000)
Sales Price Variance ($2,250) (=$67,500 - $65,250)
Labor Usage Variance ($200) (=(460-450) * $20)
Material Usage Variance ($1,000) (=(56,000 - 54,000) * $0.5
($5,350)
Actual Profit $24,870
- Sales Volume Variance = $7 (CM) * (4,500 – 3,000) = $10,500
The increase in sales volume shows that the company sells more products than what they planned.
This can be explained due to bad prediction of the related departments when making lower sales
forecast, or there are increasing demand in the market that made the company sell more products than
predicted.
- Sales Price Variance = $67,500 - $62,250 = $2,250
There is a difference in actual sales price versus flexed budget may relate to discount program of the
sales department when customers want to purchase a bigger amount; or maybe because there are some
events that happened in the market that forced the company to decrease the price to be able to
compete with other competitors.
- Materials Usage Variance = (56,000 – 54,000) * 0.5 = $1,000
When reconciling the actual performance of the business, there are more materials needed to produce
the same quantity of products than it should be (2,000 units), can be explained under three potential
factors:
1. The poor performance of production process that needs more materials.
9
⊘ This is a preview!⊘
Do you want full access?
Subscribe today to unlock all pages.
Trusted by 1+ million students worldwide
2. The quality of the materials is not good making the total needs for producing the same amount
increase.
3. The skills of labor is not high so that affect to the usage efficiency of materials when producing.
- Materials Price Variance = ($0.5 - $0.45) * 56,000 = $2,800
The actual material price is less than expected by $0.05 can be explained under two circumstances:
1. The purchasing department has a better deal for lower price when buying larger amount of
materials.
2. High competition in the supplied market makes the suppliers decrease the material price.
- Labor Usage Variance = (460hrs – 450hrs) * $20 = $200
Cheaper labor was used to reduce labor cost. However, the efficiency of cheap labor is not high so
that requires longer time to produce due to lack of specific skills. This affects negatively to total usage
of materials.
- Labor rate variance = (460hrs * $20) - $8,280 = $920
Lower paid for workers makes the labor cost decrease, due to high demand in the labor market or the
business recruit lower skill workers.
- Fixed Overheads Spend = $6,900 - $5,000 = $1,900
The difference in actual fixed overheads spend with the flexed budget gives evidence that
performance of the overhead management is bad and need more cost for the same outcome.
(c)
As being mentioned and explained above, the labor rate variance which is seen as favorable factor due
to the lower cost of labor to the business, also has impact on efficiency of labor or the labor usage
variance. Hiring cheaper labor, the business needs to accept potential risks that may bring longer time
of production or the inefficient performance with the lack of skills of the cheap labors.
10
Paraphrase This Document
Need a fresh take? Get an instant paraphrase of this document with our AI Paraphraser
QUESTION FOUR
(a)
Basically, the business does not have to pay extra cost (excepts labor usage cost will increase
slightly), if it wants to supply to an additional customer. However, offering a lower price to a new
customer may lead to two risks as below:
1. Affecting the relationship with current customers who they are offering less favorable prices.
2. Extra production may affect to the ability of providing stocks in the future to existing customers
(Nichol 2019, Atrill 2018).
(b)
The business, if wants to remain long and strong in the market, needs to satisfy not only its owners, or
shareholders, but also needs maintain the satisfaction of all the stakeholders, which may include
customers, suppliers and all relevant partners that may get involved in that business. Therefore, with
such strategy of ignoring corporate social responsibilities and focus on long-term shareholder value
only, the business may get itself in some unpredicted situations that may impact negatively to the
brand or the reputation that leads to decrease of sales or performance in the market (Nichol 2019).
(c)
The concept of limited liability company is that the owners or investors are legally and only
responsible for the company’s debts limited to the amount of total money they invested in. To protect
third parties of the company from not being repaid, there are three main principles:
- Company must publish all financial information or annual report to let related parties examine the
financial health tracks.
- Shareholders are restricted to withdraw their investment from the company.
- When a company declares bankruptcy, all of its assets are used to paid to its creditors at first,
investors are paid last (Nichol 2019, Atrill 2018).
(d)
Two companies can have different liquidity positions in spite of having the same current ratio due to:
- The amount of cash or near-cash assets can affect the liquidity position. For instance, company A
have more cash in hand than company B which have more at account receivable or stocks, although A
and B have the same total value of current asset, company A can be seen as having more liquidity
than B, simply because when facing a debt need to pay, A can liquidate that debt faster than B due to
bigger amount of cash in hand.
- The turnover rate of inventory or accounts receivable also impacts such position. Imaging that two
companies are equal for all means, which company can collect debts faster or push the stocks out
11
1 out of 11
Related Documents


Your All-in-One AI-Powered Toolkit for Academic Success.
+13062052269
info@desklib.com
Available 24*7 on WhatsApp / Email
![[object Object]](/_next/static/media/star-bottom.7253800d.svg)
Unlock your academic potential
Copyright © 2020–2026 A2Z Services. All Rights Reserved. Developed and managed by ZUCOL.