Detailed Financial Analysis and Performance of Farsons & Heineken
VerifiedAdded on 2023/01/18
|18
|3482
|34
Report
AI Summary
This report presents a comprehensive financial analysis of two brewing companies, Farsons and Heineken, based on their financial statements. The analysis employs vertical and horizontal analysis techniques to evaluate the financial positions and performance trends of both companies over a period of time. It examines key financial metrics, including gross profit, net profit, and asset composition, to assess profitability, efficiency, and financial stability. Ratio analysis, including net profit ratio and gross profit ratio, is applied to provide a quantitative assessment of the companies' financial health and to facilitate a comparative study. The report highlights the strengths and weaknesses of each company, offering insights into their operational performance and financial decision-making. The findings are crucial for understanding the companies' financial health and making informed decisions regarding business operations.
Financial Analysis
Management
Enterprise
Management
Enterprise
Paraphrase This Document
Need a fresh take? Get an instant paraphrase of this document with our AI Paraphraser
INTRODUCTION
Financial analysis is the process of evaluating financial statements of any company with
an objective of making better decisions regarding business operations. In other words, financial
analysis helps the management to measure their strength as well as weakness in terms of figures.
Financial analysis establishes relationship between the various elements of statement of financial
position, statement of profit & loss, cash flow statement and other statements (Blum &
Dacorogna, 2014). It is used by the organizations in order to know about liquidity, profitability
and position of the company in terms of profit and loss. This report is based on Heineken and
Farsons. Both of them are brewing companies based out of Malta which produce a variety of
beers, wine and other beverages. This report covers multiple subjects such as financial
information of the two companies at it critically evaluated with the help of vertical & horizontal
statement of financial position or ratio analysis. In addition, it includes the critical evaluation of
working capital as well as flow of cash which is important to analyses by the management to
make effective decisions.
MAIN BODY
Critically evaluate the performance or the financial position of Farsons & Heineken
Overview of Farsons: It is a Maltese Food and beverages conglomerate company which
deals with the brewing, manufacturing, sales & distribution of beers and other kinds of alcoholic
and non-alcoholic beverages. It will be distributed through wholesalers as well as retailer and
also use the franchise options for food retailers. Farsons Company only offers their products in
Malta and it is founded in 1928. they offer variety in their products and its most famous beers
include cisk lager beer, cisk pilsner, hopleaf pale ale, blue label original amber ale, farsons India
pale ale, lacto milk stout etcetera. It is the first company which is a non-financial and private
sector firm that got listed in Malta Stock Exchange and they traded as SFC. It's subsidiary
companies import various international brand foods & beverages that are managed by the
Farsons Beverage Imports Company and Quintano Foods.
Overview of Heineken: It is beer manufacturing company and its beer contain only 5%
alcohol in overall volume of beer. They use green bottle with a red start as effective packaging in
order to attract customers (Bragg, 2012). Heineken is Dutch company which sells quality bear
and more than 300 international or local specialty beers. They sell over 170 countries which
1
include China, Mexico, Australia etc. and approx. 8500 people employed under this company.
One of the main objective of the company is to create value which has proved to be the core
strength for its success in the industry. In 2013, Heineken take part in the producer's commitment
in order to reduce the harmful drinks, so they stop producing brown bottle for Dutch market and
use green bottle which they already used for export.
Vertical analysis: It is the proportional analysis of financial statements where every item
of financial statements used to be listed in percentage form. Basically it means, listed item of
Income Statement should be recognized in percentage of overall sales and balance sheet item
will be recognized as the value in terms of aggregate assets. Vertical analysis of the financial
position of the above mentioned companies are being discussed below:
Heineken:
Income statements:
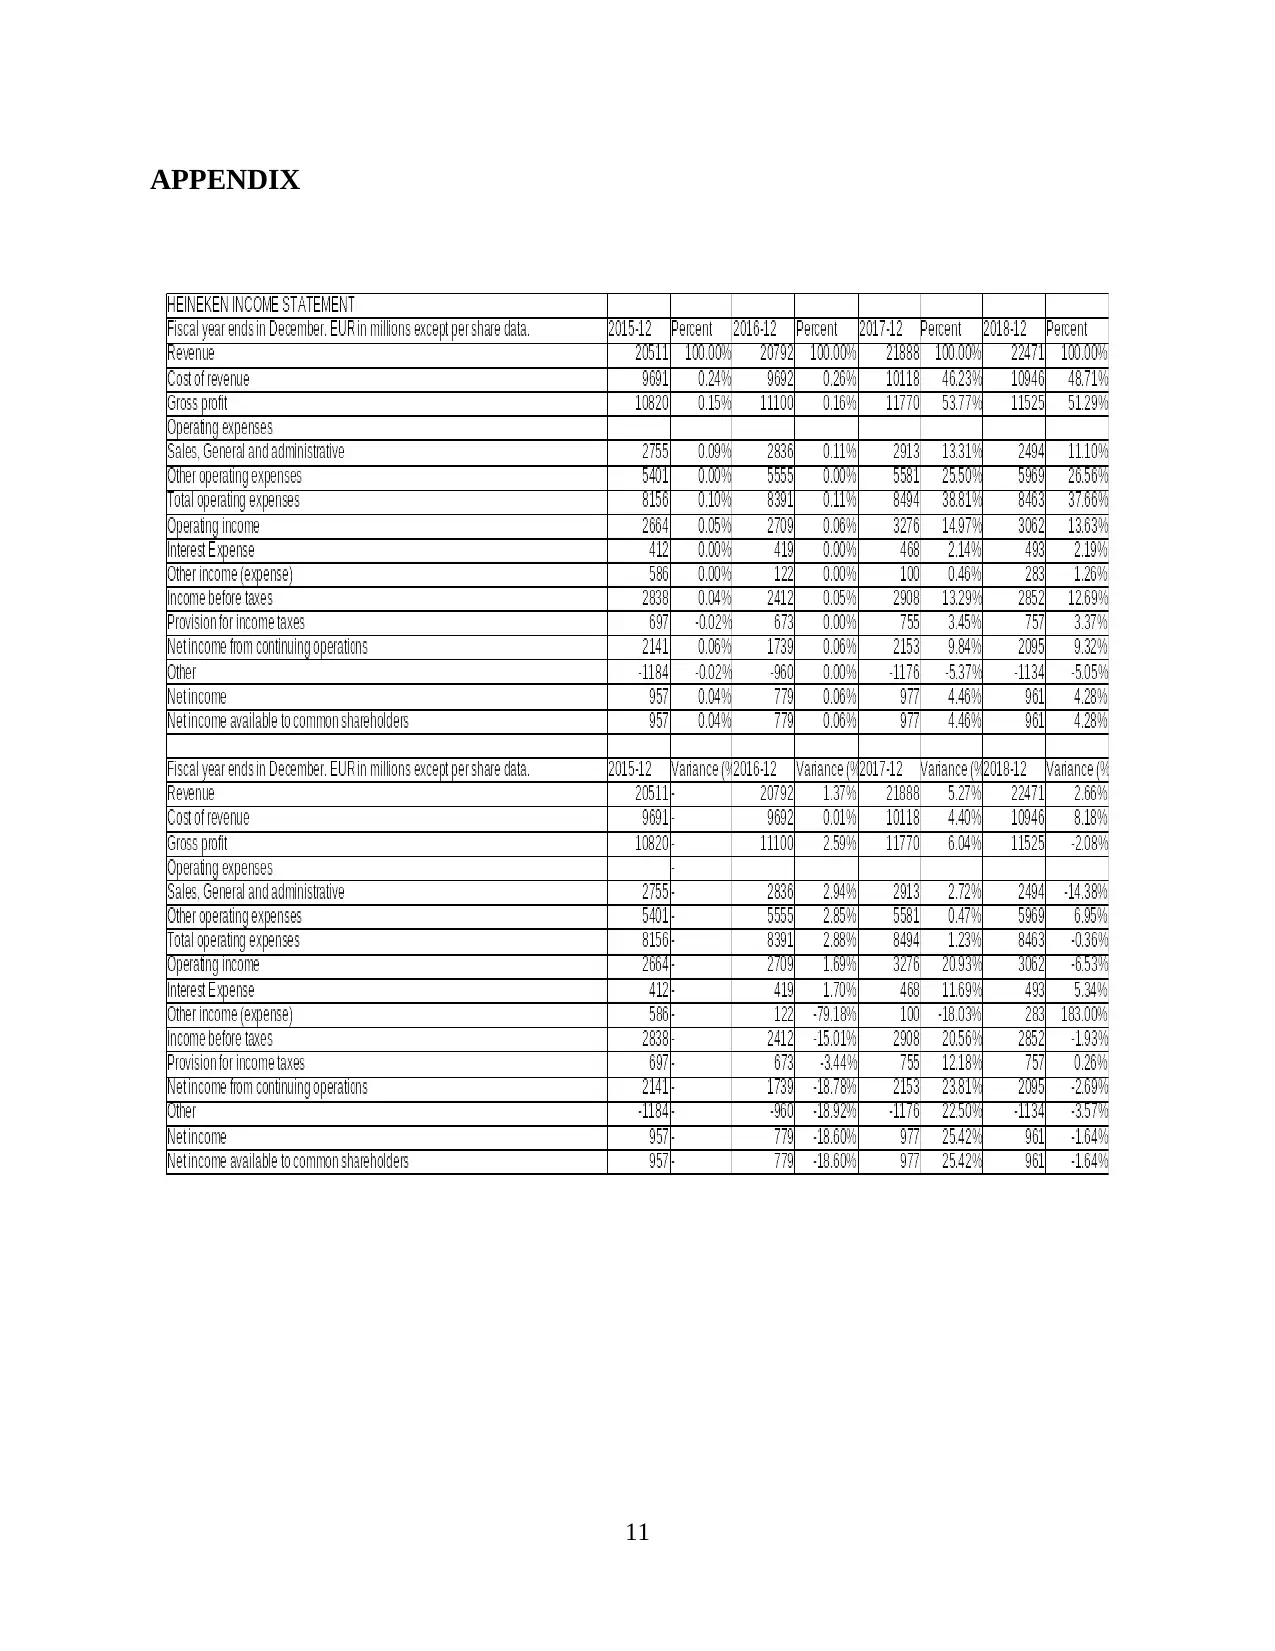
With the use of vertical analysis of the income statement, Heiniken Ltd analyses their
gross profit as percentage of sales and it has been reduced from 2017 to 2018 and it was about
51.29% after perpetual improvement during the period of 2015 to 2017. Along with this, the net
profit of the company was 4.67% in 2015 and it reduced in 2016 to 3.75%. In 2017 or 2018 it
increased and reached 4.46% and 4.28% respectively (Annual Report of Heineken, 2019).
Statement of financial position:
Vertical analysis of statement of financial position will be recognized as the value of
aggregate assets. Here the value of non-current assets of the company are 84.3%, 79.3%, 79.9%
and 78.3% for the year 2015, 2016, 2017 and 2018 respectively. This clearly shows the fall in the
value of non-current assets over the years but on the other hand, cash balance increased in 2018
in comparison to 2017 (Cucchiella, Adamo and Gastaldi, 2015). In 2015 cash proportion was
2.23% which continuously increases and reached at 6.92% in 2018. Current assets of Heineken
are 15.6%, 20.6%, 20.1% and 21.6% of total assets for the year 2015, 2016, 2017 and 2018
respectively.
Shareholder's funds of the organisation were 17.90%, 16.78%, 16.16%, 17.06% during
the year 2015, 2016, 2017 & 2018 respectively. Total proportion of the current liability reduced
from 26.4% to 24.9% during 2016 to 2018. Moreover, the total proportion of the long term
liabilities also decreased from 59.5% to 58.03% during the period of 2015 to 2018.
Farsons:
2
One of the main objective of the company is to create value which has proved to be the core
strength for its success in the industry. In 2013, Heineken take part in the producer's commitment
in order to reduce the harmful drinks, so they stop producing brown bottle for Dutch market and
use green bottle which they already used for export.
Vertical analysis: It is the proportional analysis of financial statements where every item
of financial statements used to be listed in percentage form. Basically it means, listed item of
Income Statement should be recognized in percentage of overall sales and balance sheet item
will be recognized as the value in terms of aggregate assets. Vertical analysis of the financial
position of the above mentioned companies are being discussed below:
Heineken:
Income statements:
With the use of vertical analysis of the income statement, Heiniken Ltd analyses their
gross profit as percentage of sales and it has been reduced from 2017 to 2018 and it was about
51.29% after perpetual improvement during the period of 2015 to 2017. Along with this, the net
profit of the company was 4.67% in 2015 and it reduced in 2016 to 3.75%. In 2017 or 2018 it
increased and reached 4.46% and 4.28% respectively (Annual Report of Heineken, 2019).
Statement of financial position:
Vertical analysis of statement of financial position will be recognized as the value of
aggregate assets. Here the value of non-current assets of the company are 84.3%, 79.3%, 79.9%
and 78.3% for the year 2015, 2016, 2017 and 2018 respectively. This clearly shows the fall in the
value of non-current assets over the years but on the other hand, cash balance increased in 2018
in comparison to 2017 (Cucchiella, Adamo and Gastaldi, 2015). In 2015 cash proportion was
2.23% which continuously increases and reached at 6.92% in 2018. Current assets of Heineken
are 15.6%, 20.6%, 20.1% and 21.6% of total assets for the year 2015, 2016, 2017 and 2018
respectively.
Shareholder's funds of the organisation were 17.90%, 16.78%, 16.16%, 17.06% during
the year 2015, 2016, 2017 & 2018 respectively. Total proportion of the current liability reduced
from 26.4% to 24.9% during 2016 to 2018. Moreover, the total proportion of the long term
liabilities also decreased from 59.5% to 58.03% during the period of 2015 to 2018.
Farsons:
2
⊘ This is a preview!⊘
Do you want full access?
Subscribe today to unlock all pages.
Trusted by 1+ million students worldwide
Income statement:
Vertical evaluation of Farsons company on the basis of statement of profit and loss, it has
been critically analysed that gross profit as a percentage of aggregate sales and it was 37.9% for
the year 2015. After this it will increased in 2016 and remain 38.8%, 38.6% and 38.9% for the
year 2017 and 2018 respectively. In addition, net revenue of the company was 14.7% of total
sales in 2018 and for the year 2015, 2016 and 2017 it was 10.1%, 12.9% and 13.6% respectively
(Annual Report of Farsons, 2019). It shows that revenue generation capacity of the company has
increased which is beneficial for them or make them capable to maximize their profit margin.
Statement of financial position:
Vertical analysis of the statement of financial position shows that the shareholder's fund
was 67.1% in the year of 2015 which further remain 66.87%, 67.21% and 59.88% in 2016, 2017
& 2018 respectively. Total amount of liabilities of the company was 20.3% for 2018 which
reduced because in 2015, 2016 and 2017 it was 32.79%, 32.52% and 32.89% respectively.
Non-current assets of the firm have reduced in comparison to previous years such as
77.1% in 2018 and 81.42% in 2017. in addition, non-current assets of the firm in 2016 were
79.14% and 78.2% in 2015. It has been critically evaluated that, total proportion of current assets
hiked from 18.5% to 22.2% which was 21.48% and 20.25% in year 2015 and 2016 respectively.
Horizontal analysis: It is an financial analysis techniques which used to identify the
changes in financial statement in figures over the time. It is used for the trend analysis where
organization see the difference in results overs the years. This analysis also face the issue
regarding ongoing adjustments in the figures of each item listed in income statement or balance
sheet (El Kasmioui and Ceulemans, 2012). It include changes in the sales revenue, assets,
liability, expenses and other obligations. Main objective on this analysis is to determine the
changes in the comparative financial statements during the given time period. It is beneficial for
the management to make their decisions regarding their business operations and maximize the
production as well as profitability through making effective strategies. Horizontal analysis of
Heiniken and Farsons mentioned below:
Heineken:
Income statement:
Horizontal analysis based on income statement of Heineken where sales figures of the
2017 was 5.27% and 2.66% in 2018. It clearly mentioned that sales revenue decreases from 2017
3
Paraphrase This Document
Need a fresh take? Get an instant paraphrase of this document with our AI Paraphraser
to 2018 which also impact the gross profit margins of the company which reduces it by 2.08% in
2018 in comparison to 2017. It is also reported that company has achieved the maximum
increase of around 6.04% in 2017 while net income of Heineken got decreased by 1.64% in year
2018 as compared to 2017. In 2016, net profit of the company is 18.60% which further increased
by 25.42% in 2017. Decrease in net profit percentage is not beneficial for the company or it can
generate the financial issues in the business operations art the time of performing their task to
achieve organizational goals & objectives.
Financial position of the company:
Horizontal analysis of Heiniken company represent that increment in shareholder's fund
was reported 7.91% in the year of 2018. percentage change in 2016 was -2.25% and in 2017 was
0.53% (García, Martínez-Cutillas and Romero, 2012). Non-current liabilities raised by 1.69% in
2018 which last year increased by 7.24%. Short-term liabilities of the company reduces by -
0.08% in 2018 which showed an increase by 22.09% and 0.59% in year 2016 and 2017
respectively.
Flow of cash in the company increased by 268.33% in year 2016 which was also reduced
by 19.54%, along with this increment of cash flow reported 18.88% in 2018. Current assets of
the organization in 2016, 2017 or 2018 was 37.59%, 1.36% and 9.97% respectively. In addition,
non-current assets of the firm showed an increase by 0.31% in 2018 and it was also increased in
2017 around 5.14%. In 2016, non-current assets of Heiniken was decreased by 1.94%.
Farsons:
Income statement:
Horizontal analysis of the income statement of Farsons company shows that, in 2018,
revenue increased by 7.95% and in 2017 it was 3.53%. Gross profit margin of the firm increased
by 8.82% in 2018 where gross profit of 2016 and 2017 was 10% and 3.03% respectively. Along
with this, net profit increased to a level of 16.67% in 2018 while 2016 and 2017 was 37.50% and
9.09% respectively.
Financial position of the company:
As per the annual report of Farsons, all the figures are listed in the financial statement of
the company. With the help of horizontal analysis, it has been analysed that shareholder's funds
reduces by 21.1% in 2018 while in 2016 and 2017 there was an increase of 9% and 12.8%
respectively. Long-term liabilities of the company increased by 11.67% in 2018, 13.21% in 2017
4
and 8.16% in 2016. Overall short-term liabilities showed an increase of 33.33% in 2018 and in
2017 there was no increment or decrement (Isberg and Pitta, 2013). Total assets were valued at a
reduction by 11.4% in 2018 but it increased in 2017 and 2016 around 12.2% and 9.4%
respectively. In 2018, long-term assets reduced by 16.11% which were previously increased by
15.50% in 2017 and 10.26% in year 2016. Current assets of the firm increased by 5.88%, 3.03%
and 3.13% in the year of 2018, 2017 and 2016 respectively.
Ratio analysis: It is the quantitative method which used to evaluate the insight gain of a
company in term of liquidity, profitability, operational efficiency etc. Ratio analysis helps the
management to compare their financial position and evaluate the issues which minimize the
growth of the companies. Calculations of the Farsons and Heineken Ratio analysis are mentioned
below:
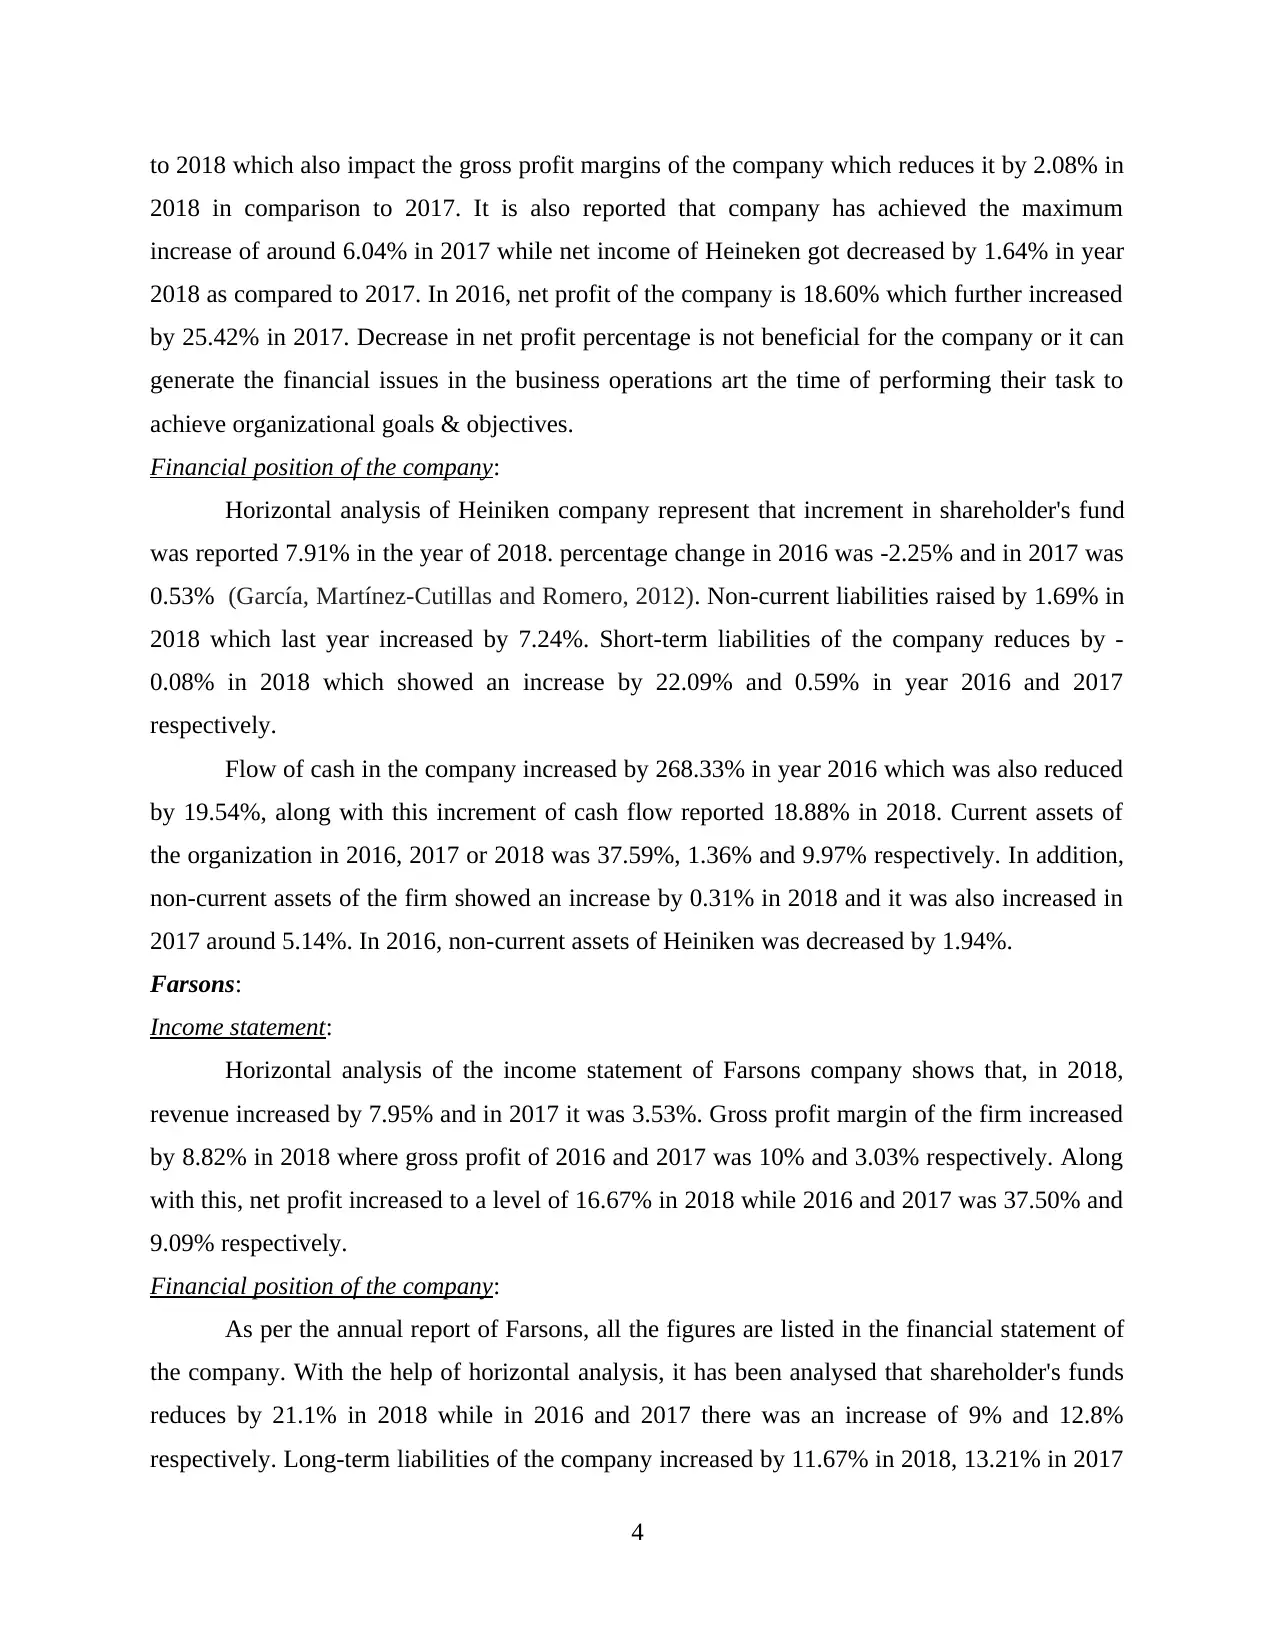
Net profit ratio: It is the profitability ratio that is used to evaluate the net income or
profit in percentage and it represent that how much profit company earn in the financial year
with the help of total sales of the company (Palepu and Healy, 2013). Below mention table
shows the calculation of net profit ratio for both the companies:
With the help of above calculation, net profit of the Farsons increased continuously such
as 10.11%, 13.22%, 13.77% and 14.49% in 2015, 2016, 2017 and 2018 respectively. On the
other side, In Heiniken, net profit was 4.67% in 2015 and in 2016 it was reduced and remain
3.75%. It will again increased and provide 4.46% and 4.28% in 2017 or 2018 respectively.
Farsons is more capable in comparison to Heiniken which increase the efficiency as well as
effectiveness of the business operations.
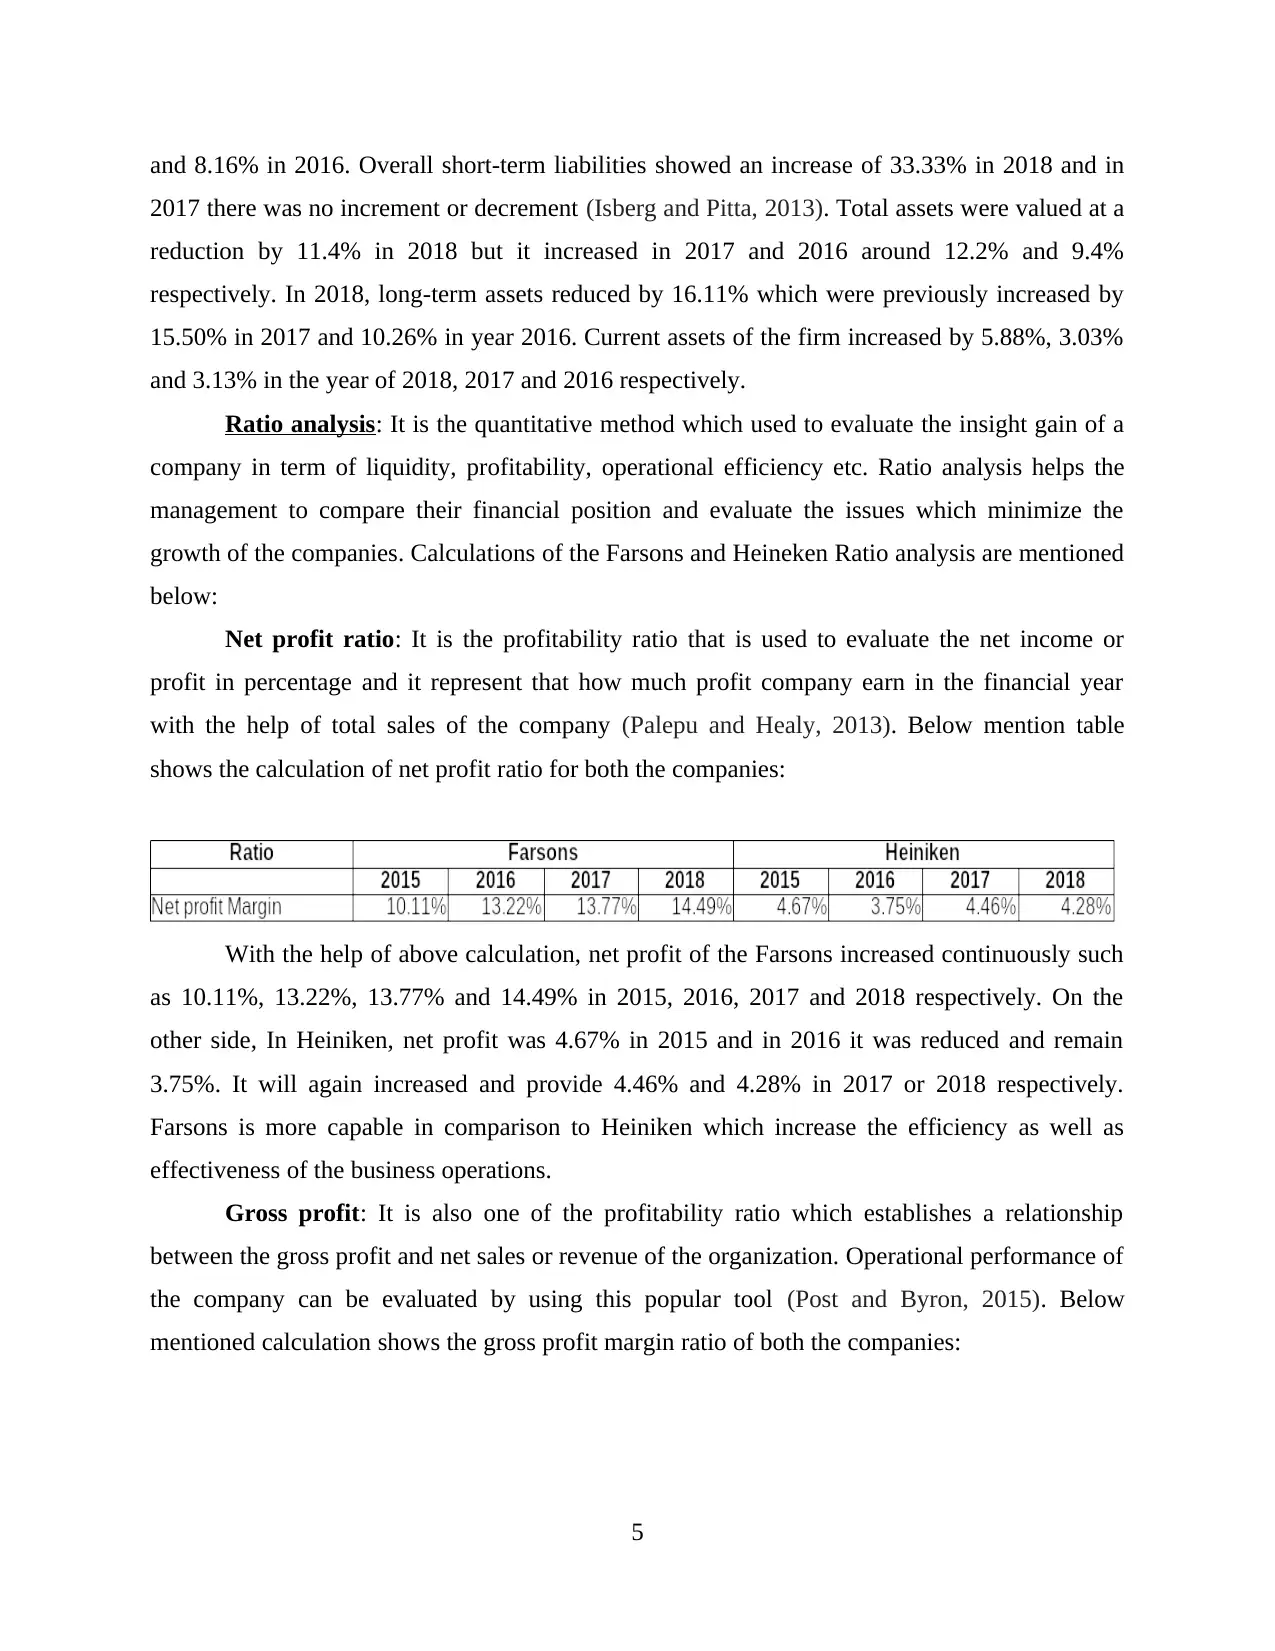
Gross profit: It is also one of the profitability ratio which establishes a relationship
between the gross profit and net sales or revenue of the organization. Operational performance of
the company can be evaluated by using this popular tool (Post and Byron, 2015). Below
mentioned calculation shows the gross profit margin ratio of both the companies:
5
2017 there was no increment or decrement (Isberg and Pitta, 2013). Total assets were valued at a
reduction by 11.4% in 2018 but it increased in 2017 and 2016 around 12.2% and 9.4%
respectively. In 2018, long-term assets reduced by 16.11% which were previously increased by
15.50% in 2017 and 10.26% in year 2016. Current assets of the firm increased by 5.88%, 3.03%
and 3.13% in the year of 2018, 2017 and 2016 respectively.
Ratio analysis: It is the quantitative method which used to evaluate the insight gain of a
company in term of liquidity, profitability, operational efficiency etc. Ratio analysis helps the
management to compare their financial position and evaluate the issues which minimize the
growth of the companies. Calculations of the Farsons and Heineken Ratio analysis are mentioned
below:
Net profit ratio: It is the profitability ratio that is used to evaluate the net income or
profit in percentage and it represent that how much profit company earn in the financial year
with the help of total sales of the company (Palepu and Healy, 2013). Below mention table
shows the calculation of net profit ratio for both the companies:
With the help of above calculation, net profit of the Farsons increased continuously such
as 10.11%, 13.22%, 13.77% and 14.49% in 2015, 2016, 2017 and 2018 respectively. On the
other side, In Heiniken, net profit was 4.67% in 2015 and in 2016 it was reduced and remain
3.75%. It will again increased and provide 4.46% and 4.28% in 2017 or 2018 respectively.
Farsons is more capable in comparison to Heiniken which increase the efficiency as well as
effectiveness of the business operations.
Gross profit: It is also one of the profitability ratio which establishes a relationship
between the gross profit and net sales or revenue of the organization. Operational performance of
the company can be evaluated by using this popular tool (Post and Byron, 2015). Below
mentioned calculation shows the gross profit margin ratio of both the companies:
5
⊘ This is a preview!⊘
Do you want full access?
Subscribe today to unlock all pages.
Trusted by 1+ million students worldwide
Gross profit ratio of Farsons company was increased from 37.97% to 38.95% while on
the other side, from 2015 to 2018 it was 52.75% to 51.29%. Heineken is more profitable or
operationally efficient as compared to the other company but gross profit of the company
decreases in 2017 to 2018.
Current ratio It is a ratio which measures working requirement of the company. It is
used to evaluate how company meets-his short term liabilities. For calculating current ratio
divide short term assets with all all short term liabilities. Ideal ratio is 2:1 which means for every
1 rupee liabilities you should have at least 2 rupees to pay. Below mention table show the
calculation of both organizations:
farsons company s current ratio is reducing from 1.72 to 1.12 in the tenure from 2015 to
2018. where as heinken company s current ratio is increasing but the rate of increasing is
competitively low then farsons. Farsons is more capable to meet their obligation and more
efficient in completing the operating cycle of the business . In order to improve current ratio
heinken should command on their repayments of current assets it will help to improve their
business functionality and the cycle of operating cycle will be better.
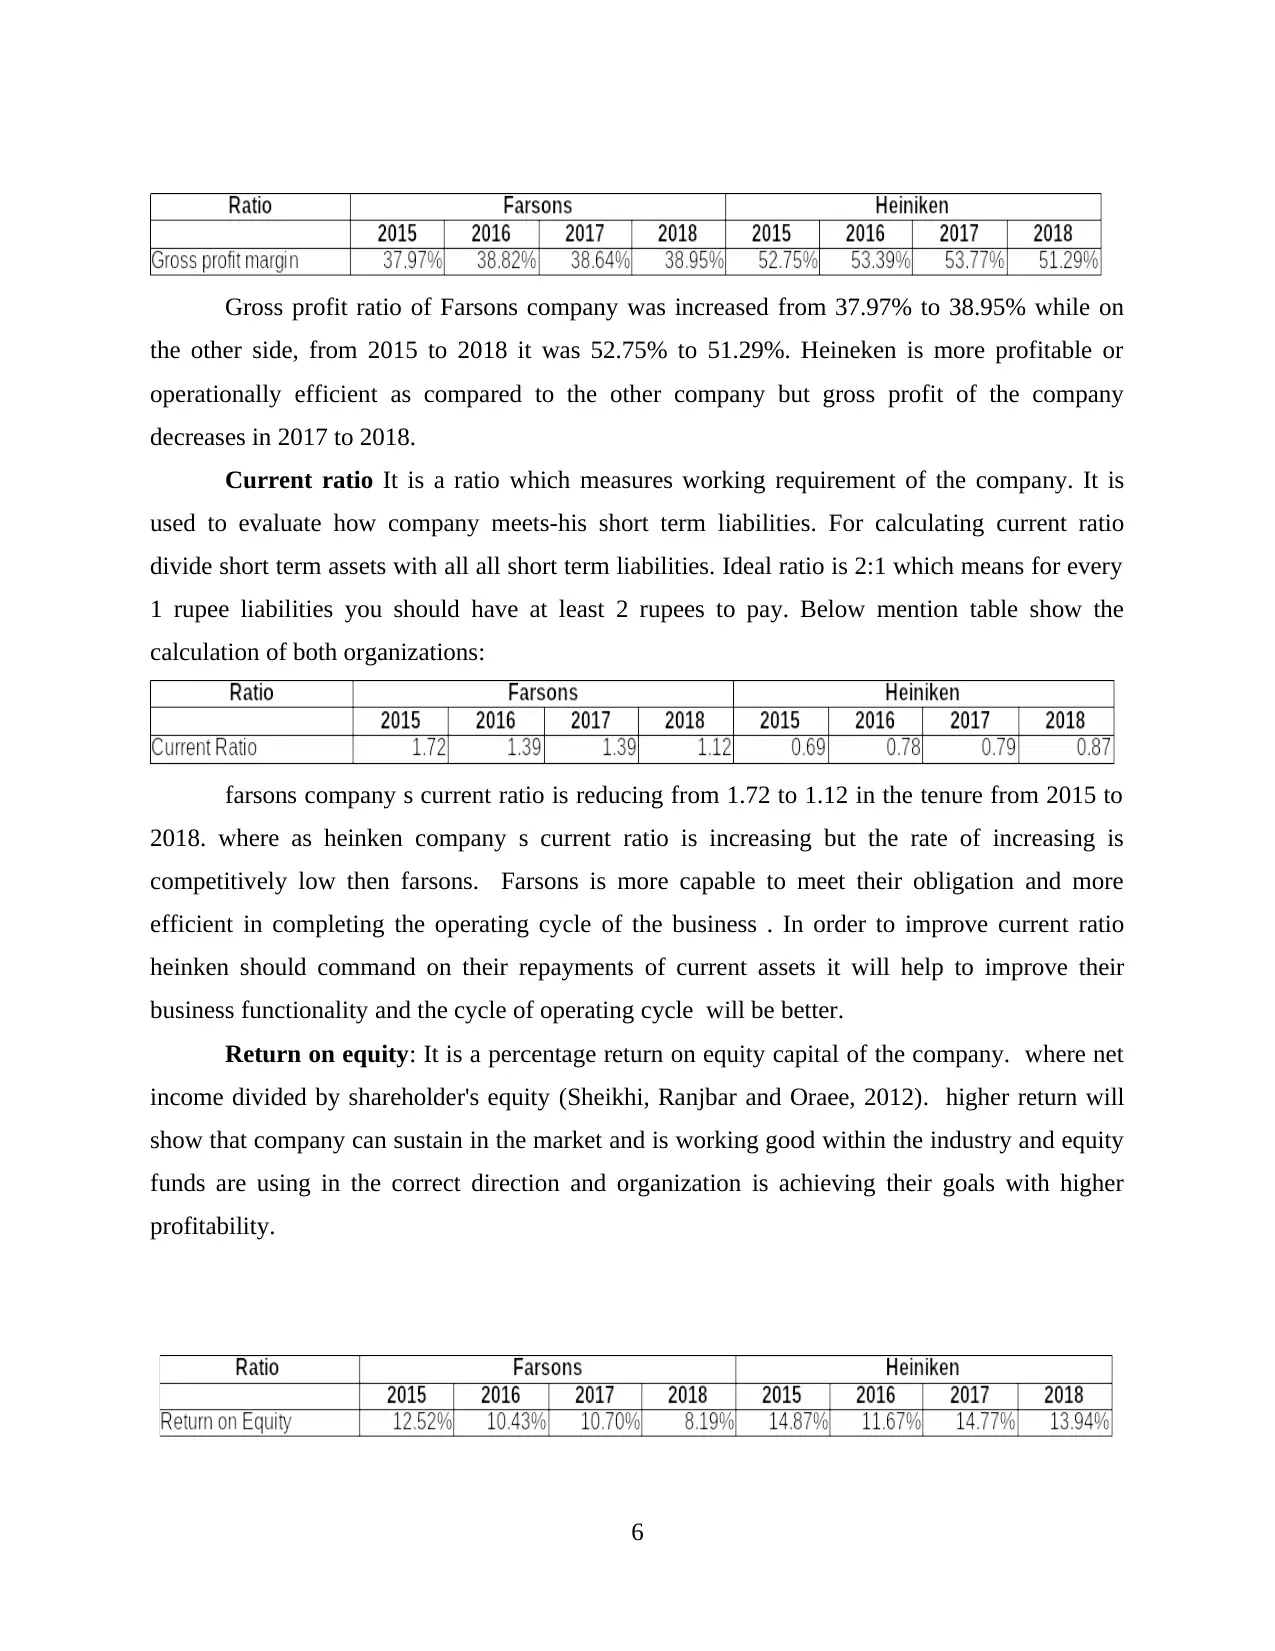
Return on equity: It is a percentage return on equity capital of the company. where net
income divided by shareholder's equity (Sheikhi, Ranjbar and Oraee, 2012). higher return will
show that company can sustain in the market and is working good within the industry and equity
funds are using in the correct direction and organization is achieving their goals with higher
profitability.
6
the other side, from 2015 to 2018 it was 52.75% to 51.29%. Heineken is more profitable or
operationally efficient as compared to the other company but gross profit of the company
decreases in 2017 to 2018.
Current ratio It is a ratio which measures working requirement of the company. It is
used to evaluate how company meets-his short term liabilities. For calculating current ratio
divide short term assets with all all short term liabilities. Ideal ratio is 2:1 which means for every
1 rupee liabilities you should have at least 2 rupees to pay. Below mention table show the
calculation of both organizations:
farsons company s current ratio is reducing from 1.72 to 1.12 in the tenure from 2015 to
2018. where as heinken company s current ratio is increasing but the rate of increasing is
competitively low then farsons. Farsons is more capable to meet their obligation and more
efficient in completing the operating cycle of the business . In order to improve current ratio
heinken should command on their repayments of current assets it will help to improve their
business functionality and the cycle of operating cycle will be better.
Return on equity: It is a percentage return on equity capital of the company. where net
income divided by shareholder's equity (Sheikhi, Ranjbar and Oraee, 2012). higher return will
show that company can sustain in the market and is working good within the industry and equity
funds are using in the correct direction and organization is achieving their goals with higher
profitability.
6
Paraphrase This Document
Need a fresh take? Get an instant paraphrase of this document with our AI Paraphraser
Above mentioned financial data represent that rerun on equity of Heiniken is more
beneficial as well as efficient because ROE of Farsons reduces 12.52% to 8.19% from 2015 to
2018. on the other side, ROE of Heiniken decreases and then increases and than final remain
13.94% in 2018 which is higher than another company.
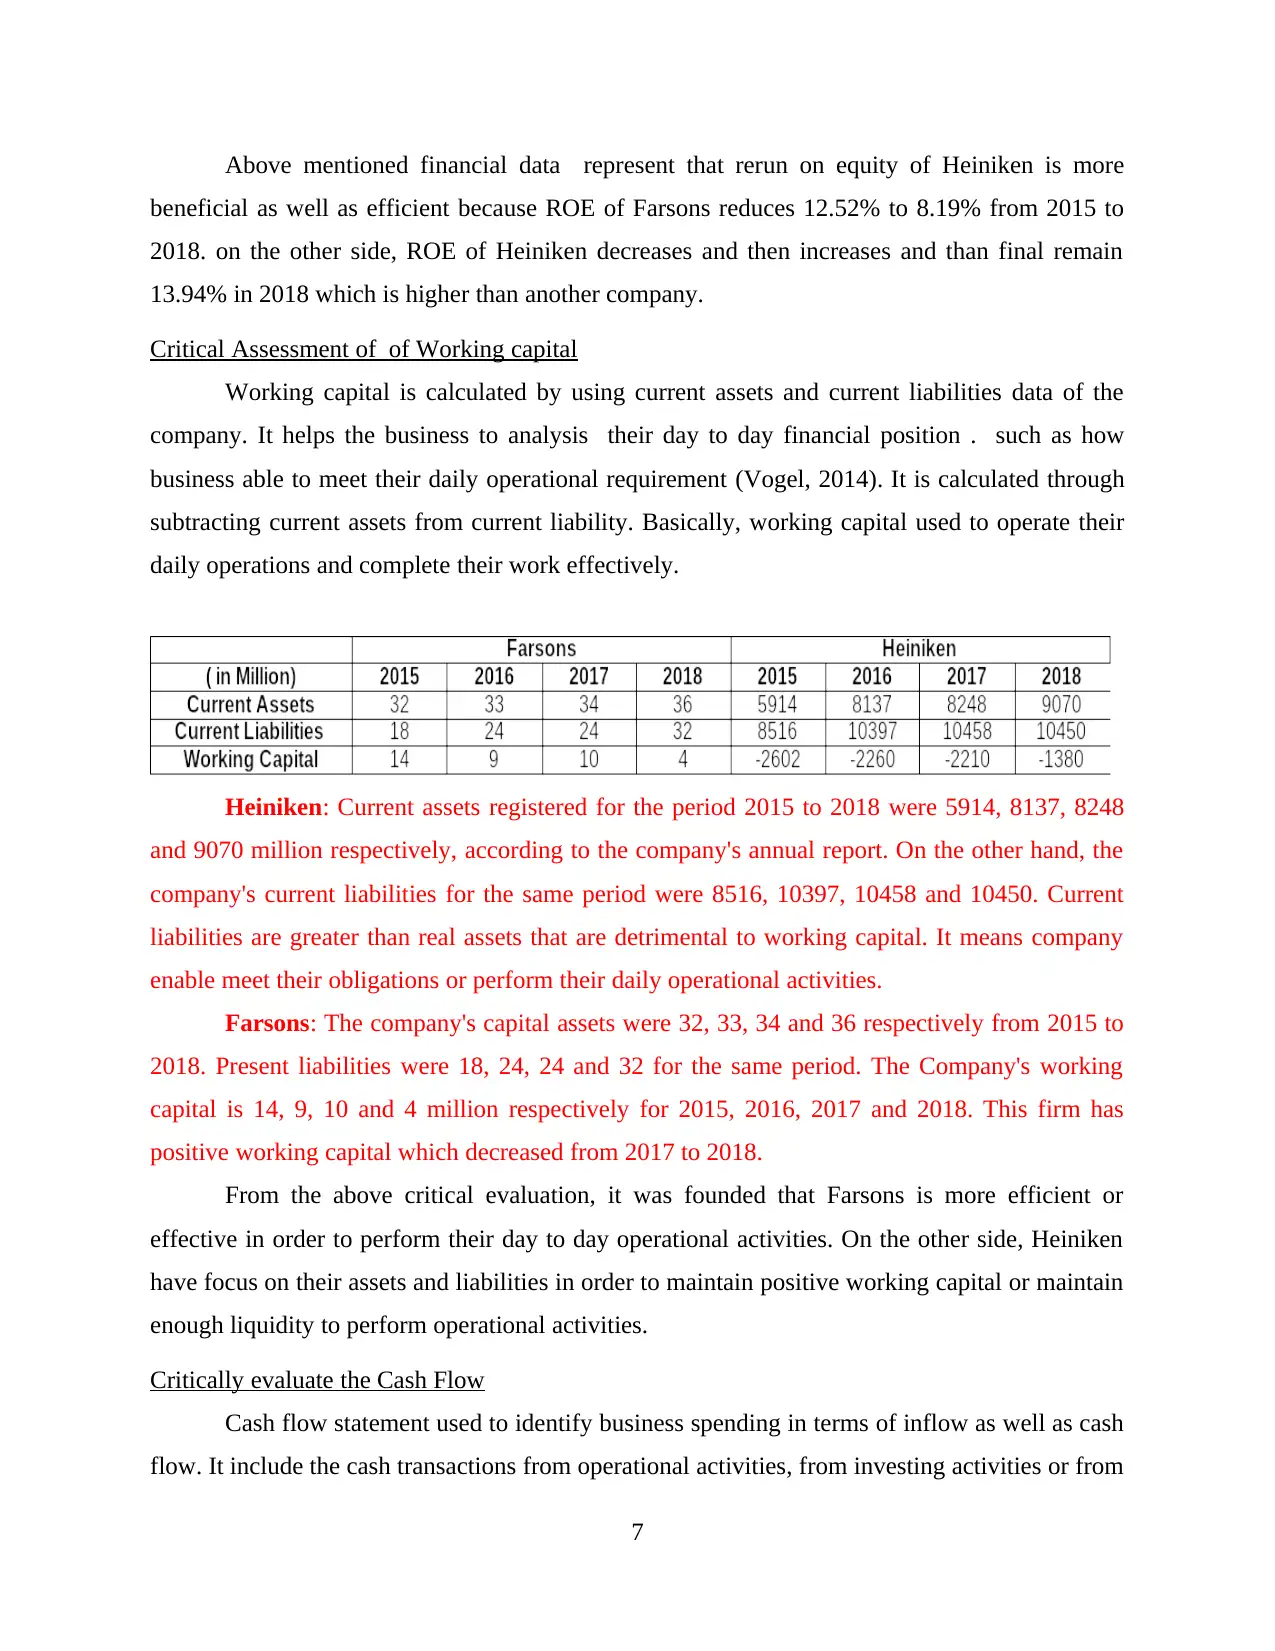
Critical Assessment of of Working capital
Working capital is calculated by using current assets and current liabilities data of the
company. It helps the business to analysis their day to day financial position . such as how
business able to meet their daily operational requirement (Vogel, 2014). It is calculated through
subtracting current assets from current liability. Basically, working capital used to operate their
daily operations and complete their work effectively.
Heiniken: Current assets registered for the period 2015 to 2018 were 5914, 8137, 8248
and 9070 million respectively, according to the company's annual report. On the other hand, the
company's current liabilities for the same period were 8516, 10397, 10458 and 10450. Current
liabilities are greater than real assets that are detrimental to working capital. It means company
enable meet their obligations or perform their daily operational activities.
Farsons: The company's capital assets were 32, 33, 34 and 36 respectively from 2015 to
2018. Present liabilities were 18, 24, 24 and 32 for the same period. The Company's working
capital is 14, 9, 10 and 4 million respectively for 2015, 2016, 2017 and 2018. This firm has
positive working capital which decreased from 2017 to 2018.
From the above critical evaluation, it was founded that Farsons is more efficient or
effective in order to perform their day to day operational activities. On the other side, Heiniken
have focus on their assets and liabilities in order to maintain positive working capital or maintain
enough liquidity to perform operational activities.
Critically evaluate the Cash Flow
Cash flow statement used to identify business spending in terms of inflow as well as cash
flow. It include the cash transactions from operational activities, from investing activities or from
7
beneficial as well as efficient because ROE of Farsons reduces 12.52% to 8.19% from 2015 to
2018. on the other side, ROE of Heiniken decreases and then increases and than final remain
13.94% in 2018 which is higher than another company.
Critical Assessment of of Working capital
Working capital is calculated by using current assets and current liabilities data of the
company. It helps the business to analysis their day to day financial position . such as how
business able to meet their daily operational requirement (Vogel, 2014). It is calculated through
subtracting current assets from current liability. Basically, working capital used to operate their
daily operations and complete their work effectively.
Heiniken: Current assets registered for the period 2015 to 2018 were 5914, 8137, 8248
and 9070 million respectively, according to the company's annual report. On the other hand, the
company's current liabilities for the same period were 8516, 10397, 10458 and 10450. Current
liabilities are greater than real assets that are detrimental to working capital. It means company
enable meet their obligations or perform their daily operational activities.
Farsons: The company's capital assets were 32, 33, 34 and 36 respectively from 2015 to
2018. Present liabilities were 18, 24, 24 and 32 for the same period. The Company's working
capital is 14, 9, 10 and 4 million respectively for 2015, 2016, 2017 and 2018. This firm has
positive working capital which decreased from 2017 to 2018.
From the above critical evaluation, it was founded that Farsons is more efficient or
effective in order to perform their day to day operational activities. On the other side, Heiniken
have focus on their assets and liabilities in order to maintain positive working capital or maintain
enough liquidity to perform operational activities.
Critically evaluate the Cash Flow
Cash flow statement used to identify business spending in terms of inflow as well as cash
flow. It include the cash transactions from operational activities, from investing activities or from
7
financial activities (Williams and Dobelman, 2017). All the activities will be evaluated and make
sure to have inflow which is profitable for the organizations. Following calculation of both
organizations are attached in appendix:
Heiniken: Cash flow from operating activities of the period of 2015, 2016, 2017 and
2018 are as 3489, 3718, 3882 and 4388 million respectively. Outflow of the company from
investing activities are 2064, 2,007, 2965 and 2355 million for the same period. Financial
activities cash outflows are 1,173, 672, 966 and 967 million from 2015 to 2018. Availability of
cash assets in Heiniken are 1,759, 1,852, 2,049 and 2,333 from 2015 to 2018 respectively.
Company has positive cash that represent company is able to manage their finance requirements
and meet their obligations as well.
Farsons: With the help of annual report, company record the cash inflow as well as
outflow of the company where outflow from operating activities are 16, 16 , 13 and 21 million
for the period of 2015 to 2018. It represents that company perform well in their operational
phase. Cash outflow form investing activities 7, 18, 20 and 21 million during 2015, 2016, 2017
and 2018 respectively. In addition, financial activities of the company are -4, -2, 4 and -1 million
in for the period of 2015 to 2018. Availability of cash assets are 9, -1, -6 and 7 million for that
period . It represent that company start managing their cash assets in 2016 and generate more
inflow from business operations.
With the help of above analysis and interpretation ,Heiniken is using their resources more
efficiently in comparison to another one and it will be evaluated with the help of 4 years cash
flow analysis. On the another hand, Farsons's free cash-flows contains negative figure from 2016
to 2017.
Overall analysis:
It was inferred from the above analyses that Heiniken is more competitive on the basis of
return on equity and they have more gross profit percentage compared with Farsons. This is also
true that, with negative working capital and positive cash flows, the business is facing problems.
The company Farsons has a strong net profit margin along with work capital availability. In
addition, current ratio is higher for Farsons Company or they operate in small level but they
financially sounds good.
8
⊘ This is a preview!⊘
Do you want full access?
Subscribe today to unlock all pages.
Trusted by 1+ million students worldwide
CONCLUSION
From the above research data it is being concluded that financial analysis and
interpretation help the organizations to evaluate their financial information or analyses that how
much profitable they are. This analysis includes the vertical, horizontal or ratio analysis which
help the analyst to identify the future opportunities as well as issues which they currently face. It
further beneficial for making strategic decisions to maximize profitability.
9
Paraphrase This Document
Need a fresh take? Get an instant paraphrase of this document with our AI Paraphraser
REFERENCES
Books & Journals
10
Books & Journals
10
APPENDIX
11
11
⊘ This is a preview!⊘
Do you want full access?
Subscribe today to unlock all pages.
Trusted by 1+ million students worldwide
1 out of 18
Related Documents


Your All-in-One AI-Powered Toolkit for Academic Success.
+13062052269
info@desklib.com
Available 24*7 on WhatsApp / Email
![[object Object]](/_next/static/media/star-bottom.7253800d.svg)
Unlock your academic potential
Copyright © 2020–2026 A2Z Services. All Rights Reserved. Developed and managed by ZUCOL.