Comprehensive Financial Analysis of Fortescue Metals Group Limited
VerifiedAdded on 2021/06/14
|11
|2365
|250
Project
AI Summary
This project report provides a comprehensive financial analysis of Fortescue Metals Group Limited, evaluating its performance to offer insights to the Chief Financial Officer. The report calculates the company's Weighted Average Cost of Capital (WACC) to determine its total cost of capital and discount rate. It also examines the capital structure to assess the company's risk and competitive position, and analyzes the dividend policy to evaluate its attractiveness to stockholders. The study further explores corporate financial policies and dividend policies, assessing their impact on the company's stock price and market position. The analysis includes calculations of debt and equity costs, dividend payout ratios, and the influence of market factors on stock price fluctuations. The report concludes with recommendations based on the financial analysis, highlighting the company's competitive financial position and suggesting strategies for future financial decisions.
Running Head: Financial Management
1
Project Report: Financial Management
1
Project Report: Financial Management
Paraphrase This Document
Need a fresh take? Get an instant paraphrase of this document with our AI Paraphraser
Financial Management
2
Contents
Introduction.......................................................................................................................3
Company overview...........................................................................................................3
WACC of the company....................................................................................................3
Capital structure of the company......................................................................................5
Dividend policy of the company.......................................................................................6
Corporate financial policies and dividend policies...........................................................8
Recommendation and conclusion:....................................................................................8
References.......................................................................................................................10
Financial Management
3
Introduction:
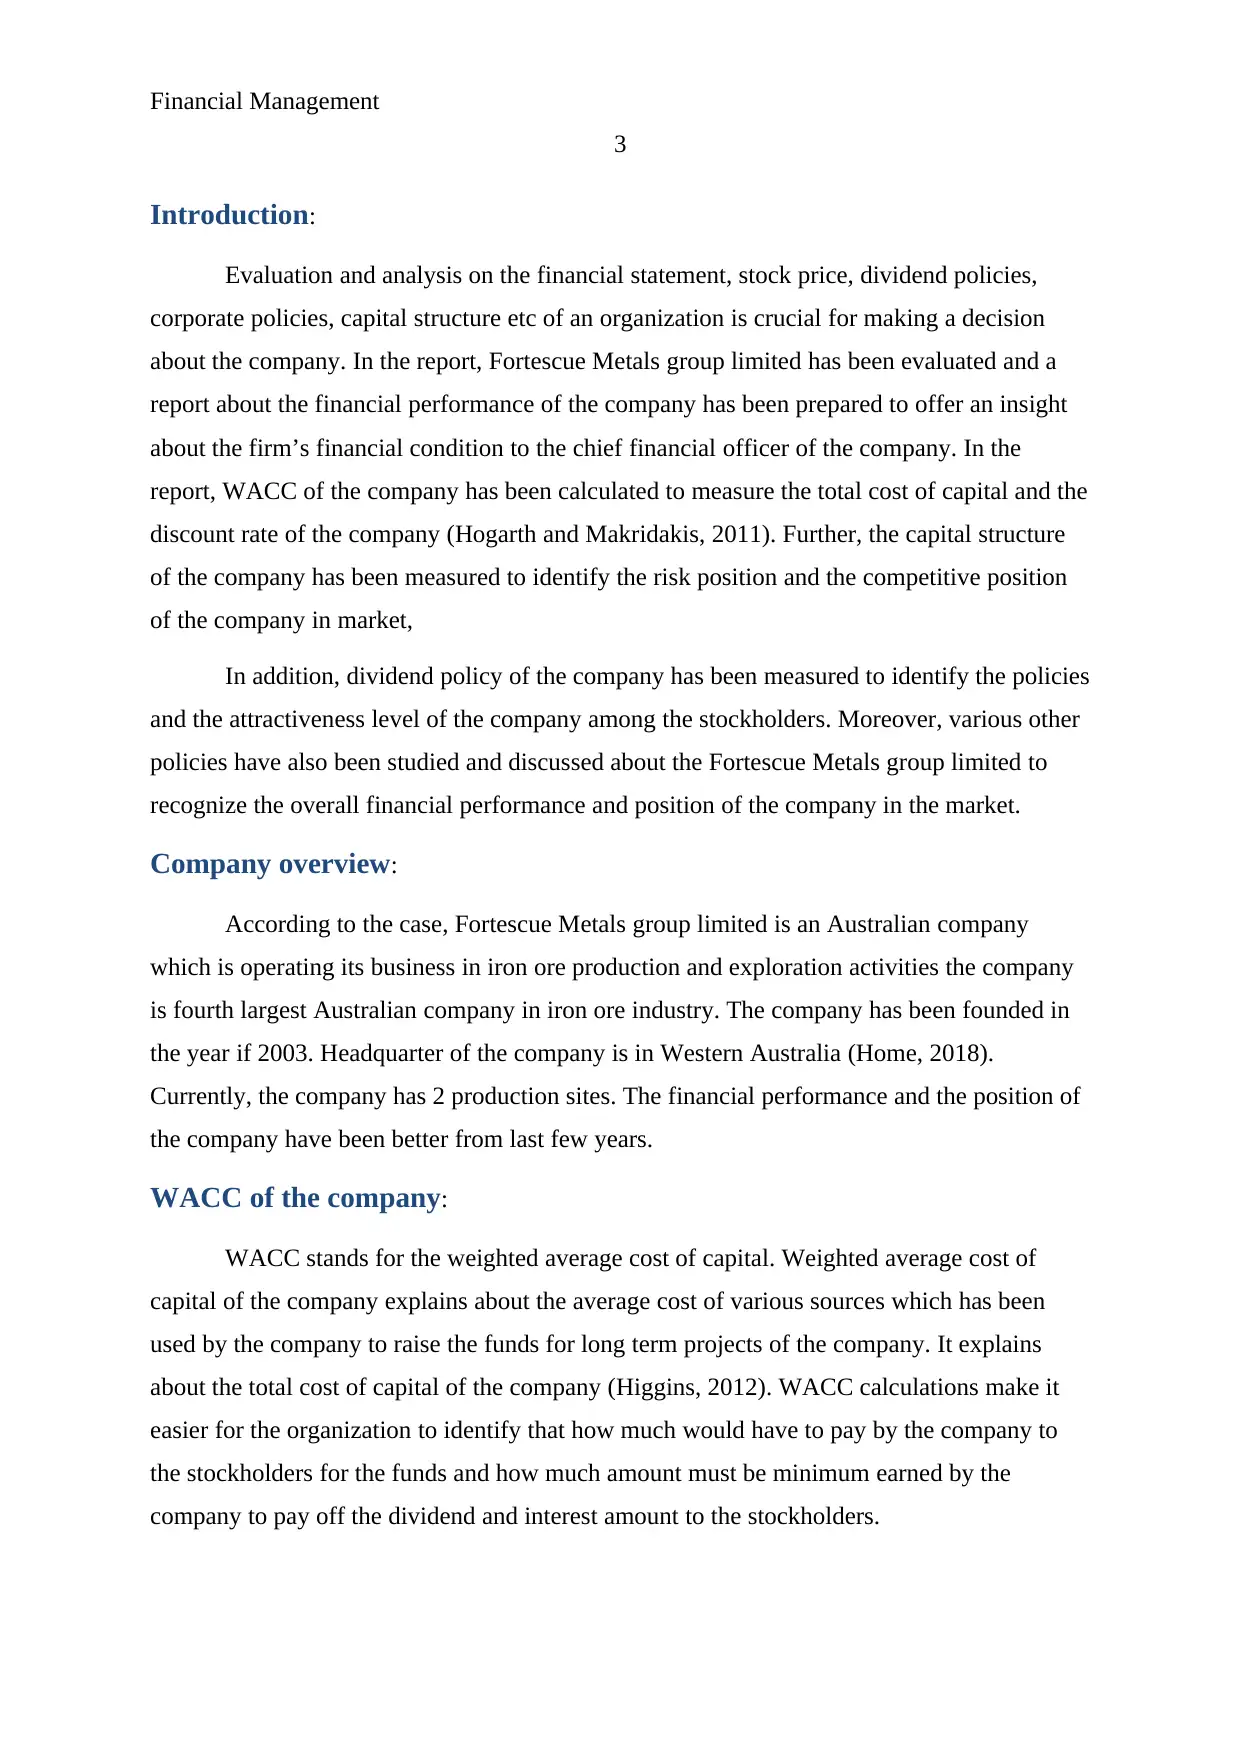
Evaluation and analysis on the financial statement, stock price, dividend policies,
corporate policies, capital structure etc of an organization is crucial for making a decision
about the company. In the report, Fortescue Metals group limited has been evaluated and a
report about the financial performance of the company has been prepared to offer an insight
about the firm’s financial condition to the chief financial officer of the company. In the
report, WACC of the company has been calculated to measure the total cost of capital and the
discount rate of the company (Hogarth and Makridakis, 2011). Further, the capital structure
of the company has been measured to identify the risk position and the competitive position
of the company in market,
In addition, dividend policy of the company has been measured to identify the policies
and the attractiveness level of the company among the stockholders. Moreover, various other
policies have also been studied and discussed about the Fortescue Metals group limited to
recognize the overall financial performance and position of the company in the market.
Company overview:
According to the case, Fortescue Metals group limited is an Australian company
which is operating its business in iron ore production and exploration activities the company
is fourth largest Australian company in iron ore industry. The company has been founded in
the year if 2003. Headquarter of the company is in Western Australia (Home, 2018).
Currently, the company has 2 production sites. The financial performance and the position of
the company have been better from last few years.
WACC of the company:
WACC stands for the weighted average cost of capital. Weighted average cost of
capital of the company explains about the average cost of various sources which has been
used by the company to raise the funds for long term projects of the company. It explains
about the total cost of capital of the company (Higgins, 2012). WACC calculations make it
easier for the organization to identify that how much would have to pay by the company to
the stockholders for the funds and how much amount must be minimum earned by the
company to pay off the dividend and interest amount to the stockholders.
3
Introduction:
Evaluation and analysis on the financial statement, stock price, dividend policies,
corporate policies, capital structure etc of an organization is crucial for making a decision
about the company. In the report, Fortescue Metals group limited has been evaluated and a
report about the financial performance of the company has been prepared to offer an insight
about the firm’s financial condition to the chief financial officer of the company. In the
report, WACC of the company has been calculated to measure the total cost of capital and the
discount rate of the company (Hogarth and Makridakis, 2011). Further, the capital structure
of the company has been measured to identify the risk position and the competitive position
of the company in market,
In addition, dividend policy of the company has been measured to identify the policies
and the attractiveness level of the company among the stockholders. Moreover, various other
policies have also been studied and discussed about the Fortescue Metals group limited to
recognize the overall financial performance and position of the company in the market.
Company overview:
According to the case, Fortescue Metals group limited is an Australian company
which is operating its business in iron ore production and exploration activities the company
is fourth largest Australian company in iron ore industry. The company has been founded in
the year if 2003. Headquarter of the company is in Western Australia (Home, 2018).
Currently, the company has 2 production sites. The financial performance and the position of
the company have been better from last few years.
WACC of the company:
WACC stands for the weighted average cost of capital. Weighted average cost of
capital of the company explains about the average cost of various sources which has been
used by the company to raise the funds for long term projects of the company. It explains
about the total cost of capital of the company (Higgins, 2012). WACC calculations make it
easier for the organization to identify that how much would have to pay by the company to
the stockholders for the funds and how much amount must be minimum earned by the
company to pay off the dividend and interest amount to the stockholders.
⊘ This is a preview!⊘
Do you want full access?
Subscribe today to unlock all pages.
Trusted by 1+ million students worldwide
Financial Management
4
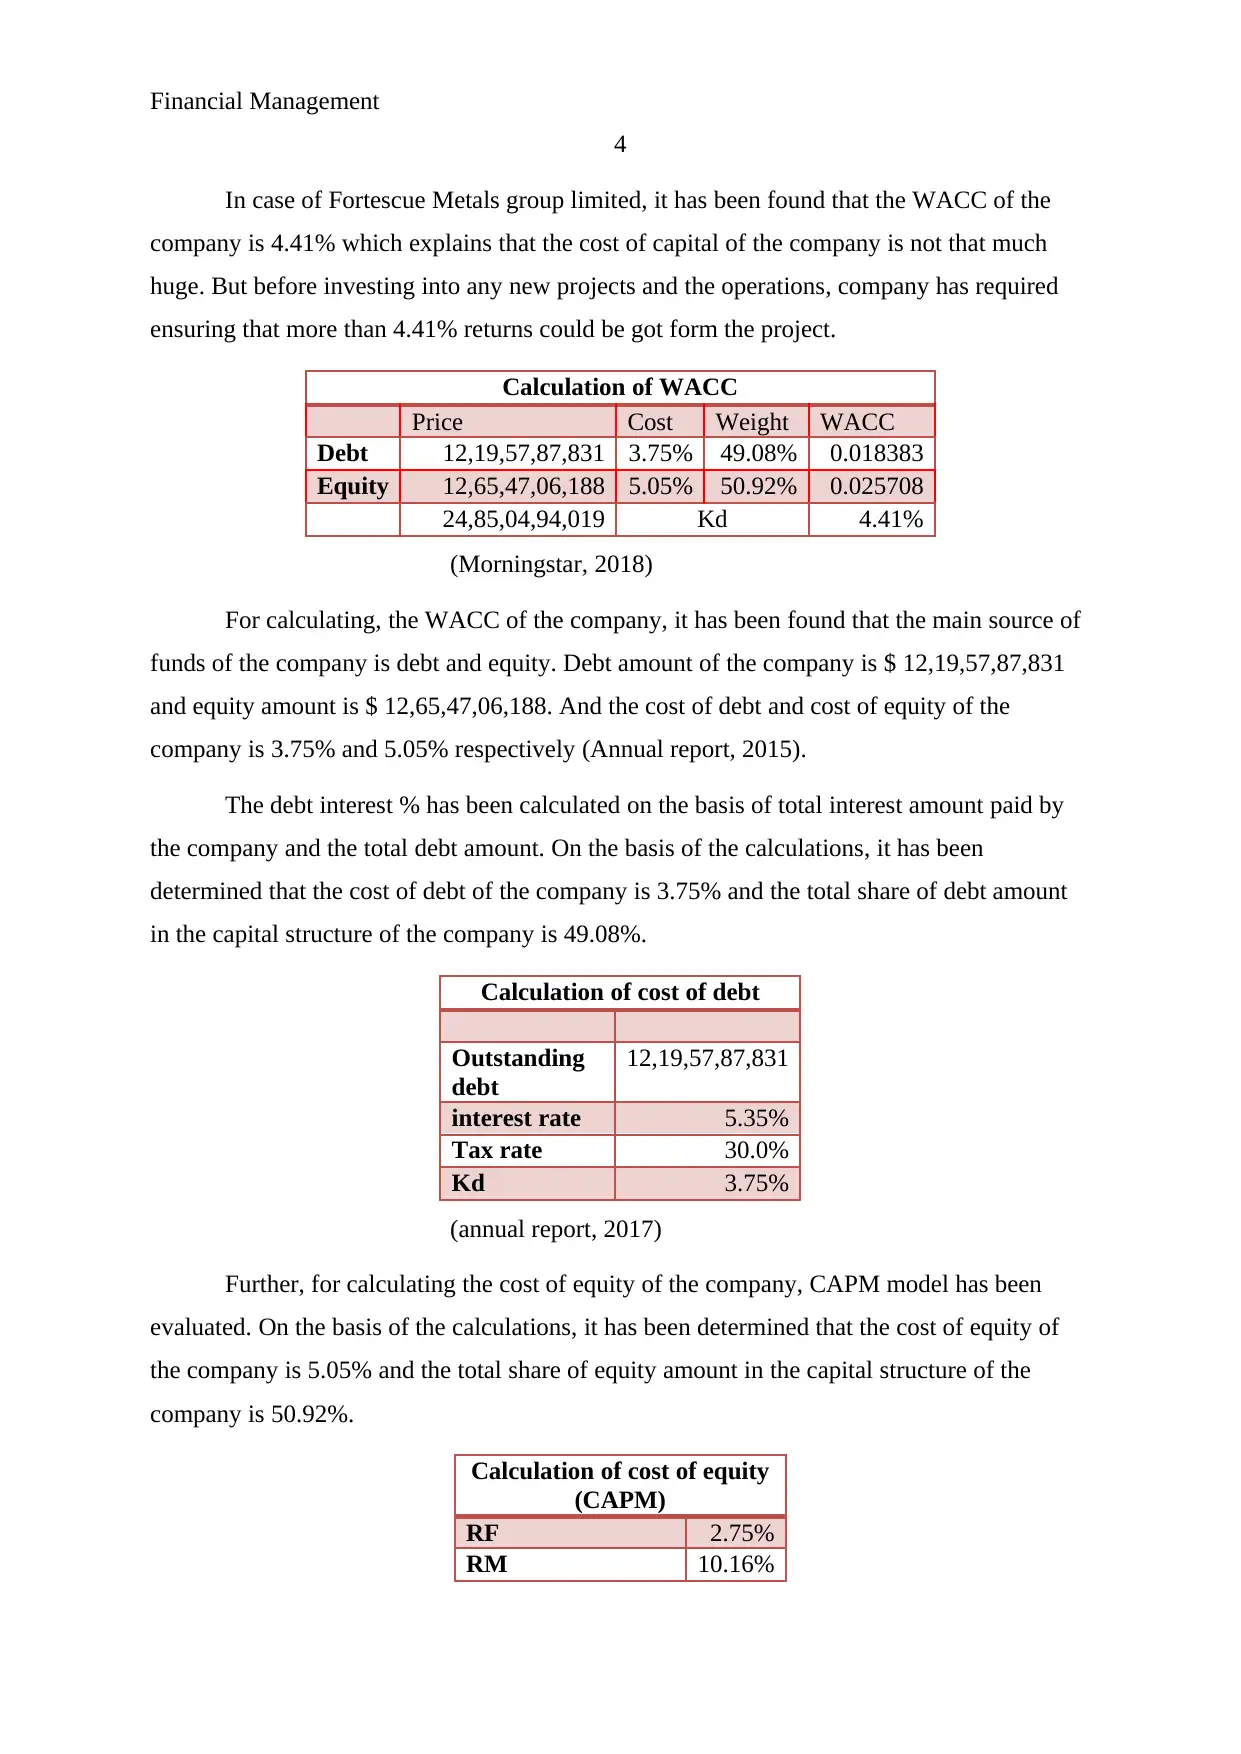
In case of Fortescue Metals group limited, it has been found that the WACC of the
company is 4.41% which explains that the cost of capital of the company is not that much
huge. But before investing into any new projects and the operations, company has required
ensuring that more than 4.41% returns could be got form the project.
Calculation of WACC
Price Cost Weight WACC
Debt 12,19,57,87,831 3.75% 49.08% 0.018383
Equity 12,65,47,06,188 5.05% 50.92% 0.025708
24,85,04,94,019 Kd 4.41%
(Morningstar, 2018)
For calculating, the WACC of the company, it has been found that the main source of
funds of the company is debt and equity. Debt amount of the company is $ 12,19,57,87,831
and equity amount is $ 12,65,47,06,188. And the cost of debt and cost of equity of the
company is 3.75% and 5.05% respectively (Annual report, 2015).
The debt interest % has been calculated on the basis of total interest amount paid by
the company and the total debt amount. On the basis of the calculations, it has been
determined that the cost of debt of the company is 3.75% and the total share of debt amount
in the capital structure of the company is 49.08%.
Calculation of cost of debt
Outstanding
debt
12,19,57,87,831
interest rate 5.35%
Tax rate 30.0%
Kd 3.75%
(annual report, 2017)
Further, for calculating the cost of equity of the company, CAPM model has been
evaluated. On the basis of the calculations, it has been determined that the cost of equity of
the company is 5.05% and the total share of equity amount in the capital structure of the
company is 50.92%.
Calculation of cost of equity
(CAPM)
RF 2.75%
RM 10.16%
4
In case of Fortescue Metals group limited, it has been found that the WACC of the
company is 4.41% which explains that the cost of capital of the company is not that much
huge. But before investing into any new projects and the operations, company has required
ensuring that more than 4.41% returns could be got form the project.
Calculation of WACC
Price Cost Weight WACC
Debt 12,19,57,87,831 3.75% 49.08% 0.018383
Equity 12,65,47,06,188 5.05% 50.92% 0.025708
24,85,04,94,019 Kd 4.41%
(Morningstar, 2018)
For calculating, the WACC of the company, it has been found that the main source of
funds of the company is debt and equity. Debt amount of the company is $ 12,19,57,87,831
and equity amount is $ 12,65,47,06,188. And the cost of debt and cost of equity of the
company is 3.75% and 5.05% respectively (Annual report, 2015).
The debt interest % has been calculated on the basis of total interest amount paid by
the company and the total debt amount. On the basis of the calculations, it has been
determined that the cost of debt of the company is 3.75% and the total share of debt amount
in the capital structure of the company is 49.08%.
Calculation of cost of debt
Outstanding
debt
12,19,57,87,831
interest rate 5.35%
Tax rate 30.0%
Kd 3.75%
(annual report, 2017)
Further, for calculating the cost of equity of the company, CAPM model has been
evaluated. On the basis of the calculations, it has been determined that the cost of equity of
the company is 5.05% and the total share of equity amount in the capital structure of the
company is 50.92%.
Calculation of cost of equity
(CAPM)
RF 2.75%
RM 10.16%
Paraphrase This Document
Need a fresh take? Get an instant paraphrase of this document with our AI Paraphraser
Financial Management
5
Beta 0.90
Ke 5.05%
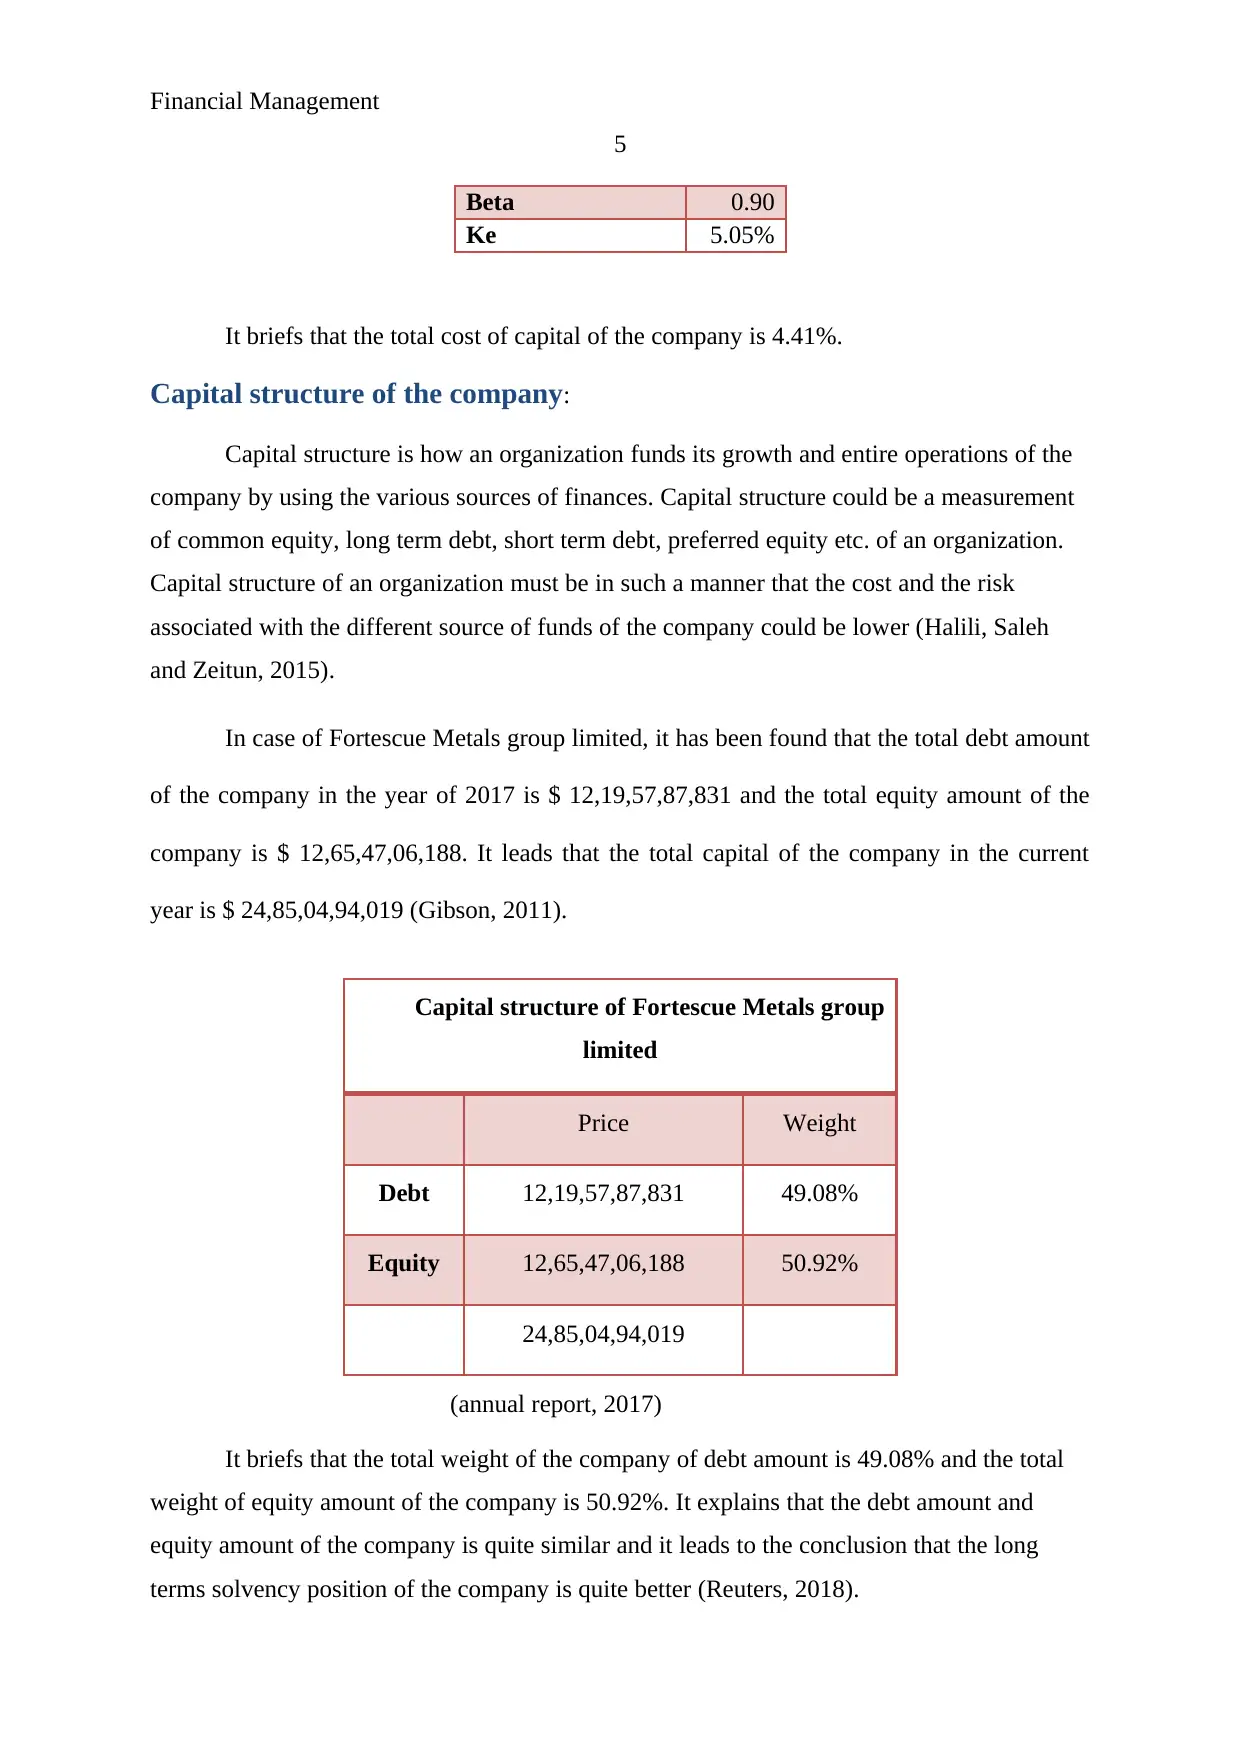
It briefs that the total cost of capital of the company is 4.41%.
Capital structure of the company:
Capital structure is how an organization funds its growth and entire operations of the
company by using the various sources of finances. Capital structure could be a measurement
of common equity, long term debt, short term debt, preferred equity etc. of an organization.
Capital structure of an organization must be in such a manner that the cost and the risk
associated with the different source of funds of the company could be lower (Halili, Saleh
and Zeitun, 2015).
In case of Fortescue Metals group limited, it has been found that the total debt amount
of the company in the year of 2017 is $ 12,19,57,87,831 and the total equity amount of the
company is $ 12,65,47,06,188. It leads that the total capital of the company in the current
year is $ 24,85,04,94,019 (Gibson, 2011).
Capital structure of Fortescue Metals group
limited
Price Weight
Debt 12,19,57,87,831 49.08%
Equity 12,65,47,06,188 50.92%
24,85,04,94,019
(annual report, 2017)
It briefs that the total weight of the company of debt amount is 49.08% and the total
weight of equity amount of the company is 50.92%. It explains that the debt amount and
equity amount of the company is quite similar and it leads to the conclusion that the long
terms solvency position of the company is quite better (Reuters, 2018).
5
Beta 0.90
Ke 5.05%
It briefs that the total cost of capital of the company is 4.41%.
Capital structure of the company:
Capital structure is how an organization funds its growth and entire operations of the
company by using the various sources of finances. Capital structure could be a measurement
of common equity, long term debt, short term debt, preferred equity etc. of an organization.
Capital structure of an organization must be in such a manner that the cost and the risk
associated with the different source of funds of the company could be lower (Halili, Saleh
and Zeitun, 2015).
In case of Fortescue Metals group limited, it has been found that the total debt amount
of the company in the year of 2017 is $ 12,19,57,87,831 and the total equity amount of the
company is $ 12,65,47,06,188. It leads that the total capital of the company in the current
year is $ 24,85,04,94,019 (Gibson, 2011).
Capital structure of Fortescue Metals group
limited
Price Weight
Debt 12,19,57,87,831 49.08%
Equity 12,65,47,06,188 50.92%
24,85,04,94,019
(annual report, 2017)
It briefs that the total weight of the company of debt amount is 49.08% and the total
weight of equity amount of the company is 50.92%. It explains that the debt amount and
equity amount of the company is quite similar and it leads to the conclusion that the long
terms solvency position of the company is quite better (Reuters, 2018).
Financial Management
6
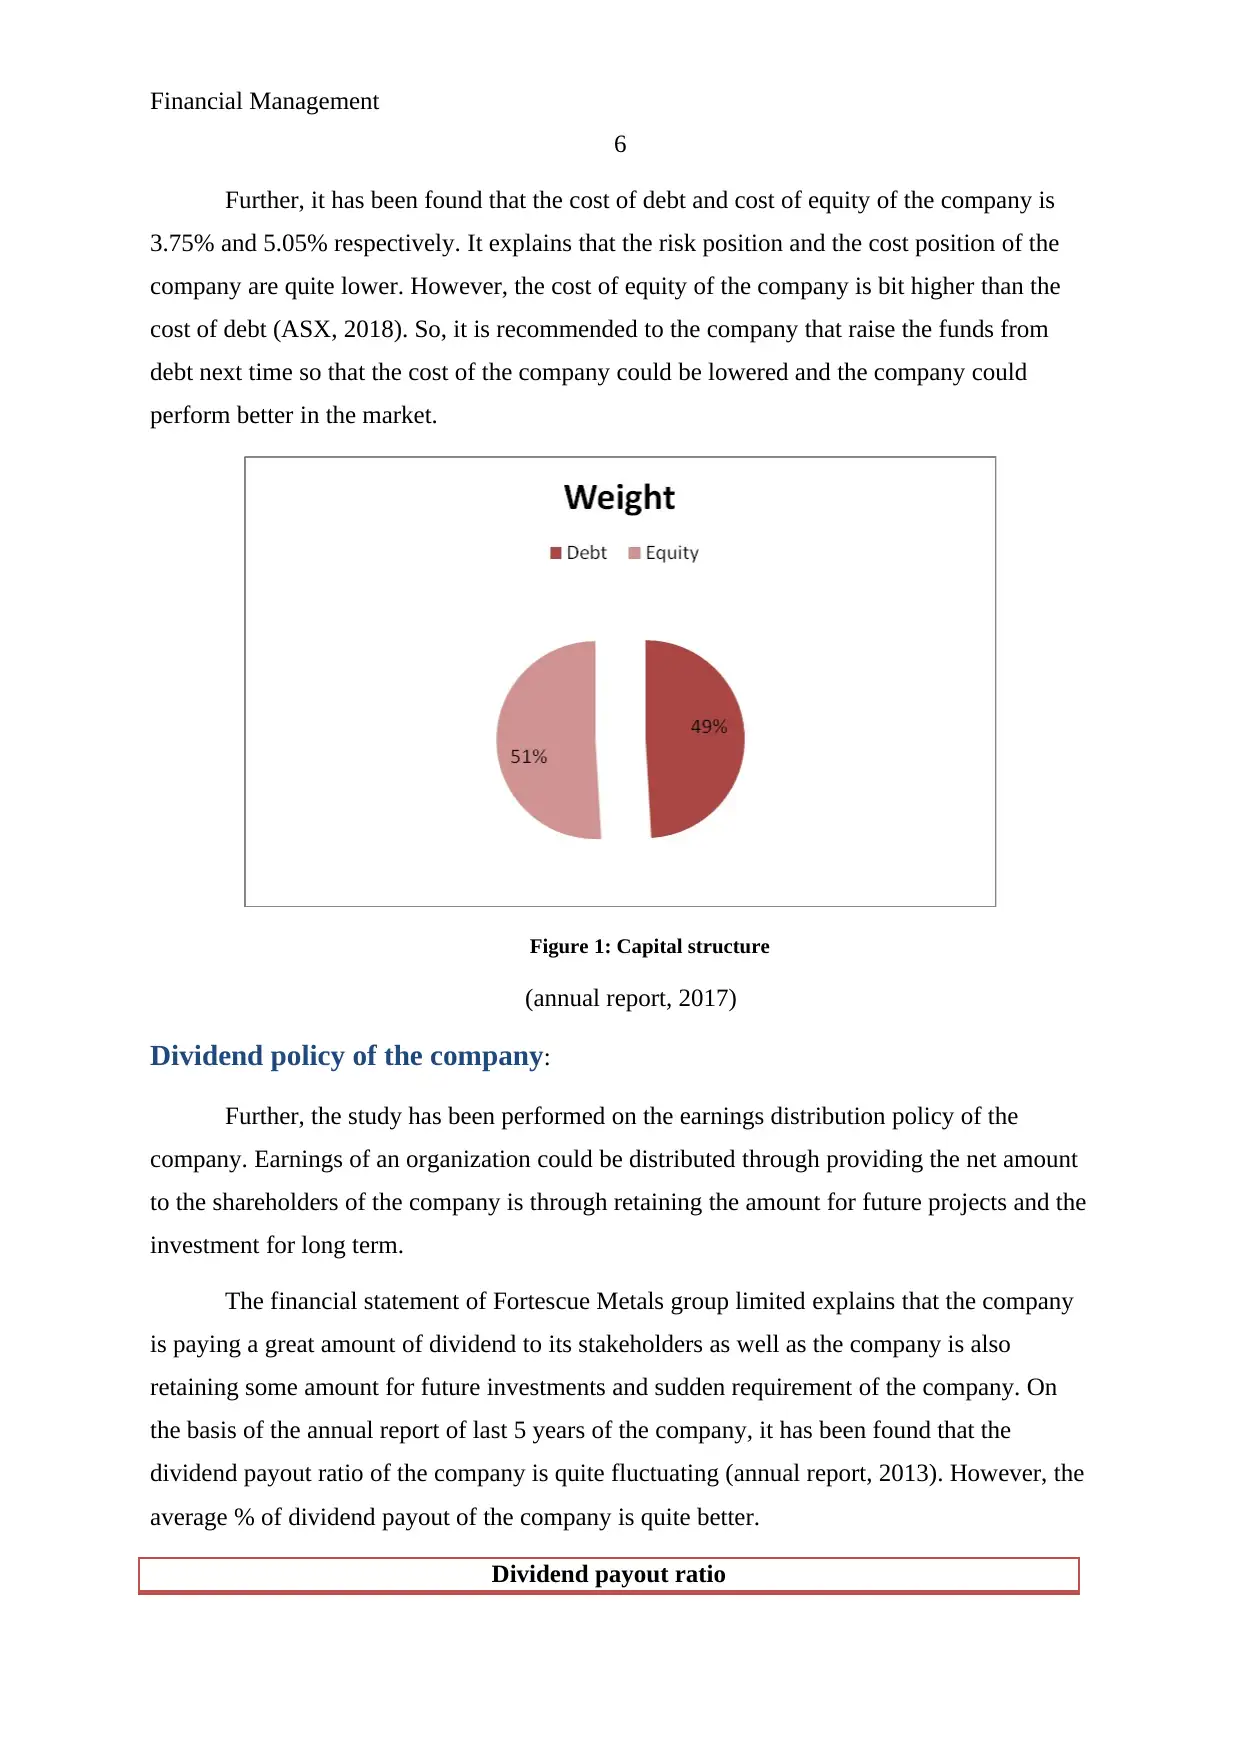
Further, it has been found that the cost of debt and cost of equity of the company is
3.75% and 5.05% respectively. It explains that the risk position and the cost position of the
company are quite lower. However, the cost of equity of the company is bit higher than the
cost of debt (ASX, 2018). So, it is recommended to the company that raise the funds from
debt next time so that the cost of the company could be lowered and the company could
perform better in the market.
Figure 1: Capital structure
(annual report, 2017)
Dividend policy of the company:
Further, the study has been performed on the earnings distribution policy of the
company. Earnings of an organization could be distributed through providing the net amount
to the shareholders of the company is through retaining the amount for future projects and the
investment for long term.
The financial statement of Fortescue Metals group limited explains that the company
is paying a great amount of dividend to its stakeholders as well as the company is also
retaining some amount for future investments and sudden requirement of the company. On
the basis of the annual report of last 5 years of the company, it has been found that the
dividend payout ratio of the company is quite fluctuating (annual report, 2013). However, the
average % of dividend payout of the company is quite better.
Dividend payout ratio
6
Further, it has been found that the cost of debt and cost of equity of the company is
3.75% and 5.05% respectively. It explains that the risk position and the cost position of the
company are quite lower. However, the cost of equity of the company is bit higher than the
cost of debt (ASX, 2018). So, it is recommended to the company that raise the funds from
debt next time so that the cost of the company could be lowered and the company could
perform better in the market.
Figure 1: Capital structure
(annual report, 2017)
Dividend policy of the company:
Further, the study has been performed on the earnings distribution policy of the
company. Earnings of an organization could be distributed through providing the net amount
to the shareholders of the company is through retaining the amount for future projects and the
investment for long term.
The financial statement of Fortescue Metals group limited explains that the company
is paying a great amount of dividend to its stakeholders as well as the company is also
retaining some amount for future investments and sudden requirement of the company. On
the basis of the annual report of last 5 years of the company, it has been found that the
dividend payout ratio of the company is quite fluctuating (annual report, 2013). However, the
average % of dividend payout of the company is quite better.
Dividend payout ratio
⊘ This is a preview!⊘
Do you want full access?
Subscribe today to unlock all pages.
Trusted by 1+ million students worldwide
Financial Management
7
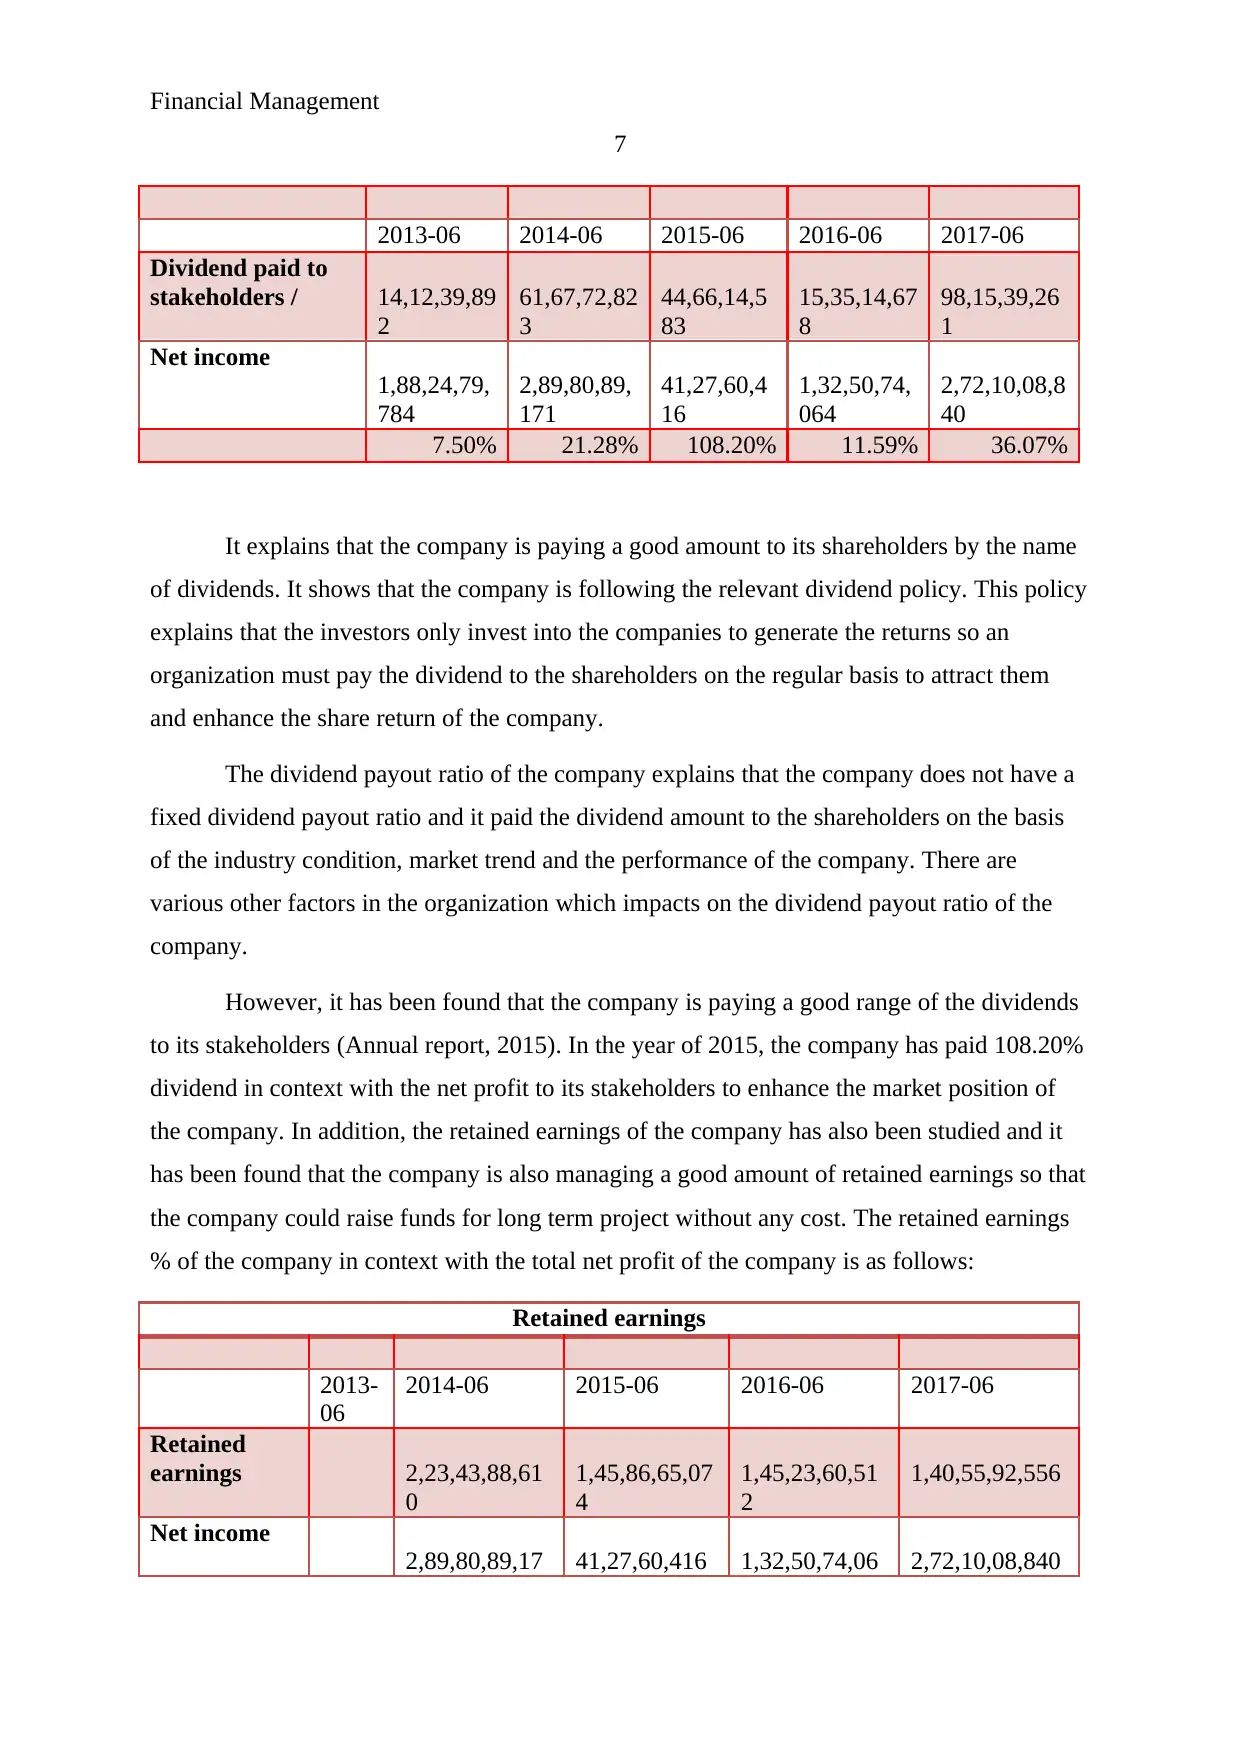
2013-06 2014-06 2015-06 2016-06 2017-06
Dividend paid to
stakeholders / 14,12,39,89
2
61,67,72,82
3
44,66,14,5
83
15,35,14,67
8
98,15,39,26
1
Net income
1,88,24,79,
784
2,89,80,89,
171
41,27,60,4
16
1,32,50,74,
064
2,72,10,08,8
40
7.50% 21.28% 108.20% 11.59% 36.07%
It explains that the company is paying a good amount to its shareholders by the name
of dividends. It shows that the company is following the relevant dividend policy. This policy
explains that the investors only invest into the companies to generate the returns so an
organization must pay the dividend to the shareholders on the regular basis to attract them
and enhance the share return of the company.
The dividend payout ratio of the company explains that the company does not have a
fixed dividend payout ratio and it paid the dividend amount to the shareholders on the basis
of the industry condition, market trend and the performance of the company. There are
various other factors in the organization which impacts on the dividend payout ratio of the
company.
However, it has been found that the company is paying a good range of the dividends
to its stakeholders (Annual report, 2015). In the year of 2015, the company has paid 108.20%
dividend in context with the net profit to its stakeholders to enhance the market position of
the company. In addition, the retained earnings of the company has also been studied and it
has been found that the company is also managing a good amount of retained earnings so that
the company could raise funds for long term project without any cost. The retained earnings
% of the company in context with the total net profit of the company is as follows:
Retained earnings
2013-
06
2014-06 2015-06 2016-06 2017-06
Retained
earnings 2,23,43,88,61
0
1,45,86,65,07
4
1,45,23,60,51
2
1,40,55,92,556
Net income
2,89,80,89,17 41,27,60,416 1,32,50,74,06 2,72,10,08,840
7
2013-06 2014-06 2015-06 2016-06 2017-06
Dividend paid to
stakeholders / 14,12,39,89
2
61,67,72,82
3
44,66,14,5
83
15,35,14,67
8
98,15,39,26
1
Net income
1,88,24,79,
784
2,89,80,89,
171
41,27,60,4
16
1,32,50,74,
064
2,72,10,08,8
40
7.50% 21.28% 108.20% 11.59% 36.07%
It explains that the company is paying a good amount to its shareholders by the name
of dividends. It shows that the company is following the relevant dividend policy. This policy
explains that the investors only invest into the companies to generate the returns so an
organization must pay the dividend to the shareholders on the regular basis to attract them
and enhance the share return of the company.
The dividend payout ratio of the company explains that the company does not have a
fixed dividend payout ratio and it paid the dividend amount to the shareholders on the basis
of the industry condition, market trend and the performance of the company. There are
various other factors in the organization which impacts on the dividend payout ratio of the
company.
However, it has been found that the company is paying a good range of the dividends
to its stakeholders (Annual report, 2015). In the year of 2015, the company has paid 108.20%
dividend in context with the net profit to its stakeholders to enhance the market position of
the company. In addition, the retained earnings of the company has also been studied and it
has been found that the company is also managing a good amount of retained earnings so that
the company could raise funds for long term project without any cost. The retained earnings
% of the company in context with the total net profit of the company is as follows:
Retained earnings
2013-
06
2014-06 2015-06 2016-06 2017-06
Retained
earnings 2,23,43,88,61
0
1,45,86,65,07
4
1,45,23,60,51
2
1,40,55,92,556
Net income
2,89,80,89,17 41,27,60,416 1,32,50,74,06 2,72,10,08,840
Paraphrase This Document
Need a fresh take? Get an instant paraphrase of this document with our AI Paraphraser
Financial Management
8
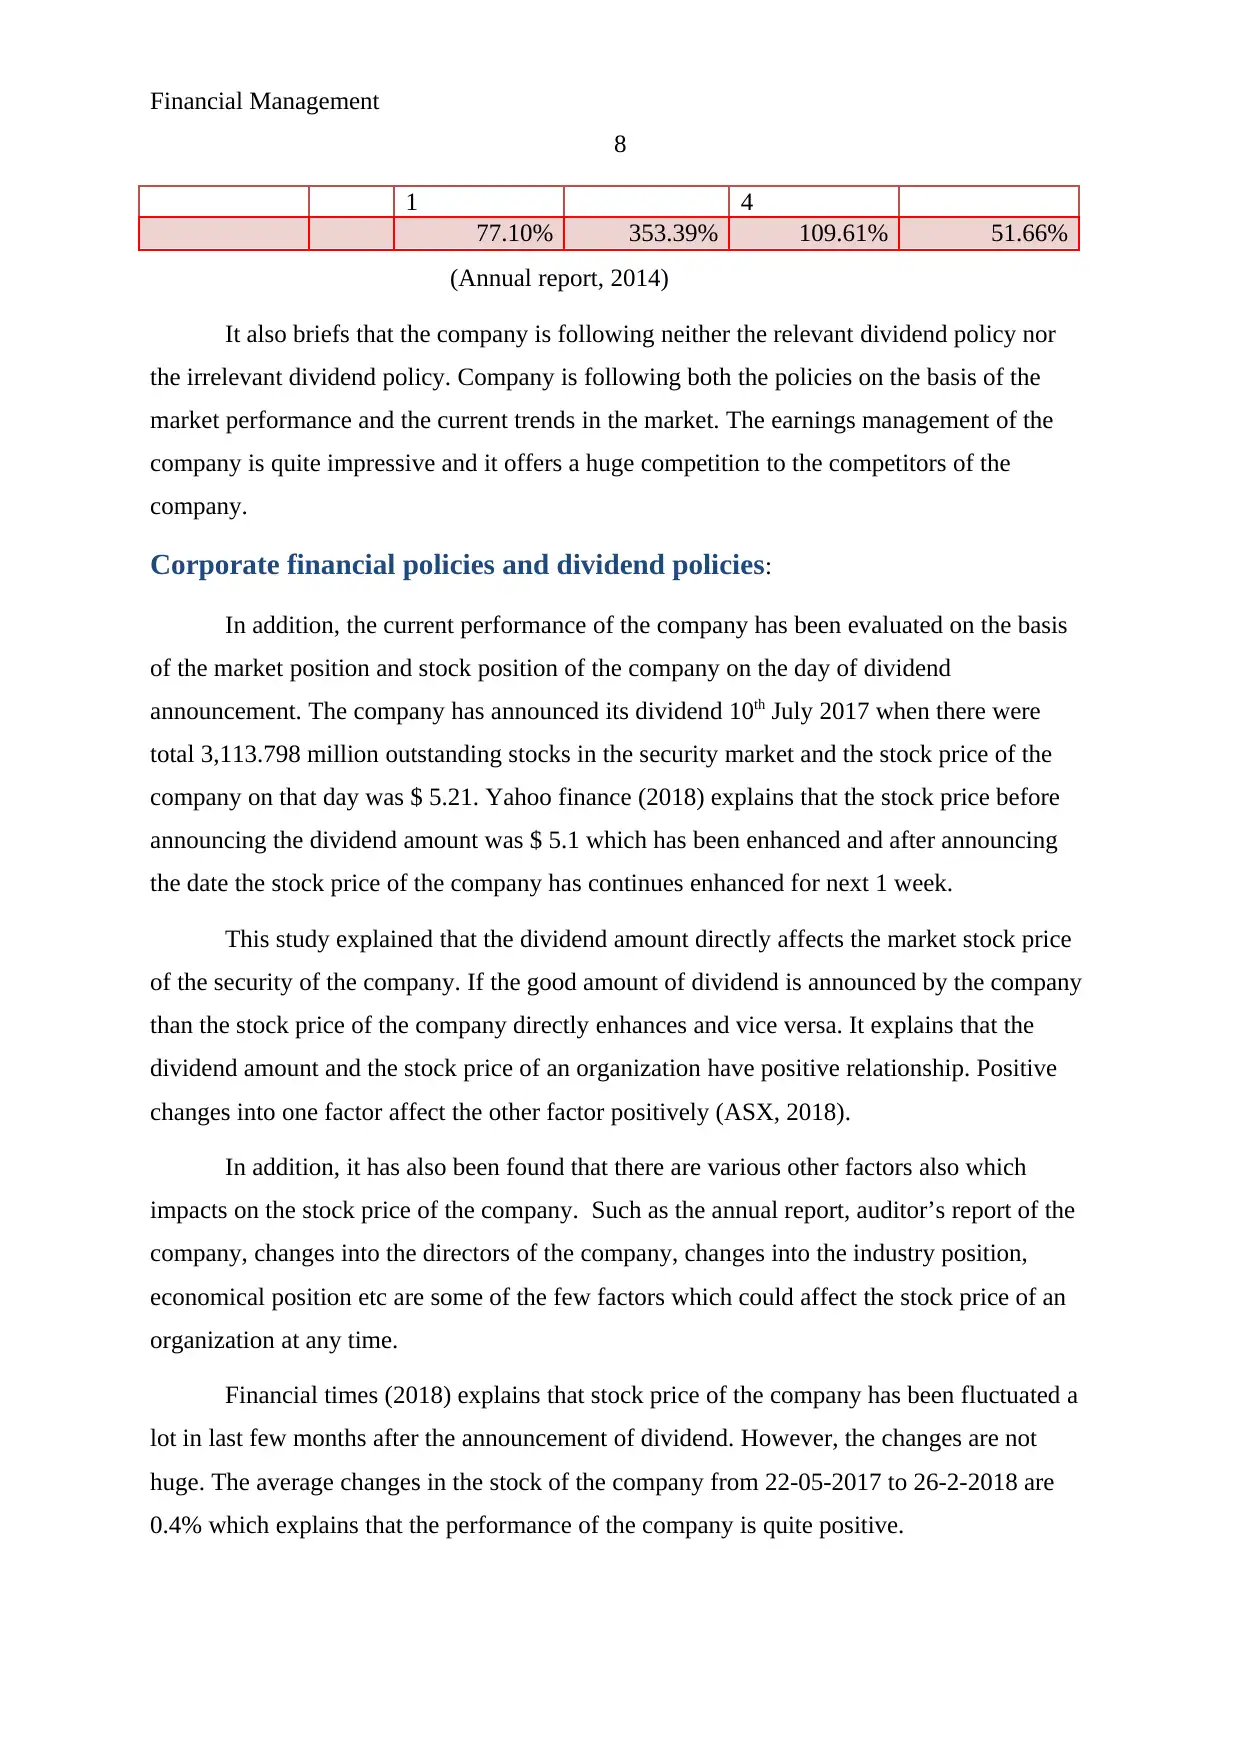
1 4
77.10% 353.39% 109.61% 51.66%
(Annual report, 2014)
It also briefs that the company is following neither the relevant dividend policy nor
the irrelevant dividend policy. Company is following both the policies on the basis of the
market performance and the current trends in the market. The earnings management of the
company is quite impressive and it offers a huge competition to the competitors of the
company.
Corporate financial policies and dividend policies:
In addition, the current performance of the company has been evaluated on the basis
of the market position and stock position of the company on the day of dividend
announcement. The company has announced its dividend 10th July 2017 when there were
total 3,113.798 million outstanding stocks in the security market and the stock price of the
company on that day was $ 5.21. Yahoo finance (2018) explains that the stock price before
announcing the dividend amount was $ 5.1 which has been enhanced and after announcing
the date the stock price of the company has continues enhanced for next 1 week.
This study explained that the dividend amount directly affects the market stock price
of the security of the company. If the good amount of dividend is announced by the company
than the stock price of the company directly enhances and vice versa. It explains that the
dividend amount and the stock price of an organization have positive relationship. Positive
changes into one factor affect the other factor positively (ASX, 2018).
In addition, it has also been found that there are various other factors also which
impacts on the stock price of the company. Such as the annual report, auditor’s report of the
company, changes into the directors of the company, changes into the industry position,
economical position etc are some of the few factors which could affect the stock price of an
organization at any time.
Financial times (2018) explains that stock price of the company has been fluctuated a
lot in last few months after the announcement of dividend. However, the changes are not
huge. The average changes in the stock of the company from 22-05-2017 to 26-2-2018 are
0.4% which explains that the performance of the company is quite positive.
8
1 4
77.10% 353.39% 109.61% 51.66%
(Annual report, 2014)
It also briefs that the company is following neither the relevant dividend policy nor
the irrelevant dividend policy. Company is following both the policies on the basis of the
market performance and the current trends in the market. The earnings management of the
company is quite impressive and it offers a huge competition to the competitors of the
company.
Corporate financial policies and dividend policies:
In addition, the current performance of the company has been evaluated on the basis
of the market position and stock position of the company on the day of dividend
announcement. The company has announced its dividend 10th July 2017 when there were
total 3,113.798 million outstanding stocks in the security market and the stock price of the
company on that day was $ 5.21. Yahoo finance (2018) explains that the stock price before
announcing the dividend amount was $ 5.1 which has been enhanced and after announcing
the date the stock price of the company has continues enhanced for next 1 week.
This study explained that the dividend amount directly affects the market stock price
of the security of the company. If the good amount of dividend is announced by the company
than the stock price of the company directly enhances and vice versa. It explains that the
dividend amount and the stock price of an organization have positive relationship. Positive
changes into one factor affect the other factor positively (ASX, 2018).
In addition, it has also been found that there are various other factors also which
impacts on the stock price of the company. Such as the annual report, auditor’s report of the
company, changes into the directors of the company, changes into the industry position,
economical position etc are some of the few factors which could affect the stock price of an
organization at any time.
Financial times (2018) explains that stock price of the company has been fluctuated a
lot in last few months after the announcement of dividend. However, the changes are not
huge. The average changes in the stock of the company from 22-05-2017 to 26-2-2018 are
0.4% which explains that the performance of the company is quite positive.
Financial Management
9
The stock price of the company has been fluctuated due to changes into the
economical position, reduction in the industry share, internal changes into the company, new
projects of the company and the strategies of the company. The exchange rate has also played
a major role in fluctuate the security price of the company.
Recommendation and conclusion:
On the basis of the above analysis on Fortescue Metals group limited of the company,
it has been measured that the performance of the company is quite significant in the market.
The WACC position of the company explains about the lower cost of the company as well as
the capital structure of the company explains that the cost and the risk level of the company is
lower and thus the structure of the company is quite optimal.
It has also been recognized that the dividend payout ratio, retained earnings and the
earnings distribution policies of the company are also significant and have been prepared by
the company in such a way that the company could retain some profits for future investment
and the amount could also be given to the shareholders for attract them. The stock position of
the company is also impressive. To conclude, the financial position and the performance of
the company are quite competitive.
⊘ This is a preview!⊘
Do you want full access?
Subscribe today to unlock all pages.
Trusted by 1+ million students worldwide
Financial Management
10
References:
Annual report. 2013. Fortescue Metals group limited. Available at:
https://www.fmg.co.nz/globalassets/about-fmg/corporate-information/annual-report-and-
publications/fmg-annual-report-2013.pdf (accessed 22/05/2018).
Annual report. 2014. Fortescue Metals group limited. Available at:
https://www.fmg.co.nz/globalassets/about-fmg/corporate-information/annual-report-and-
publications/fmg-annual-report-2014.pdf (accessed 22/05/2018).
Annual report. 2015. Fortescue Metals group limited. Available at:
https://www.fmg.co.nz/globalassets/about-fmg/corporate-information/annual-report-and-
publications/2743_fmg_annualreport_2015_vfinal_digital_mr.pdf (accessed 22/05/2018).
Annual report. 2016. Fortescue Metals group limited. Available at:
https://www.fmg.co.nz/globalassets/about-fmg/corporate-information/annual-report-and-
publications/fmg_annual_report_2016.pdf (accessed 22/05/2018).
Annual report. 2017. Fortescue Metals group limited. Available at:
https://www.fmgl.com.au/docs/default-source/default-document-library/fy2017-annual-
report.pdf?sfvrsn=1f931875_2 (accessed 22/05/2018).
ASX. 2018. Fortescue Metals group limited. Available at: https://www.asx.com.au/asx/share-
price-research/company/FMG (accessed 22/05/2018).
Financial Times. 2018. Fortescue Metals group limited. Available at:
https://markets.ft.com/data/equities/tearsheet/forecasts?s=FMG:ASX (accessed 22/05/2018).
Gibson, C.H., 2011. Financial reporting and analysis. South-Western Cengage Learning.
Halili, E, Saleh, A and Zeitun, R. 2015. 'Governance and Long-Term Operating Performance
of Family and Non-Family Firms in Australia', Studies in Economics and Finance, vol.32,
no.4, pp.398-421.
Higgins, R.C., 2012. Analysis for financial management. McGraw-Hill/Irwin.
Hogarth, R.M. and Makridakis, S., 2011. Forecasting and planning: An
evaluation. Management science, 27(2), pp.115-138.
Home. 2018. Fortescue Metals group limited. Available at: https://www.fmg.co.nz/ (accessed
22/05/2018).
Paraphrase This Document
Need a fresh take? Get an instant paraphrase of this document with our AI Paraphraser
Financial Management
11
Morningstar. 2018. Fortescue Metals group limited. Available at:
http://financials.morningstar.com/balance-sheet/bs.html?t=FMG®ion=aus&culture=en-
US (accessed 22/05/2018).
Reuters. 2018. Fortescue Metals group limited. Available at:
https://www.reuters.com/finance/stocks/financial-highlights/FMG.AX (accessed 22/05/2018).
Yahoo finance. 2018. Fortescue Metals group limited. Available at:
https://finance.yahoo.com/quote/FMG.AX/history?
period1=1495436782&period2=1526972782&interval=1d&filter=history&frequency=1d
(accessed 22/05/2018).
1 out of 11
Related Documents


Your All-in-One AI-Powered Toolkit for Academic Success.
+13062052269
info@desklib.com
Available 24*7 on WhatsApp / Email
![[object Object]](/_next/static/media/star-bottom.7253800d.svg)
Unlock your academic potential
Copyright © 2020–2026 A2Z Services. All Rights Reserved. Developed and managed by ZUCOL.