Accounting & Finance: Comparative Analysis of Gambling Companies

Verified

Added on  2024/05/17

|18
|3712
|286
Report
AI Summary
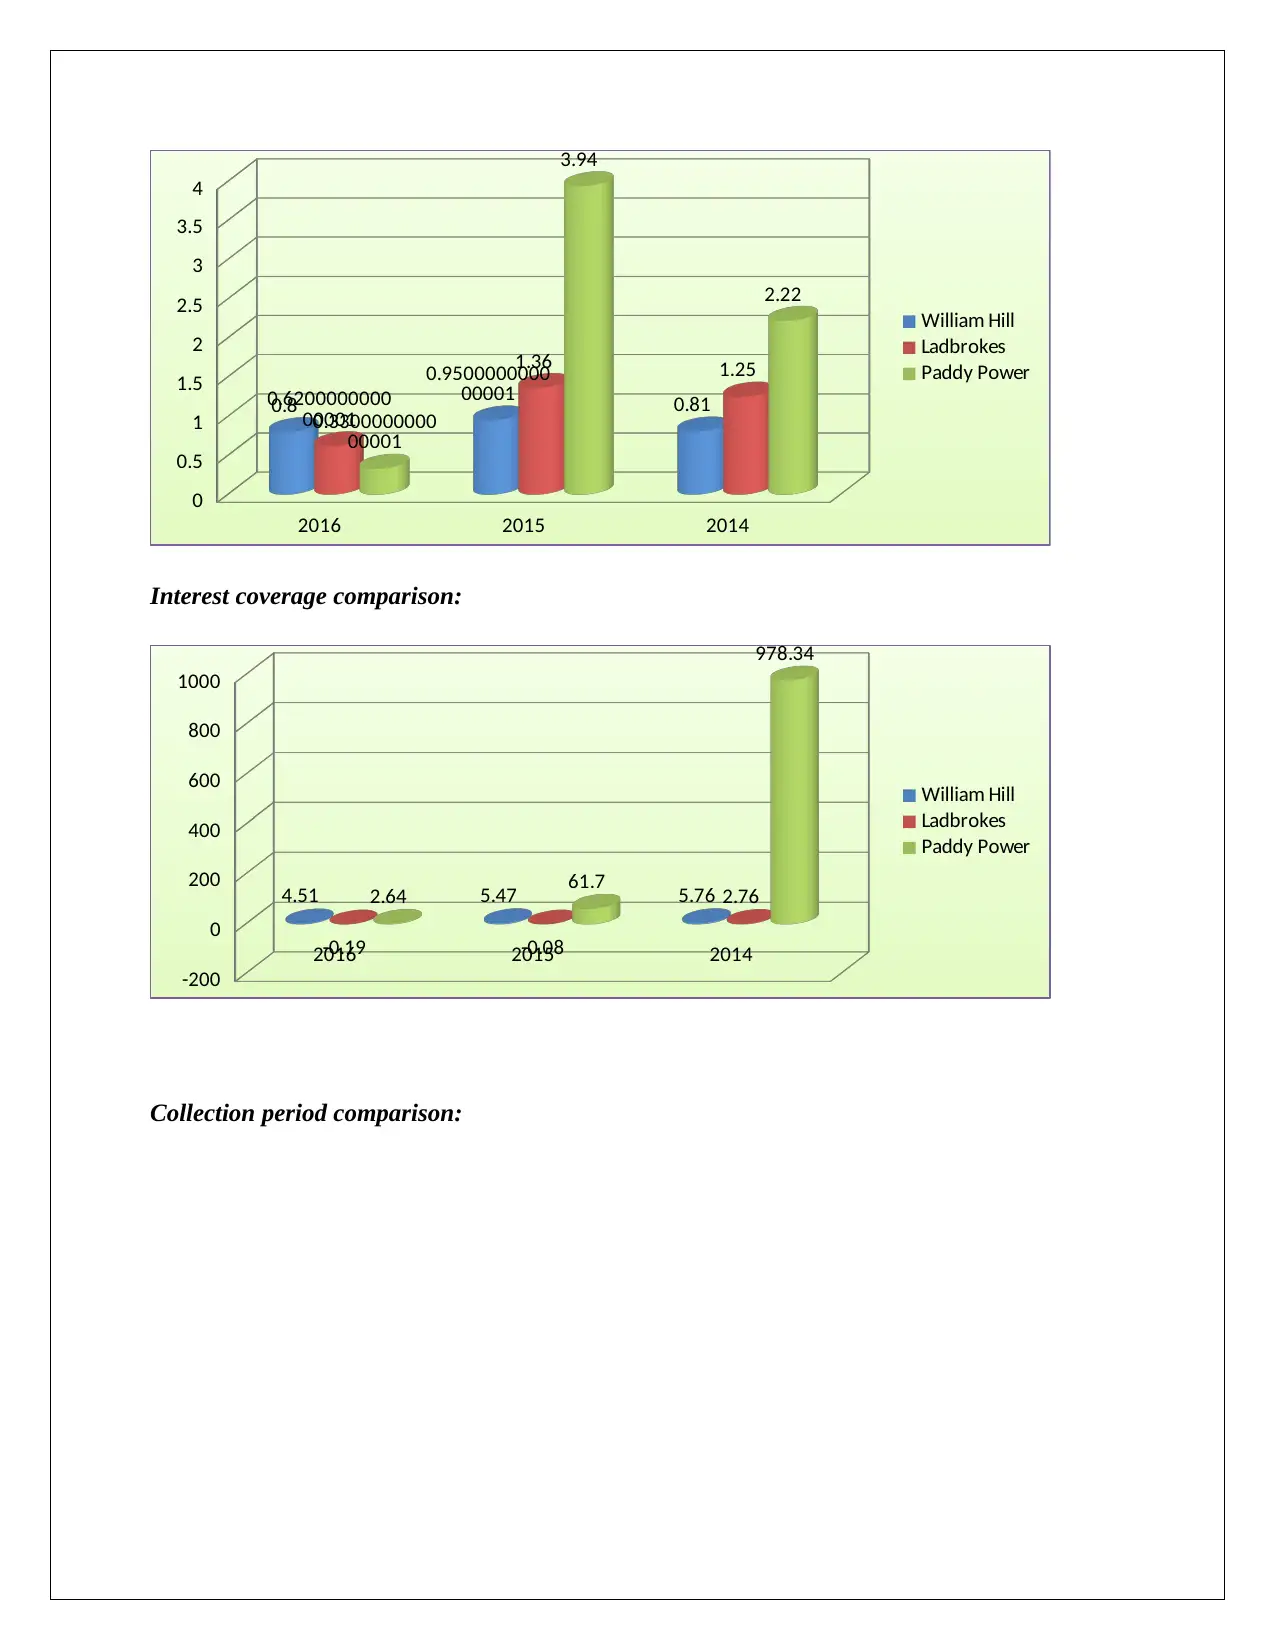
This report provides a financial analysis of three gambling companies in the United Kingdom (William Hill, Ladbrokes and Paddy Power) using financial ratios from 2014 to 2016. It assesses profitability, liquidity, operational efficiency, and gearing ratios. The analysis compares the financial performance of the three organizations, identifying Paddy Power as the best-performing company due to its superior profitability, liquidity, and operational efficiency, making it a favorable investment choice. Conversely, Ladbrokes is identified as the poorest-performing company, with suggestions for improving its profitability, efficiency, and asset management. The report concludes that while all three companies experienced similar trends, Paddy Power demonstrated greater financial stability and potential for future growth.
Document Page
ACCOUNTING AND FINANCE FOR
MANAGERS
tabler-icon-diamond-filled.svg

Paraphrase This Document

Need a fresh take? Get an instant paraphrase of this document with our AI Paraphraser
Document Page
Table of contents
Section A.........................................................................................................................................3
1. a Financial ratio analysis.............................................................................................................3
1. b Identifying the best performing company...............................................................................11
1. c Identifying the poor performing company..............................................................................12
2.a Identifying and explaining the key stages in the capital investment decision making process
.......................................................................................................................................................13
2.b Identifying and explaining the key methods of investment appraisal.....................................14
Reference list.................................................................................................................................17
Document Page
Section A
1. a Financial ratio analysis
Financial ratios may be regarded as one of the most reliable signs of the performance of
companies. Examining the development scene of the Gambling industry in the United Kingdom,
it can be concluded that scutinising the performances of the organizations is paramount. In this
table the performances of the said three Gambling organisations in the United Kingdom have
been perused utilizing the financial ratios:
Financial ratios of William Hill:
Financial ratios 2016 2015 2014
Profitability ratios:
ROA using the net income 6.73 8.09 8.67
EBIT margin 13.72 14.01 17.41
Gross profit margin 81.74 85.27 88.57
Liquidity ratios:
Current ratio 0.71 0.52 0.76
Shareholders liquidity ratio 1.52 2.60 1.36
Operational ratios:
Credit period (days) 29 24 24
Collection period (days) 5 1 2
Net assets turnover 0.80 0.95 0.81
Interest cover 4.51 5.47 5.76
Gearing ratio:
Gearing 65.86 63.07 73.30
(Source: Sports.williamhill.com 2018)
Document Page
Financial ratios of Ladbrokes:
Financial ratios 2016 2015 2014
Profitability ratios:
ROA using the net income -6.02 0.45 3.52
EBIT margin -0.50 -0.19 6.72
Gross profit margin -14.15 -3.60 3.21
Liquidity ratios:
Current ratio 0.33 0.65 0.59
Shareholders liquidity ratio 1.45 1.07 0.71
Operational ratios:
Credit period (days) 25 15 16
Collection period (days) 1 2 2
Net assets turnover 0.62 1.36 1.25
Interest cover -0.19 -0.08 2.76
Gearing ratio:
Gearing 96.75 93.19 140.90
(Source: Ladbrokes.com 2018)
Financial ratios of Paddy Power:
Financial ratios 2016 2015 2014
Profitability ratios:
ROA using the net income -0.11 26.41 22.87
EBIT margin 0.88 15.54 18.42
Gross profit margin 76.91 75.92 80.97
tabler-icon-diamond-filled.svg

Paraphrase This Document

Need a fresh take? Get an instant paraphrase of this document with our AI Paraphraser
Document Page
Liquidity ratios:
Current ratio 0.99 0.82 1.34
Shareholders liquidity ratio 14.27 0.34 37.58
Operational ratios:
Credit period (days) 2 5 5
Collection period (days) 2 2 2
Net assets turnover 0.33 3.94 2.22
Interest cover 2.64 61.70 978.34
Gearing ratio:
Gearing 7.02 296.46 2.66
(Source: Paddypower.com 2018)
The three tables mentioned above allude to the standards of financial performance of the three
gambling organizations in the United Kingdom in the past three years. The juxtaposition among
the financial performers of the three organizations is illustrated graphically below:
Profitability comparison:
Gross profit comparison
EBIT margin comparison:
Document Page
2016 2015 2014
-20
0
20
40
60
80
100
81.74 85.27 88.57
-14.15
-3.6
3.21
76.91 75.92 80.97
William Hill
Ladbrokes
Paddy Power
EBIT margin comparison:
2016 2015 2014
-5
0
5
10
15
20
13.72 14.01
17.41
0.88
15.54
18.42
William Hill
Ladbrokes
Paddy Power
ROE comparison:
Document Page
2016 2015 2014
-50
0
50
100
150
200
250
13.42 15.62 17.78
-14.24
1.12 10.47
-0.13
212.57
37.45
William Hill
Ladbrokes
Paddy Power
The graphs given above describe the profitability performances of the two companies Paddy
Power and William Hill during the timeframe of three years which is quite alike. It must be
pointed out that the profit generated by these companies has lessened progressively from 2014 to
2016. The performance of the company Ladbrokes was dismal during the above mentioned
years. It is true also that the performance of Paddy Power fluctuated during the time frame. The
profit generated by the three organisations clearly demonstrates that levels of cost of the
organizations have increased, which have to be reduced immediately.
Liquidity comparison:
Current ratio comparison:
2016 2015 2014
0
0.2
0.4
0.6
0.8
1
1.2
1.4
0.71000000000
0001
0.52
0.76000000000
0002
0.33000000000
0001
0.65000000000
0002 0.59
0.99 0.82000000000
0001
1.34
William Hill
Ladbrokes
Paddy Power
tabler-icon-diamond-filled.svg

Paraphrase This Document

Need a fresh take? Get an instant paraphrase of this document with our AI Paraphraser
Document Page
Quick ratio comparison:
2016 2015 2014
0
0.2
0.4
0.6
0.8
1
1.2
1.4
0.7100000000
00001
0.52
0.7600000000
00002
0.3300000000
00001
0.6500000000
00002 0.59
0.99 0.8200000000
00001
1.34
William Hill
Ladbrokes
Paddy Power
By collating the liquidity ratios of the three organizations for a period of three years, it can be
concluded that the performance of Paddy Power was definitely better compared to the other two
organizations. In this frame of reference, it must be considered that the performance of the three
organizations were not up to the mark in the context of liquidity. The latest position of the assets
of the three organizations was not up to the mark. The performance of the organisations has
reduced progressively. There was a high amount of fluctuations in the performance of
Ladbrokes. Notwithstanding, the positions of liquidity of the other two organizations were even
wavering. This implies that in the years to come the organizations have to improve the assets that
they have in the short term to better the condition.
Comparing the operational ratios:
Net assets turnover comparison:
Document Page
2016 2015 2014
0
0.5
1
1.5
2
2.5
3
3.5
4
0.8
0.9500000000
00001 0.810.6200000000
00001
1.36 1.25
0.3300000000
00001
3.94
2.22
William Hill
Ladbrokes
Paddy Power
Interest coverage comparison:
2016 2015 2014
-200
0
200
400
600
800
1000
4.51 5.47 5.76
-0.19 -0.08
2.762.64 61.7
978.34
William Hill
Ladbrokes
Paddy Power
Collection period comparison:
Document Page
2016 2015 2014
0
0.5
1
1.5
2
2.5
3
3.5
4
4.5
5
5
1
2
1
2 22 2 2
William Hill
Ladbrokes
Paddy Power
Credit period comparison
2016 2015 2014
0
5
10
15
20
25
30
29
24 2425
15 16
2
5 5
William Hill
Ladbrokes
Paddy Power
The operational ratios of the three organisations if compared can be noted that for the case of the
ratios of the net assets turnover and the ratios of interest coverage, the performance of Paddy
Power was comparatively better than the other two companies. Even though the three companies
performed in a manner of a reduced pattern, it should be noted that the performance of the
organisation Paddy Power reduced by a greater ratio compared to the other two organisations. If
the other two ratios are taken into consideration, it can be concluded that the collection period of
debt is more in William Hill, this implies that the organisation requires a lot of time to recover
the debt. Additionally, the time frame of the collection of debt of the company has progressively
tabler-icon-diamond-filled.svg

Paraphrase This Document

Need a fresh take? Get an instant paraphrase of this document with our AI Paraphraser
Document Page
gone high, it can be noted that the functioning of the organization was not up to the mark. In this
frame of reference, it should even be pointed out that the period of credit given to the
organisation William Hill was even more than the two other organisations. This has helped the
organization in managing the condition. Collating the performance of the organization Ladbrokes
with the organization of William Hill, it can even be noted that in the case of Paddy Power the
balance between the period of credit and the period of collection was less for the organization
Paddy Power.
Gearing comparison:
2016 2015 2014
0
50
100
150
200
250
300
65.86 63.07 73.3
96.75 93.19
140.9
7.02
296.46
2.66
William Hill
Ladbrokes
Paddy Power
The above graph shows that in the case of the three companies were a bit wavering during the
time frame of the three years. In the case of the organisation Paddy Power the fluctuation was
more. In 2014 and 2016, the organization utilised the least amount of debt capital, in 2015
though the debt capital utilized by the organization was 200% more than the other two years. The
level of fluctuation was low in the case of William Hill and Ladbrokes. However, it should be
pointed out that company Ladbrokes utilized greater debt capital than the capital for equity
compared to William Hill. Therefore, when comparing the gearing ratios of the three
organizations for three years, it can be concluded that the position of gearing of William Hill was
much better compared to the other two organisations as the proportion of risk in this organization
was better balanced compared to the other two organizations.
Document Page
Based on the comparison on the whole, it can be said that the performances of all three
organisations was quite alike as the financial performances of the three organisations were in a
reduced pattern and the waverings were more or less alike. However, it surely does not imply
that there were no variations between the performances of the organizations. Based on the
performances of the organizations during the timeframe of 2014 to 2016, the highest and lowest
performing organization had been noted.
1. b Identifying the best performing company
When considering the financial performances of the three companies, it can be concluded that
the Paddy Power was the highest performing company among the three organisations. As Paddy
Power was the best performing organization, the opportunities for investment are considerably
high in this specific company. However, the causes that made this organisation the company for
the highest opportunities are mentioned below:
The total profit and other ratios of profitability of this organisation were much better in
this organization. Even though the ROE of the organization has reduced in the financial
year of 2016, the organization has the ability of bettering the situation as the other ratios
of profitability were at a much better condition. Due to the fact that the position of
profitability of the organisation was much better than the other two companies, it can be
totally expected that this organization has a better chance of having higher percentage of
return in the future ( ). Hence, it can be totally taken as a much better investment choice.
The position of liquidity of the organisation was also much higher than the other two
organisations. The good position of liquidity of the organisation is totally a factor that
secures its stability in the future. If the future of an organisation is secured, it can be
totally expected that in the future the organization will be able to sustain itself properly
and also keep up its standard of performance. (Plantinga 2017).
The operational level of this company was also much better than the other two
organisations. The organisation was able to use the assets it has in a better way, which
shows that the level of efficiency of the organization was much better. As the level of
efficiency of the organisation was much better, it may be expected that in the years to
chevron_up_icon
1 out of 18
circle_padding
hide_on_mobile
zoom_out_icon
[object Object]