Analyzing Financial Health: Hilton Worldwide & Marriott International
VerifiedAdded on 2023/06/11
|11
|2356
|255
Report
AI Summary
This report conducts a financial analysis of Hilton Worldwide Holdings Inc. and Marriott International Inc. using their annual reports from 2014 to 2016. The analysis focuses on efficiency, liquidity, and financial risk through ratios like average debtor collection period, current ratio, gearing ratio, and debt-to-equity ratio. The findings suggest that Marriott International faces higher financial risk due to a weaker capital structure and lower liquidity compared to Hilton Worldwide. While Marriott efficiently manages receivables and payables, its solvency position is less favorable. Hilton Worldwide demonstrates a more stable capital structure and better liquidity, although there is room for improvement in managing creditor payments. The report concludes that both companies exhibit different strengths and weaknesses in their financial management practices.
Running Head: Financial Analysis of Hotel Businesses
Ratio Analysis
Ratio Analysis
Paraphrase This Document
Need a fresh take? Get an instant paraphrase of this document with our AI Paraphraser
Financial Analysis of Hotel Businesses 1
Executive Summary:
This report is about the financial analysis of leading firms of hospitality business industry.
The companies that have been selected for this purpose are: Hilton Worldwide Holdings Inc.
and Marriott International Inc. For the purpose of analysing the financial performance of the
said companies, their annual reports for the years 2016, 2015 and 2014 have been assessed.
The ratio analysis of the financial results of Marriot International has revealed that Marriot
Inc. is facing higher financial risk than its competitor i.e. Hilton Worldwide because of its
poor capital structure. Also the liquidity position of Marriot Inc. is too lower than that of
Hilton Inc. because it is unable to manage considerable balance of its current assets.
Financial Analysis of Hotel Businesses 2
Table of Contents
Executive Summary:..............................................................................................................................1
Introduction...........................................................................................................................................3
Company’s Background:........................................................................................................................3
Ratio analysis:........................................................................................................................................3
Analysis of efficiency ratios:...............................................................................................................4
Average debtor collection period:.................................................................................................4
Average creditors payment period:...............................................................................................4
Analysis of liquidity ratios:.................................................................................................................5
Current Ratio.................................................................................................................................5
Quick Ratio:...................................................................................................................................6
Analysis of financial risks on the companies:.....................................................................................6
Gearing Ratio:................................................................................................................................6
Debt Equity Ratio:..........................................................................................................................7
Conclusion:............................................................................................................................................8
References:............................................................................................................................................9
⊘ This is a preview!⊘
Do you want full access?
Subscribe today to unlock all pages.
Trusted by 1+ million students worldwide
Financial Analysis of Hotel Businesses 3
Introduction
In this report, the financial performances of two leading corporations that belong to hospitality
industry have been analysed. These corporations are Hilton worldwide Inc. and Marriot International.
Both the companies are domiciled in America but operate as the multinational companies worldwide.
These companies are operating through diversified hospitality business and as a part of this hospitality
industry; both the corporations are managing and franchising a wide portfolio of hotels, resorts and
related lodging facilities. Financial accounting suggests the key technique i.e. ratio analysis, to assess
the financial performance of company in various aspects. Ratio analysis is used to measure various
ratios on the basis of which company’s position of profitability, liquidity, solvency etc. is assessed.
Company’s Background:
The head-quarter of Marriot International is in Bethesda, Washington. The company has more than
6500 properties and operates through almost 127 countries across the world. The company’s current
financial position is observed to be sound looking at its effective stock price in the stock market. The
head- quarter of Hilton Worldwide Holdings Inc. is based at Mclean (Virginia) U.S. The company
functions in two segments, i.e. management & franchisee and ownership. The stock price of Hilton
Ltd. is also running good in the stock market which indicates the wellness of its current financial
situation. The company indulges in the business of managing and licensing its brand to the
franchisees.
Ratio analysis:
The ratio analysis of Marriot International and Hilton Worldwide is undertaken for the last three years
i.e. 2014, 2015 and 2016 to identify the trend of its financial outcomes in terms of profitability,
Paraphrase This Document
Need a fresh take? Get an instant paraphrase of this document with our AI Paraphraser
Financial Analysis of Hotel Businesses 4
liquidity, efficiency and solvency position. Both the intra-firm and inter-firm comparative study has
been using the key tool of financial management i.e. ratio analysis.
Analysis of efficiency ratios:
Efficiency ratios of the company measure its ability to utilise its total assets to manage its overall
liabilities. There are various kinds of efficiency ratios such as inventory or asset turnover ratio,
receivables and payables turnover ratio (Tracy, 2012). As a part of this report, mainly two efficiency
ratios have been calculated using the financial information of the companies that is contained in their
financial reports. Those ratios are Average Debtors Collection Period, Average Creditors Payment
Period.
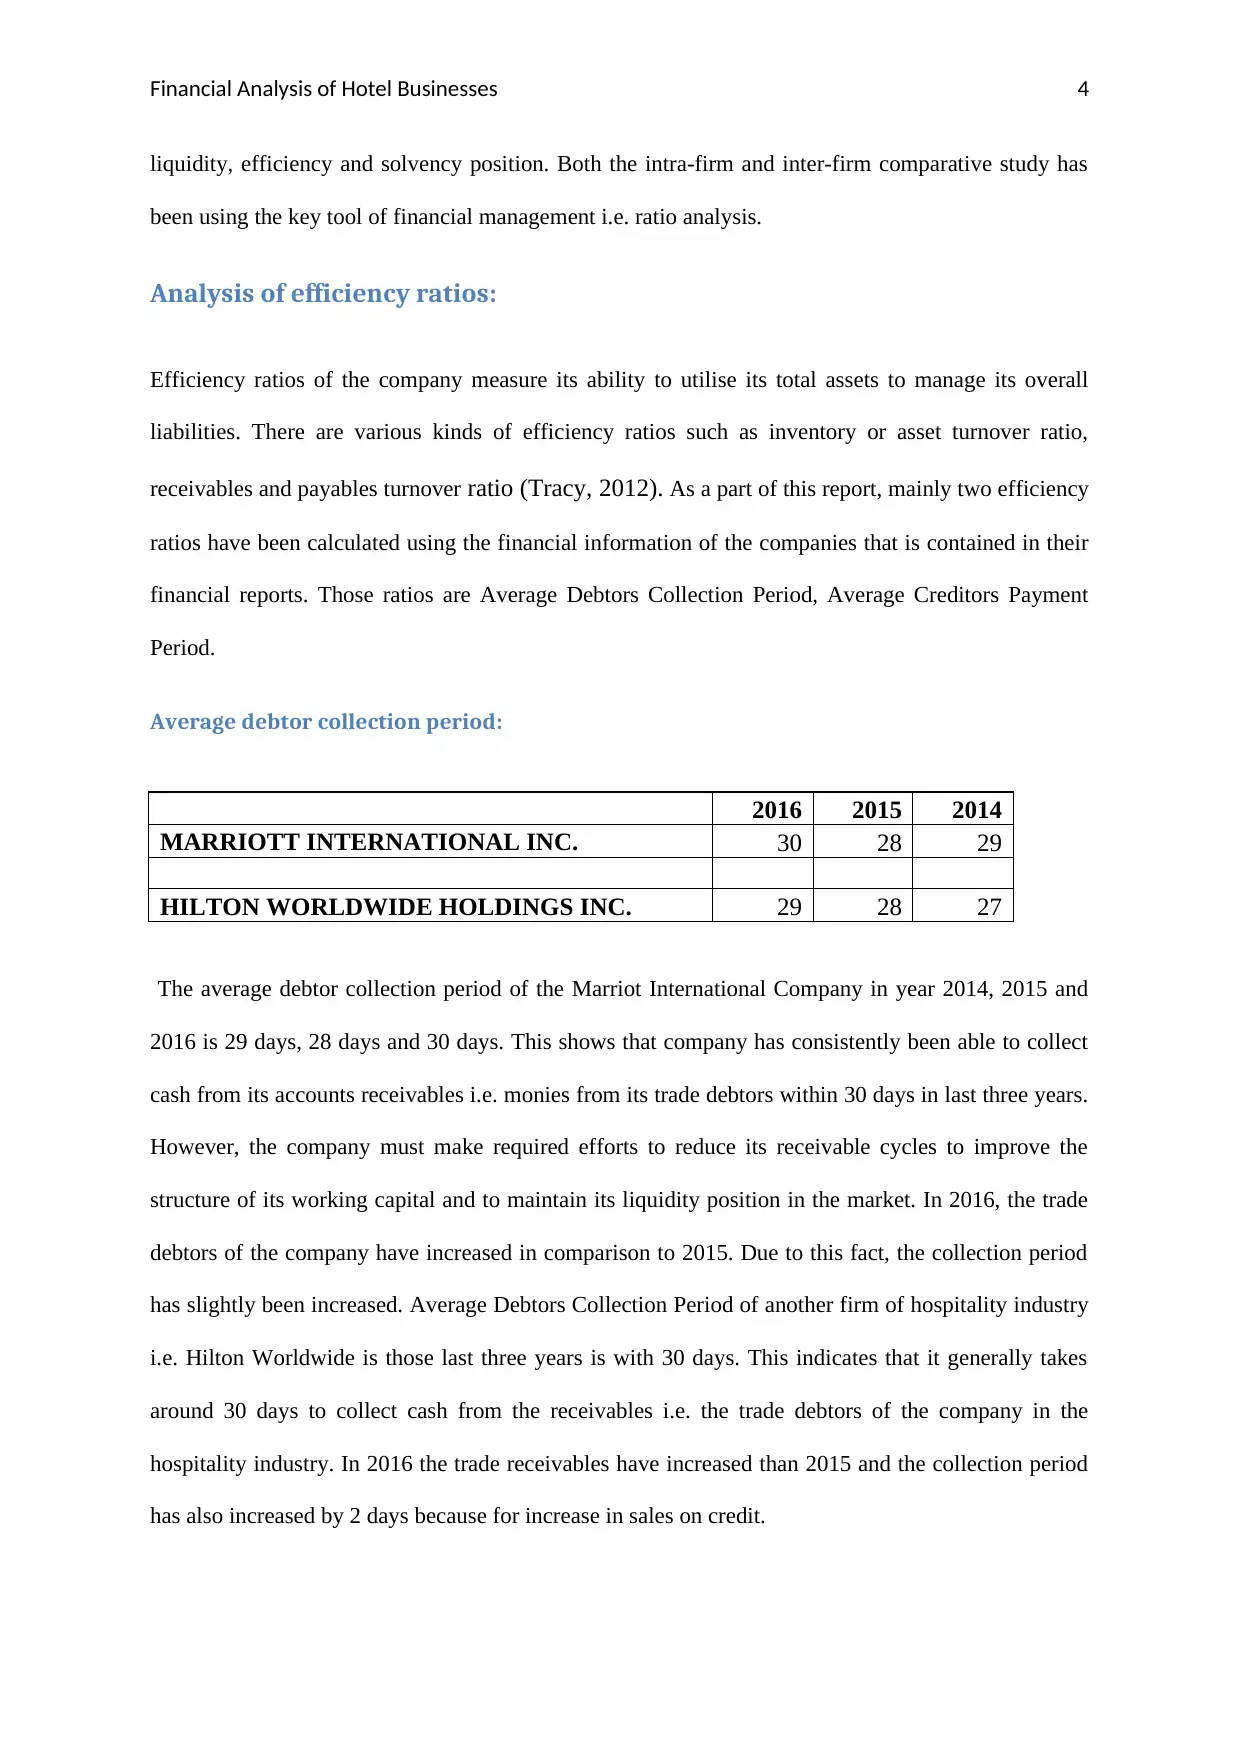
Average debtor collection period:
2016 2015 2014
MARRIOTT INTERNATIONAL INC. 30 28 29
HILTON WORLDWIDE HOLDINGS INC. 29 28 27
The average debtor collection period of the Marriot International Company in year 2014, 2015 and
2016 is 29 days, 28 days and 30 days. This shows that company has consistently been able to collect
cash from its accounts receivables i.e. monies from its trade debtors within 30 days in last three years.
However, the company must make required efforts to reduce its receivable cycles to improve the
structure of its working capital and to maintain its liquidity position in the market. In 2016, the trade
debtors of the company have increased in comparison to 2015. Due to this fact, the collection period
has slightly been increased. Average Debtors Collection Period of another firm of hospitality industry
i.e. Hilton Worldwide is those last three years is with 30 days. This indicates that it generally takes
around 30 days to collect cash from the receivables i.e. the trade debtors of the company in the
hospitality industry. In 2016 the trade receivables have increased than 2015 and the collection period
has also increased by 2 days because for increase in sales on credit.
liquidity, efficiency and solvency position. Both the intra-firm and inter-firm comparative study has
been using the key tool of financial management i.e. ratio analysis.
Analysis of efficiency ratios:
Efficiency ratios of the company measure its ability to utilise its total assets to manage its overall
liabilities. There are various kinds of efficiency ratios such as inventory or asset turnover ratio,
receivables and payables turnover ratio (Tracy, 2012). As a part of this report, mainly two efficiency
ratios have been calculated using the financial information of the companies that is contained in their
financial reports. Those ratios are Average Debtors Collection Period, Average Creditors Payment
Period.
Average debtor collection period:
2016 2015 2014
MARRIOTT INTERNATIONAL INC. 30 28 29
HILTON WORLDWIDE HOLDINGS INC. 29 28 27
The average debtor collection period of the Marriot International Company in year 2014, 2015 and
2016 is 29 days, 28 days and 30 days. This shows that company has consistently been able to collect
cash from its accounts receivables i.e. monies from its trade debtors within 30 days in last three years.
However, the company must make required efforts to reduce its receivable cycles to improve the
structure of its working capital and to maintain its liquidity position in the market. In 2016, the trade
debtors of the company have increased in comparison to 2015. Due to this fact, the collection period
has slightly been increased. Average Debtors Collection Period of another firm of hospitality industry
i.e. Hilton Worldwide is those last three years is with 30 days. This indicates that it generally takes
around 30 days to collect cash from the receivables i.e. the trade debtors of the company in the
hospitality industry. In 2016 the trade receivables have increased than 2015 and the collection period
has also increased by 2 days because for increase in sales on credit.
Financial Analysis of Hotel Businesses 5
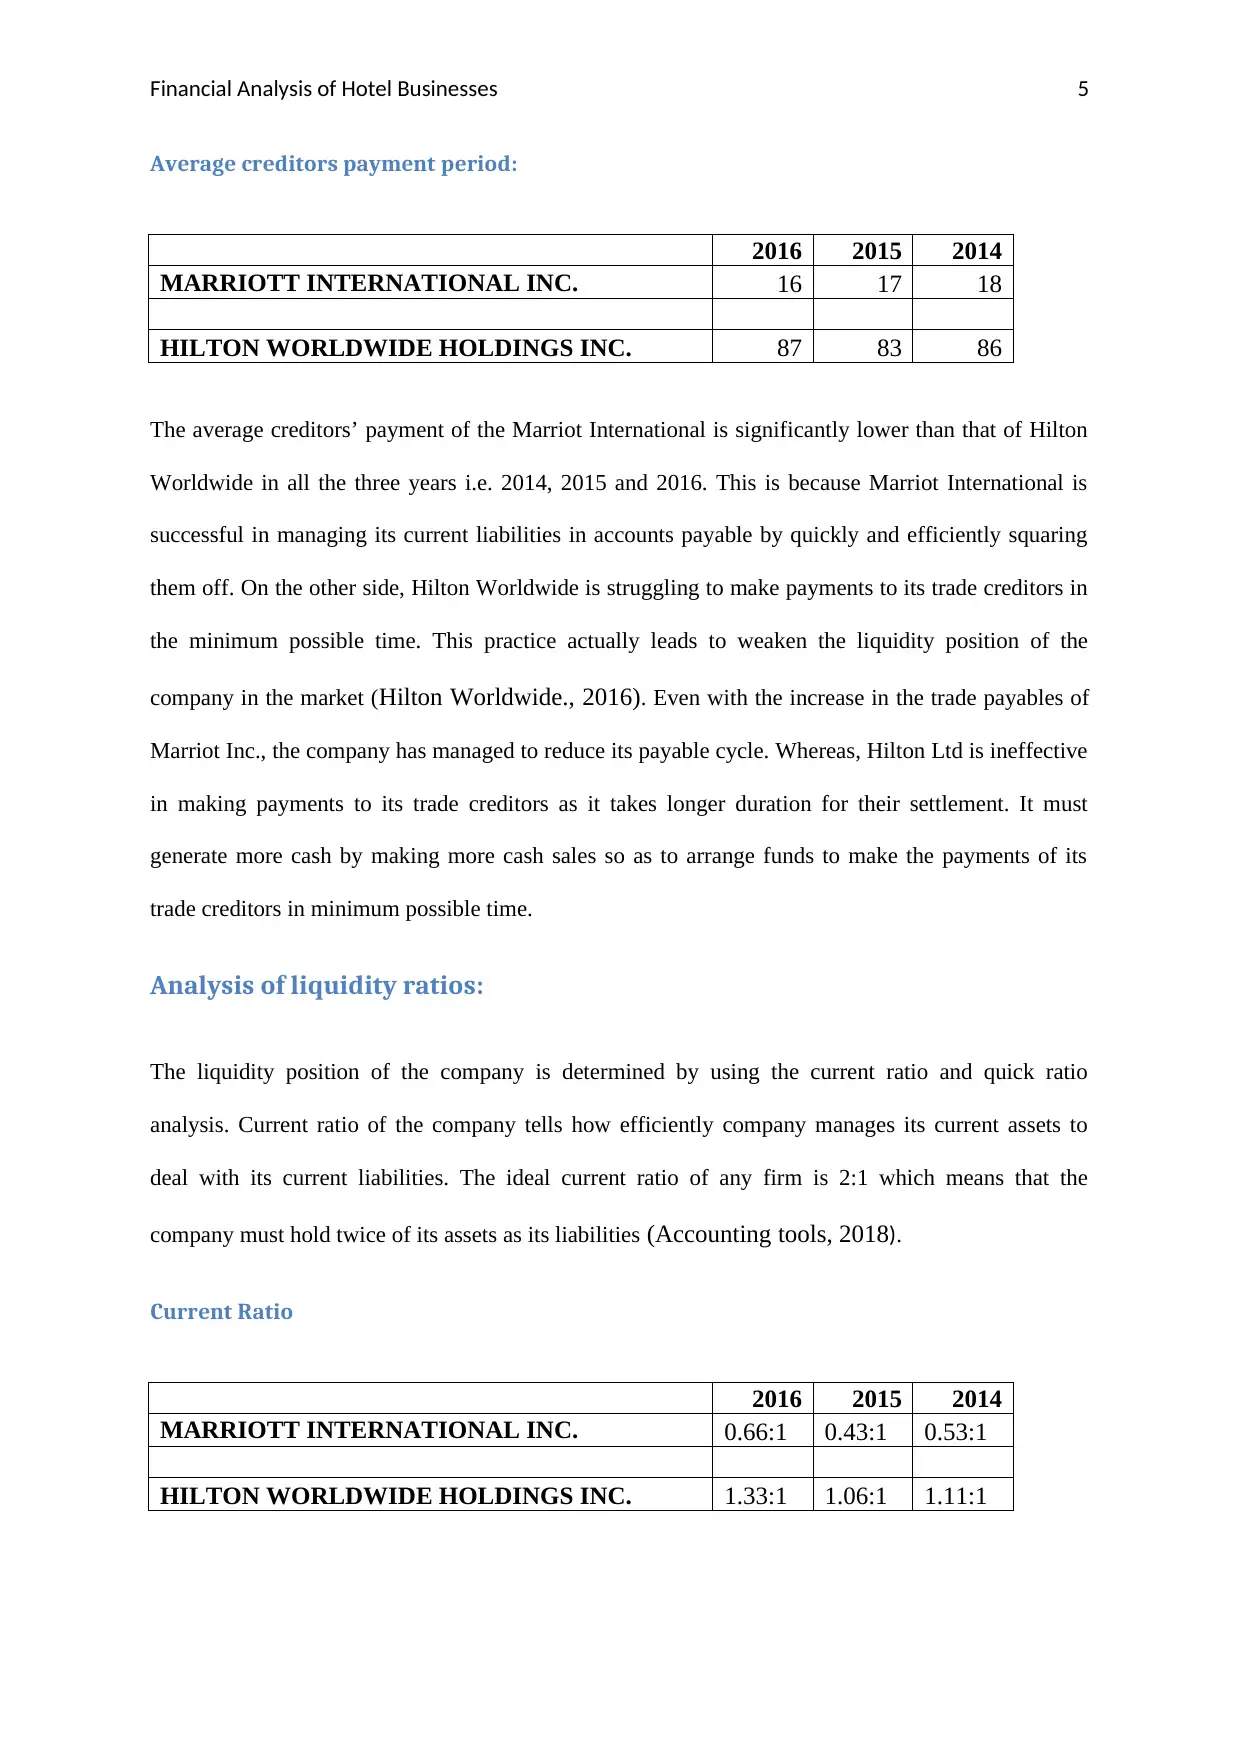
Average creditors payment period:
2016 2015 2014
MARRIOTT INTERNATIONAL INC. 16 17 18
HILTON WORLDWIDE HOLDINGS INC. 87 83 86
The average creditors’ payment of the Marriot International is significantly lower than that of Hilton
Worldwide in all the three years i.e. 2014, 2015 and 2016. This is because Marriot International is
successful in managing its current liabilities in accounts payable by quickly and efficiently squaring
them off. On the other side, Hilton Worldwide is struggling to make payments to its trade creditors in
the minimum possible time. This practice actually leads to weaken the liquidity position of the
company in the market (Hilton Worldwide., 2016). Even with the increase in the trade payables of
Marriot Inc., the company has managed to reduce its payable cycle. Whereas, Hilton Ltd is ineffective
in making payments to its trade creditors as it takes longer duration for their settlement. It must
generate more cash by making more cash sales so as to arrange funds to make the payments of its
trade creditors in minimum possible time.
Analysis of liquidity ratios:
The liquidity position of the company is determined by using the current ratio and quick ratio
analysis. Current ratio of the company tells how efficiently company manages its current assets to
deal with its current liabilities. The ideal current ratio of any firm is 2:1 which means that the
company must hold twice of its assets as its liabilities (Accounting tools, 2018).
Current Ratio
2016 2015 2014
MARRIOTT INTERNATIONAL INC. 0.66:1 0.43:1 0.53:1
HILTON WORLDWIDE HOLDINGS INC. 1.33:1 1.06:1 1.11:1
⊘ This is a preview!⊘
Do you want full access?
Subscribe today to unlock all pages.
Trusted by 1+ million students worldwide
Financial Analysis of Hotel Businesses 6
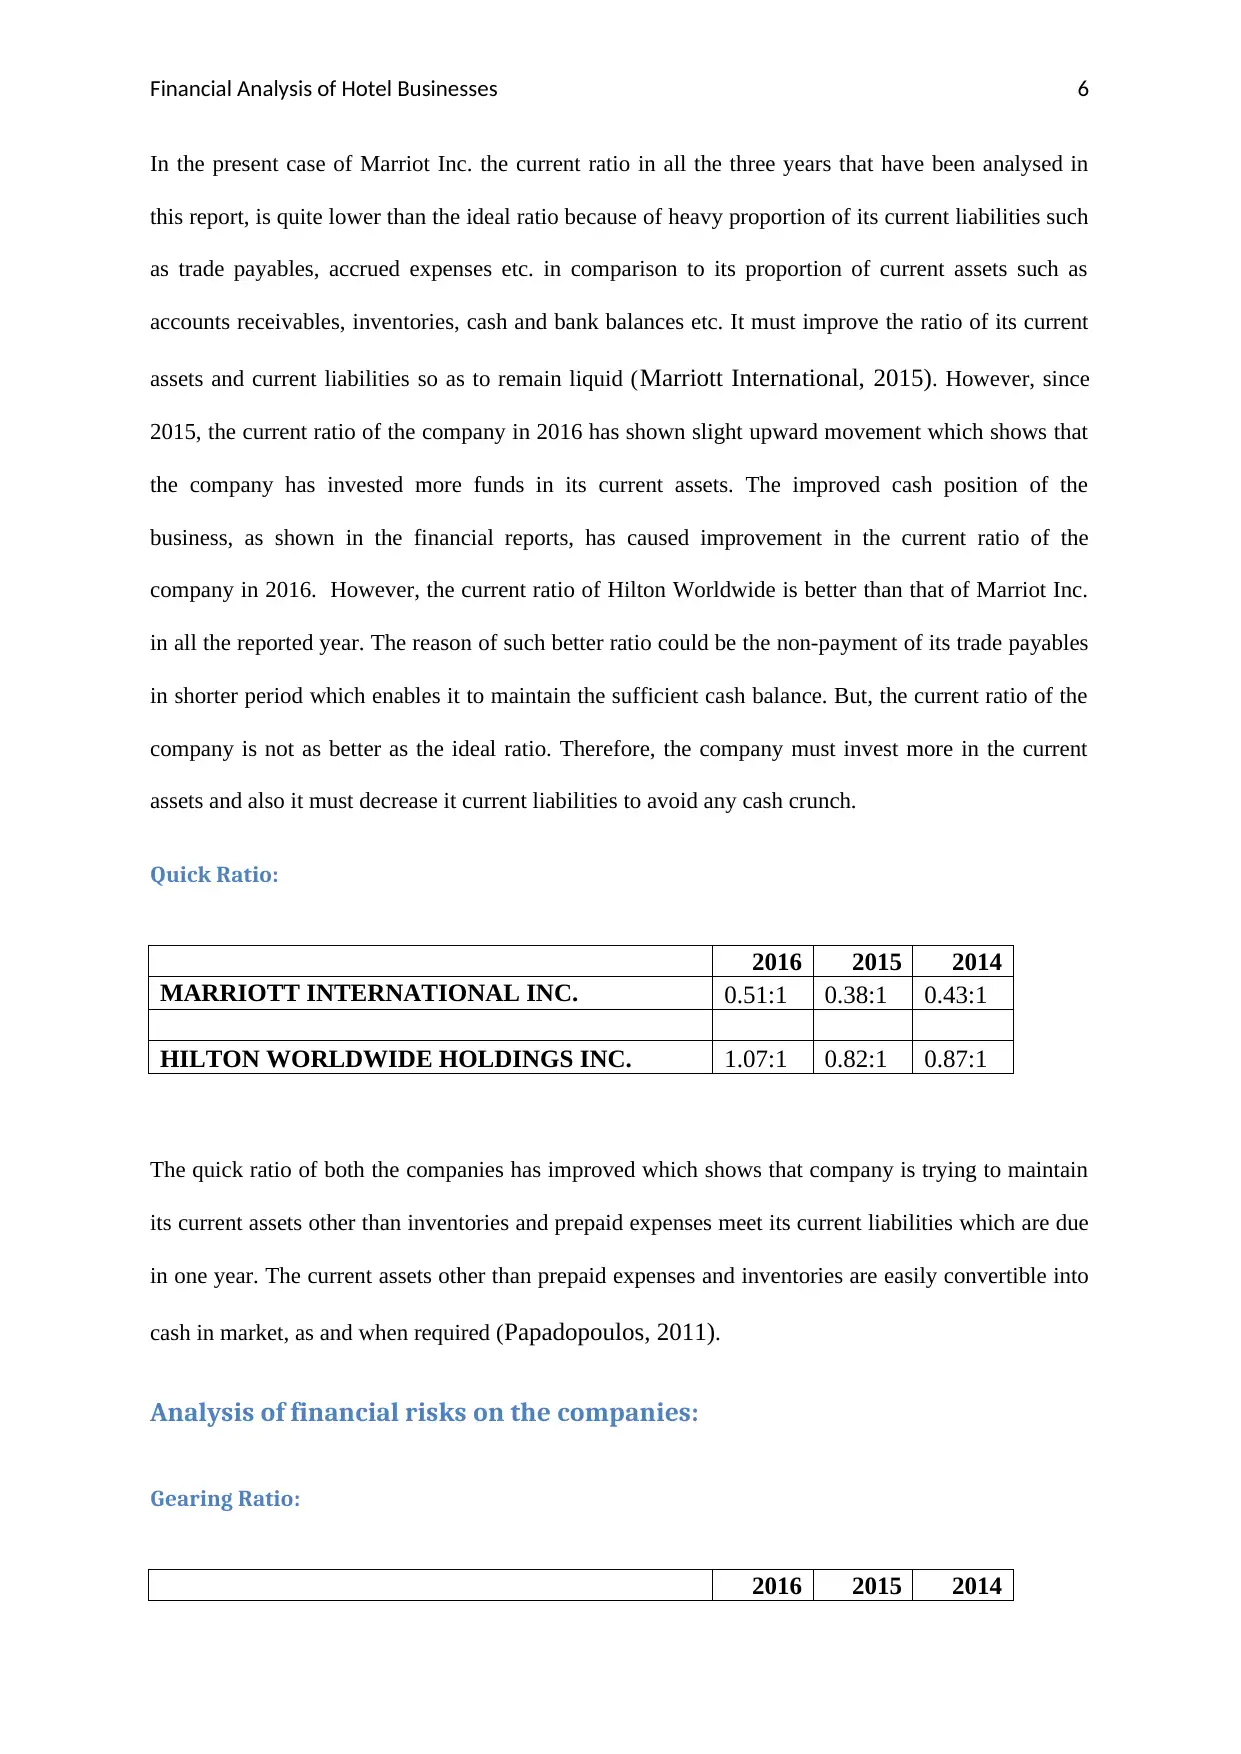
In the present case of Marriot Inc. the current ratio in all the three years that have been analysed in
this report, is quite lower than the ideal ratio because of heavy proportion of its current liabilities such
as trade payables, accrued expenses etc. in comparison to its proportion of current assets such as
accounts receivables, inventories, cash and bank balances etc. It must improve the ratio of its current
assets and current liabilities so as to remain liquid (Marriott International, 2015). However, since
2015, the current ratio of the company in 2016 has shown slight upward movement which shows that
the company has invested more funds in its current assets. The improved cash position of the
business, as shown in the financial reports, has caused improvement in the current ratio of the
company in 2016. However, the current ratio of Hilton Worldwide is better than that of Marriot Inc.
in all the reported year. The reason of such better ratio could be the non-payment of its trade payables
in shorter period which enables it to maintain the sufficient cash balance. But, the current ratio of the
company is not as better as the ideal ratio. Therefore, the company must invest more in the current
assets and also it must decrease it current liabilities to avoid any cash crunch.
Quick Ratio:
2016 2015 2014
MARRIOTT INTERNATIONAL INC. 0.51:1 0.38:1 0.43:1
HILTON WORLDWIDE HOLDINGS INC. 1.07:1 0.82:1 0.87:1
The quick ratio of both the companies has improved which shows that company is trying to maintain
its current assets other than inventories and prepaid expenses meet its current liabilities which are due
in one year. The current assets other than prepaid expenses and inventories are easily convertible into
cash in market, as and when required (Papadopoulos, 2011).
Analysis of financial risks on the companies:
Gearing Ratio:
2016 2015 2014
Paraphrase This Document
Need a fresh take? Get an instant paraphrase of this document with our AI Paraphraser
Financial Analysis of Hotel Businesses 7
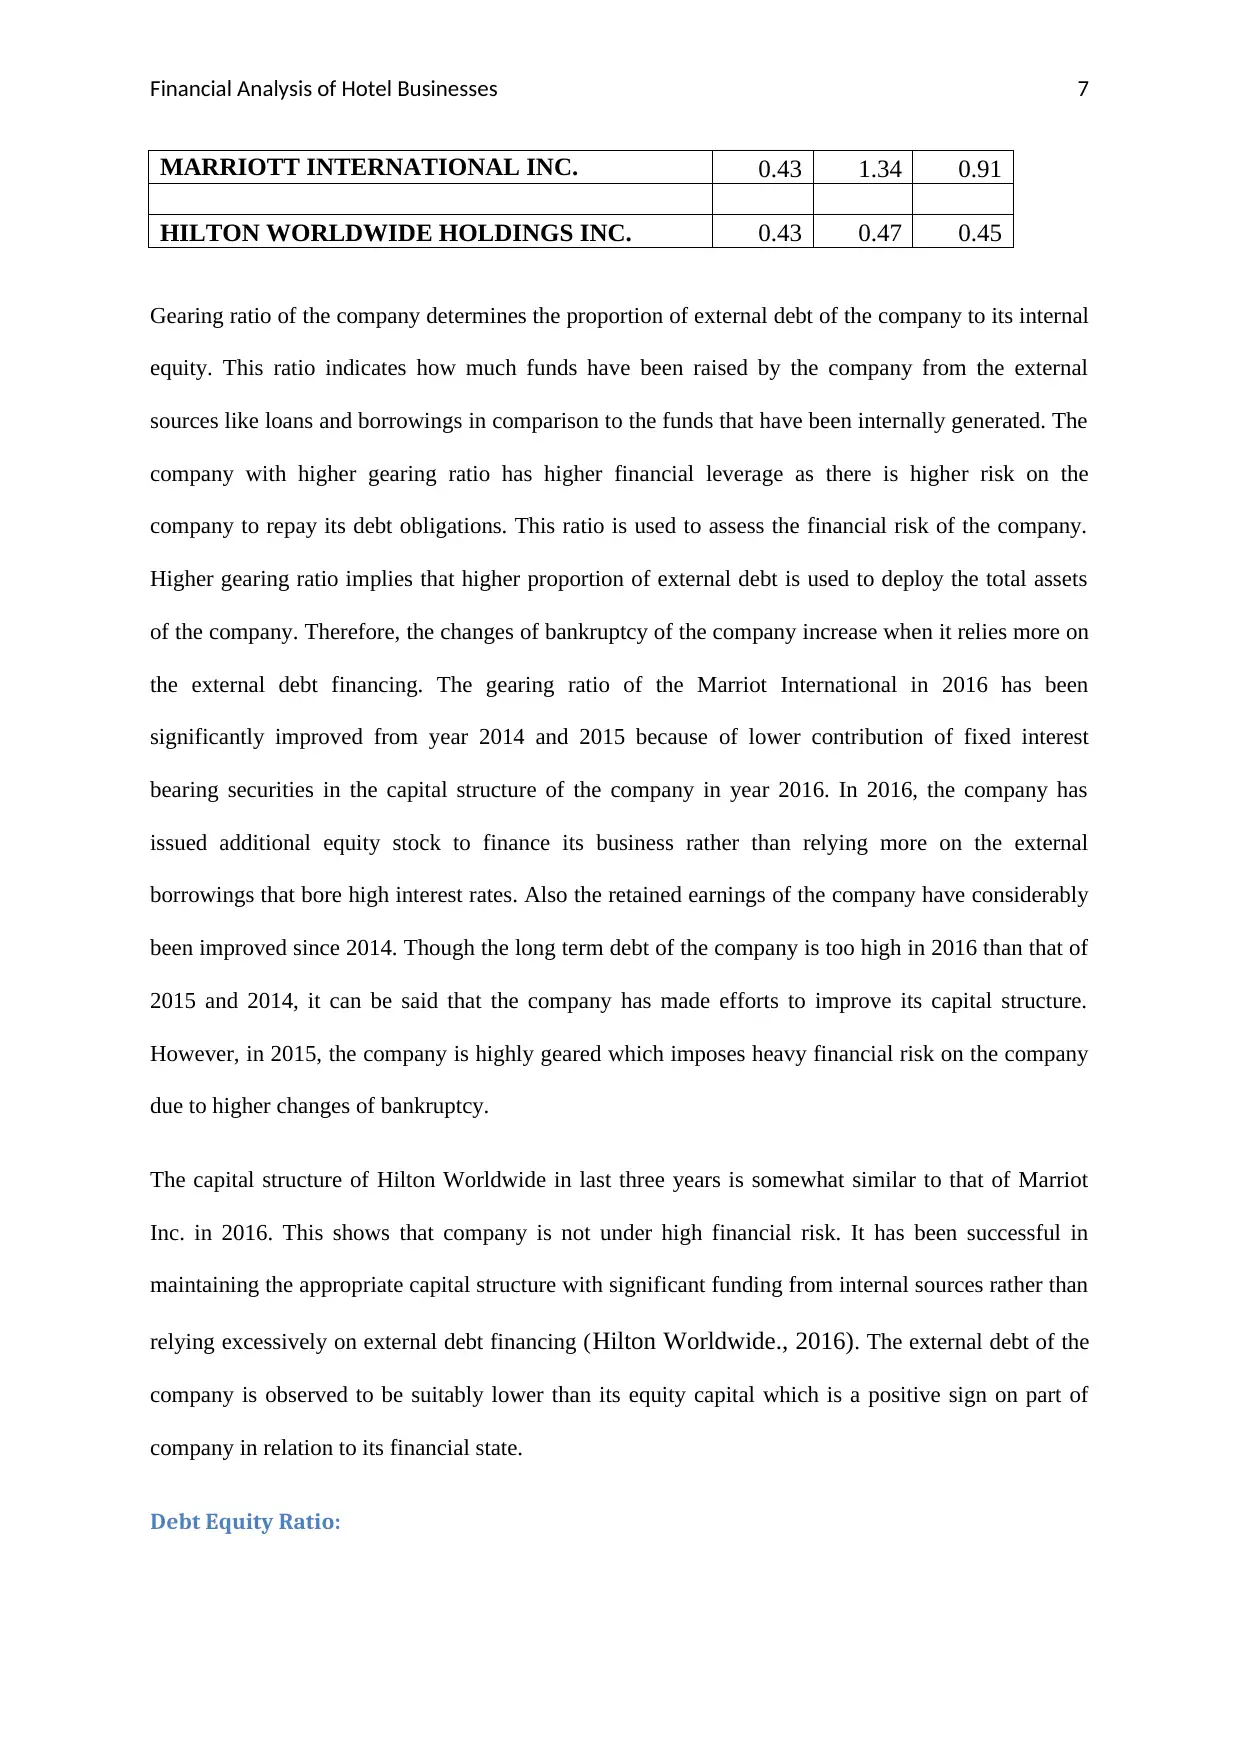
MARRIOTT INTERNATIONAL INC. 0.43 1.34 0.91
HILTON WORLDWIDE HOLDINGS INC. 0.43 0.47 0.45
Gearing ratio of the company determines the proportion of external debt of the company to its internal
equity. This ratio indicates how much funds have been raised by the company from the external
sources like loans and borrowings in comparison to the funds that have been internally generated. The
company with higher gearing ratio has higher financial leverage as there is higher risk on the
company to repay its debt obligations. This ratio is used to assess the financial risk of the company.
Higher gearing ratio implies that higher proportion of external debt is used to deploy the total assets
of the company. Therefore, the changes of bankruptcy of the company increase when it relies more on
the external debt financing. The gearing ratio of the Marriot International in 2016 has been
significantly improved from year 2014 and 2015 because of lower contribution of fixed interest
bearing securities in the capital structure of the company in year 2016. In 2016, the company has
issued additional equity stock to finance its business rather than relying more on the external
borrowings that bore high interest rates. Also the retained earnings of the company have considerably
been improved since 2014. Though the long term debt of the company is too high in 2016 than that of
2015 and 2014, it can be said that the company has made efforts to improve its capital structure.
However, in 2015, the company is highly geared which imposes heavy financial risk on the company
due to higher changes of bankruptcy.
The capital structure of Hilton Worldwide in last three years is somewhat similar to that of Marriot
Inc. in 2016. This shows that company is not under high financial risk. It has been successful in
maintaining the appropriate capital structure with significant funding from internal sources rather than
relying excessively on external debt financing (Hilton Worldwide., 2016). The external debt of the
company is observed to be suitably lower than its equity capital which is a positive sign on part of
company in relation to its financial state.
Debt Equity Ratio:
Financial Analysis of Hotel Businesses 8
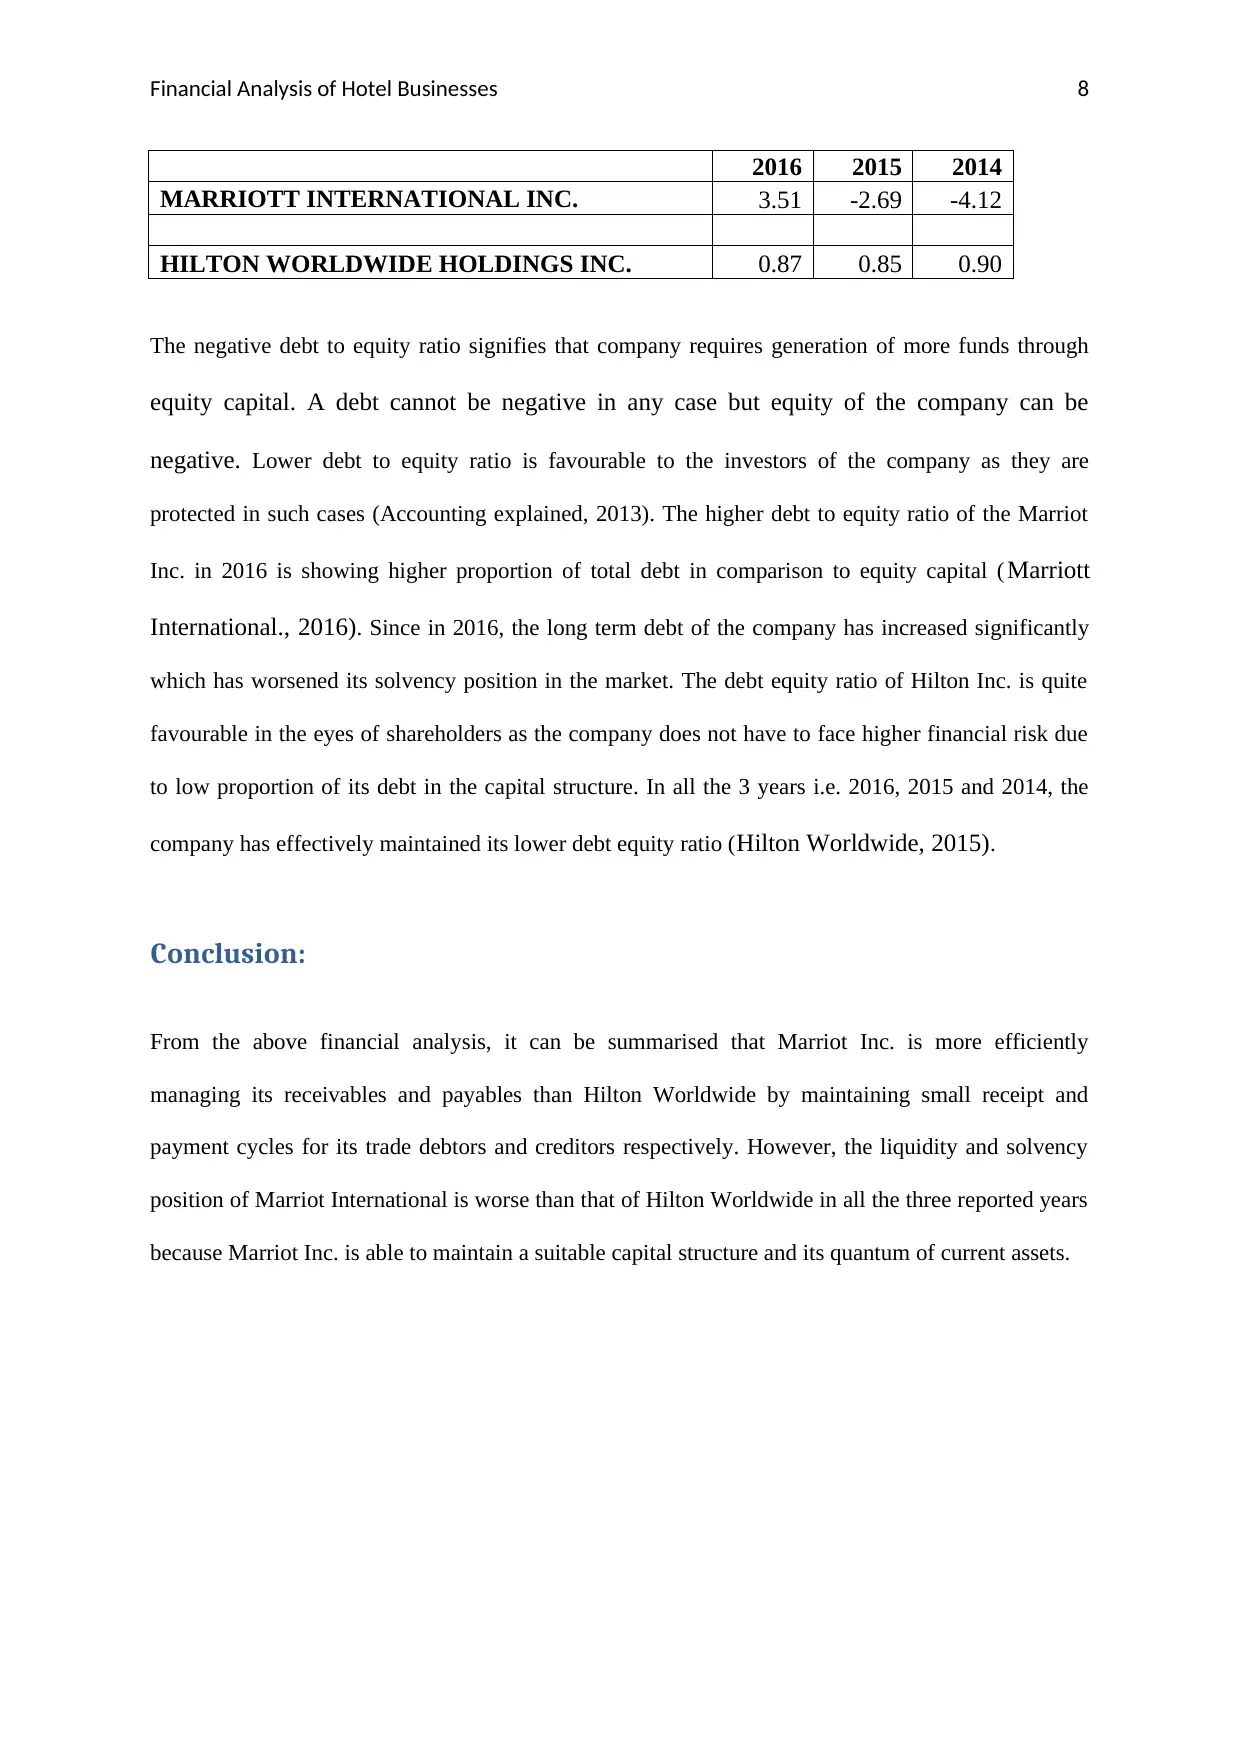
2016 2015 2014
MARRIOTT INTERNATIONAL INC. 3.51 -2.69 -4.12
HILTON WORLDWIDE HOLDINGS INC. 0.87 0.85 0.90
The negative debt to equity ratio signifies that company requires generation of more funds through
equity capital. A debt cannot be negative in any case but equity of the company can be
negative. Lower debt to equity ratio is favourable to the investors of the company as they are
protected in such cases (Accounting explained, 2013). The higher debt to equity ratio of the Marriot
Inc. in 2016 is showing higher proportion of total debt in comparison to equity capital ( Marriott
International., 2016). Since in 2016, the long term debt of the company has increased significantly
which has worsened its solvency position in the market. The debt equity ratio of Hilton Inc. is quite
favourable in the eyes of shareholders as the company does not have to face higher financial risk due
to low proportion of its debt in the capital structure. In all the 3 years i.e. 2016, 2015 and 2014, the
company has effectively maintained its lower debt equity ratio (Hilton Worldwide, 2015).
Conclusion:
From the above financial analysis, it can be summarised that Marriot Inc. is more efficiently
managing its receivables and payables than Hilton Worldwide by maintaining small receipt and
payment cycles for its trade debtors and creditors respectively. However, the liquidity and solvency
position of Marriot International is worse than that of Hilton Worldwide in all the three reported years
because Marriot Inc. is able to maintain a suitable capital structure and its quantum of current assets.
⊘ This is a preview!⊘
Do you want full access?
Subscribe today to unlock all pages.
Trusted by 1+ million students worldwide
Financial Analysis of Hotel Businesses 9
References:
Accounting explained. 2013. Financial Ratio Analysis. Retrieved from
https://accountingexplained.com/financial/ratios/ accessed on 11 June 2018
Accounting tools. 2018. Ratio Analysis. Retrieved from
https://www.accountingtools.com/articles/ratio-analysis.html accessed on 11 June 2018
Hilton Worldwide. 2015. Annual Report. Retrieved from
http://ir.hiltonworldwide.com/~/media/Files/H/Hilton-Worldwide-IR-V2/quarterly-results/
2015/Q4-2015-Earnings-Release.pdf
Hilton Worldwide. 2016. Annual Report. Retrieved from
http://ir.hilton.com/~/media/Files/H/Hilton-Worldwide-IR-V3/annual-report/2016-annual-
report.pdf
Marriott International. 2014. Annual Report. Retrieved from
http://investor.shareholder.com/mar/marriottar14/pdfs/Marriott_2014_Annual_Report.pdf
Marriott International. 2015. Annual Report. Retrieved from
http://files.shareholder.com/downloads/MAR/1376213204x0x884644/934434D3-0551-
4E9D-94EF-687390A5AE6F/2015_AR.pdf
Marriott International. 2016. Annual Report. Retrieved from
https://investor.shareholder.com/mar/marriottAR16/pdfs/Marriott_2016_Annual_Report.pdf
Paraphrase This Document
Need a fresh take? Get an instant paraphrase of this document with our AI Paraphraser
Financial Analysis of Hotel Businesses
10
Papadopoulos, P. 2011. Investment Report - Fundamental Analysis/ Ratio Analysis. GRIN
Verlag.
Tracy, A. 2012. Ratio Analysis Fundamentals: How 17 Financial Ratios Can Allow You to
Analyse Any Business on the Planet. RatioAnalysis.net.
10
Papadopoulos, P. 2011. Investment Report - Fundamental Analysis/ Ratio Analysis. GRIN
Verlag.
Tracy, A. 2012. Ratio Analysis Fundamentals: How 17 Financial Ratios Can Allow You to
Analyse Any Business on the Planet. RatioAnalysis.net.
1 out of 11
Related Documents


Your All-in-One AI-Powered Toolkit for Academic Success.
+13062052269
info@desklib.com
Available 24*7 on WhatsApp / Email
![[object Object]](/_next/static/media/star-bottom.7253800d.svg)
Unlock your academic potential
Copyright © 2020–2026 A2Z Services. All Rights Reserved. Developed and managed by ZUCOL.