Financial Analysis and Budgeting for Tourism and Hospitality Control
VerifiedAdded on 2023/04/10
|10
|2274
|390
Report
AI Summary
This report provides a comprehensive financial analysis of a tourism and hospitality company, covering key aspects from both a manager's and shareholder's perspective. Task 1 delves into ratio analysis, including profitability, efficiency, and stability metrics, alongside DuPont decomposition to assess Return on Assets (ROA). The analysis explores the company's financial performance, highlighting improvements in ROA, operating profit margin, and total asset turnover. Task 2 focuses on operational budgeting, explaining its purpose and application in the tourism and hospitality industry. It also includes projected cash flow statements, detailing cash receipts and disbursements, and concludes with an analysis of the company's liquidity balance. The report utilizes financial data to evaluate the company's performance and suggest strategies for financial management.
Running head: TOURISM AND HOSPITALIT CONTROL
Tourism and hospitality control
Name of the student
Name of the university
Student ID
Author note
Tourism and hospitality control
Name of the student
Name of the university
Student ID
Author note
Paraphrase This Document
Need a fresh take? Get an instant paraphrase of this document with our AI Paraphraser
1TOURISM AND HOSPITALIT CONTROL
Table of Contents
Introduction..........................................................................................................................................2
Task 1...................................................................................................................................................2
From the managers perspective........................................................................................................2
Shareholder’s perspective.................................................................................................................3
Task 2...................................................................................................................................................4
1. Purpose of operational budget...................................................................................................4
2. Projected cash flow...................................................................................................................5
3. Liquidity balance.......................................................................................................................7
Reference..............................................................................................................................................8
2TOURISM AND HOSPITALIT CONTROL
Introduction
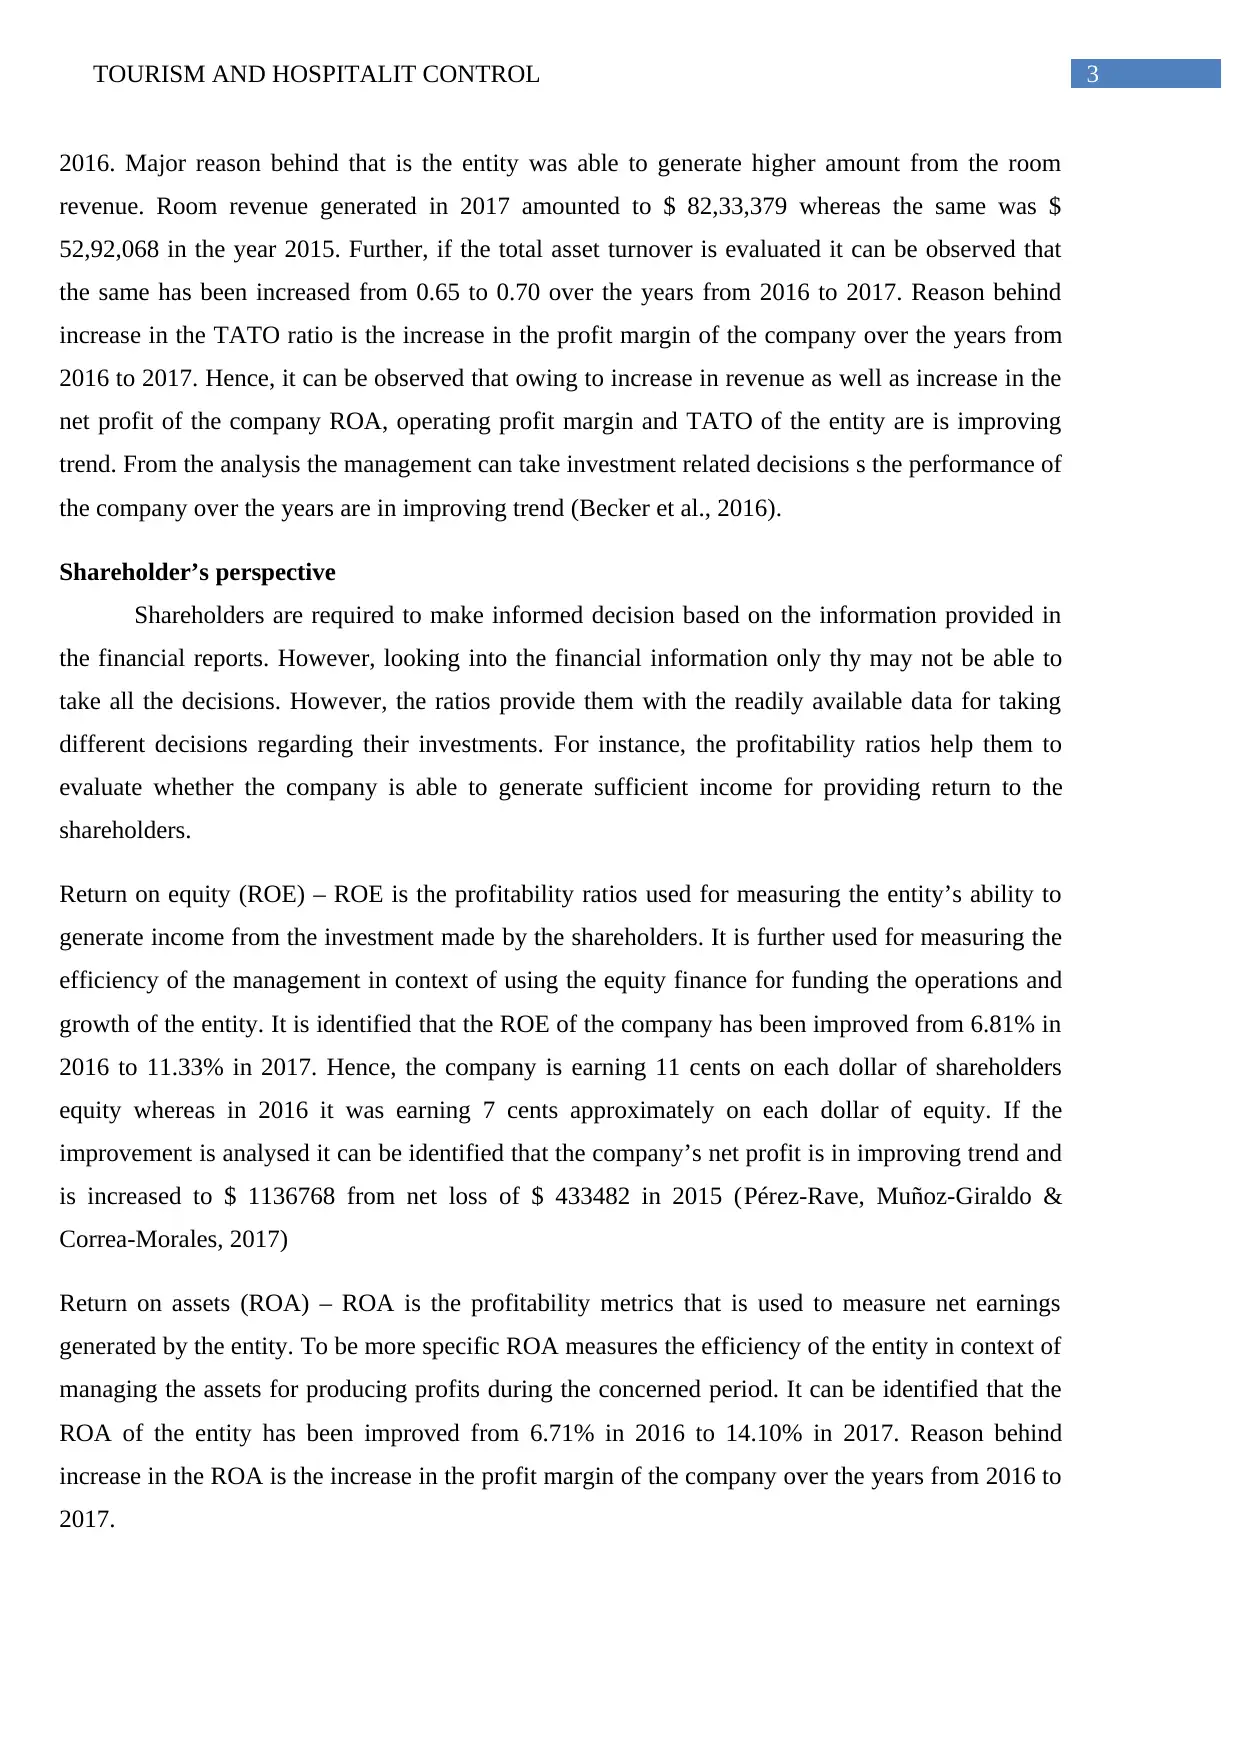
The proposed report will cover 2 parts that is task 1 and task 2. Under task 1 it will focus on
the financial performance s of the company based on the ratio computed under the previous task.
Various aspects that will be covered under this part are the profitability aspect, efficiency aspect,
short term as well as long term stability aspects. Under task 2 the report will cover the budget
related aspects like purpose of budget, projection of budget and the company’s liability and will
suggest the possible methods for managing short term liquidity surplus or deficit (Polak &
Boughton, 2016).
Task 1
Analysis of ratios
From the managers perspective
Ratio analysis is the crucial tool for evaluating the financial performance of the entity and it helps in
–
Evaluating financial statement – ratios analysis is the useful technique used for evaluating
the company’s financial performance over the period under concern. It helps in
understanding the financial position. Managers use it to project the future performance
based on which it takes various important decisions like borrowing and investing.
Comparison of performance – managers shall know the exact position of the company as
compared to its peers. Ratio analysis helps to compare the performance of the company
with its peers and comparing with the previous period’s performances (Mohammadi &
Mahmudi, 2015).
Du-Pont decomposition – DuPont analysis is the framework used for analysing the fundamental
performance of the company and is considered as the useful technique for decomposing the various
drivers of ROA (return on assets). Decomposition of ROA allows the investors to concentrate on
key metrics of the financial performance on individual basis for recognising the weaknesses and
strengths. Analysing the Du-Pont decomposition of the entity it can be identified that the ROA of
the entity has been improved from 6.71% in 2016 to 14.10% in 2017. If the improvement is
analysed it can be identified that the company’s net profit is in improving trend and is increased to $
1136768 from net loss of $ 433482 in 2015. In the same way it can be identified that the operating
profit margin of the company has been increased to 20.23% in 2017 as compared to 10.38% in
Introduction
The proposed report will cover 2 parts that is task 1 and task 2. Under task 1 it will focus on
the financial performance s of the company based on the ratio computed under the previous task.
Various aspects that will be covered under this part are the profitability aspect, efficiency aspect,
short term as well as long term stability aspects. Under task 2 the report will cover the budget
related aspects like purpose of budget, projection of budget and the company’s liability and will
suggest the possible methods for managing short term liquidity surplus or deficit (Polak &
Boughton, 2016).
Task 1
Analysis of ratios
From the managers perspective
Ratio analysis is the crucial tool for evaluating the financial performance of the entity and it helps in
–
Evaluating financial statement – ratios analysis is the useful technique used for evaluating
the company’s financial performance over the period under concern. It helps in
understanding the financial position. Managers use it to project the future performance
based on which it takes various important decisions like borrowing and investing.
Comparison of performance – managers shall know the exact position of the company as
compared to its peers. Ratio analysis helps to compare the performance of the company
with its peers and comparing with the previous period’s performances (Mohammadi &
Mahmudi, 2015).
Du-Pont decomposition – DuPont analysis is the framework used for analysing the fundamental
performance of the company and is considered as the useful technique for decomposing the various
drivers of ROA (return on assets). Decomposition of ROA allows the investors to concentrate on
key metrics of the financial performance on individual basis for recognising the weaknesses and
strengths. Analysing the Du-Pont decomposition of the entity it can be identified that the ROA of
the entity has been improved from 6.71% in 2016 to 14.10% in 2017. If the improvement is
analysed it can be identified that the company’s net profit is in improving trend and is increased to $
1136768 from net loss of $ 433482 in 2015. In the same way it can be identified that the operating
profit margin of the company has been increased to 20.23% in 2017 as compared to 10.38% in
⊘ This is a preview!⊘
Do you want full access?
Subscribe today to unlock all pages.
Trusted by 1+ million students worldwide
3TOURISM AND HOSPITALIT CONTROL
2016. Major reason behind that is the entity was able to generate higher amount from the room
revenue. Room revenue generated in 2017 amounted to $ 82,33,379 whereas the same was $
52,92,068 in the year 2015. Further, if the total asset turnover is evaluated it can be observed that
the same has been increased from 0.65 to 0.70 over the years from 2016 to 2017. Reason behind
increase in the TATO ratio is the increase in the profit margin of the company over the years from
2016 to 2017. Hence, it can be observed that owing to increase in revenue as well as increase in the
net profit of the company ROA, operating profit margin and TATO of the entity are is improving
trend. From the analysis the management can take investment related decisions s the performance of
the company over the years are in improving trend (Becker et al., 2016).
Shareholder’s perspective
Shareholders are required to make informed decision based on the information provided in
the financial reports. However, looking into the financial information only thy may not be able to
take all the decisions. However, the ratios provide them with the readily available data for taking
different decisions regarding their investments. For instance, the profitability ratios help them to
evaluate whether the company is able to generate sufficient income for providing return to the
shareholders.
Return on equity (ROE) – ROE is the profitability ratios used for measuring the entity’s ability to
generate income from the investment made by the shareholders. It is further used for measuring the
efficiency of the management in context of using the equity finance for funding the operations and
growth of the entity. It is identified that the ROE of the company has been improved from 6.81% in
2016 to 11.33% in 2017. Hence, the company is earning 11 cents on each dollar of shareholders
equity whereas in 2016 it was earning 7 cents approximately on each dollar of equity. If the
improvement is analysed it can be identified that the company’s net profit is in improving trend and
is increased to $ 1136768 from net loss of $ 433482 in 2015 (Pérez-Rave, Muñoz-Giraldo &
Correa-Morales, 2017)
Return on assets (ROA) – ROA is the profitability metrics that is used to measure net earnings
generated by the entity. To be more specific ROA measures the efficiency of the entity in context of
managing the assets for producing profits during the concerned period. It can be identified that the
ROA of the entity has been improved from 6.71% in 2016 to 14.10% in 2017. Reason behind
increase in the ROA is the increase in the profit margin of the company over the years from 2016 to
2017.
Paraphrase This Document
Need a fresh take? Get an instant paraphrase of this document with our AI Paraphraser
4TOURISM AND HOSPITALIT CONTROL
Equity multiplier – it is used for measuring the company’s financial leverage that is the proportion
of capital funded through borrowing and proportion funded through equity. The company’s equity
multiplier ratio of 1.16 and 1.17 in 2016 and 2017 is signifying that the company has significantly
low amount of debt as compared to equity. Hence, the company follows conservative policy is
taking debt.
Profitability ratio – profitability ratio is used for measuring the profit earning capability of the
company. Considering all the profitability ratios of the entity it can be identified that all ratios are in
improving trend and the major reason is the increase in revenue that led to increase in all the
profitability metrics.
Turnover ratio – it measures the ability of the company to in converting its balance sheet items into
income statement items. Account receivable settlement period had been reduced from 40.51 days to
39.95 days whereas the average number of inventory days increased from 9.99 days to 10.39 days
(Sponem & Lambert, 2016).
Short term financial stability – looking into the short term stability of the company it can be
identified that both current ratio as well as the acid test ratio of the entity has been improved over
the years from 2016 to 2017. It is signifying that the company is financially stable.
Long-term financial stability – looking into the long term stability of the company it can be
identified that the company has significantly low amount of debt as compared to equity. Further, the
operating profits are sufficient to cover the interest payment as high as 39.70 times. It is signifying
that the company is financially stable (Foster, 2017).
Task 2
1. Purpose of operational budget
Operational budget is the plan or the expenses those are required for maintaining the
business function for any entity. Generally the operational budget includes projected labour and
material cost required for running the business and for manufacturing the products or for providing
services. Operational budget is used for –
Managing current expenses – it can be used by the management for focussing on the current
expenses through comparing the same through the actual result. It further helps is
identifying the areas with more expenses and the profitable areas.
5TOURISM AND HOSPITALIT CONTROL
Projecting the future expenses – it helps in projecting future expenses based on the trend of
current expenses. Based on the past projection like over estimation or under estimation it
helps in making proper adjustments while projecting the expenses for future period (Dudin
et al., 2015).
Use of budget in tourism and hospitality industry
Budgets are used in tourism and hospitality industry to measure the performance and setting
up the financial target. It is not only used for planning for the future but also for setting up the target
and improving the performance of individual department or sector. In tourism and hospitality
industry budget can be used for various key factors like projecting the revenues, expenses and costs
based on the past performances. It can also be used for identifying the less productive or
unproductive area of business and taking decisions regarding whether to close down the sector or
apply any other technique to improve the same. Moreover, it helps is finalising the information with
the department manager before incorporating the same into the report (Vargas-Hernández, Cárdenaz
& Vargas, 2019)
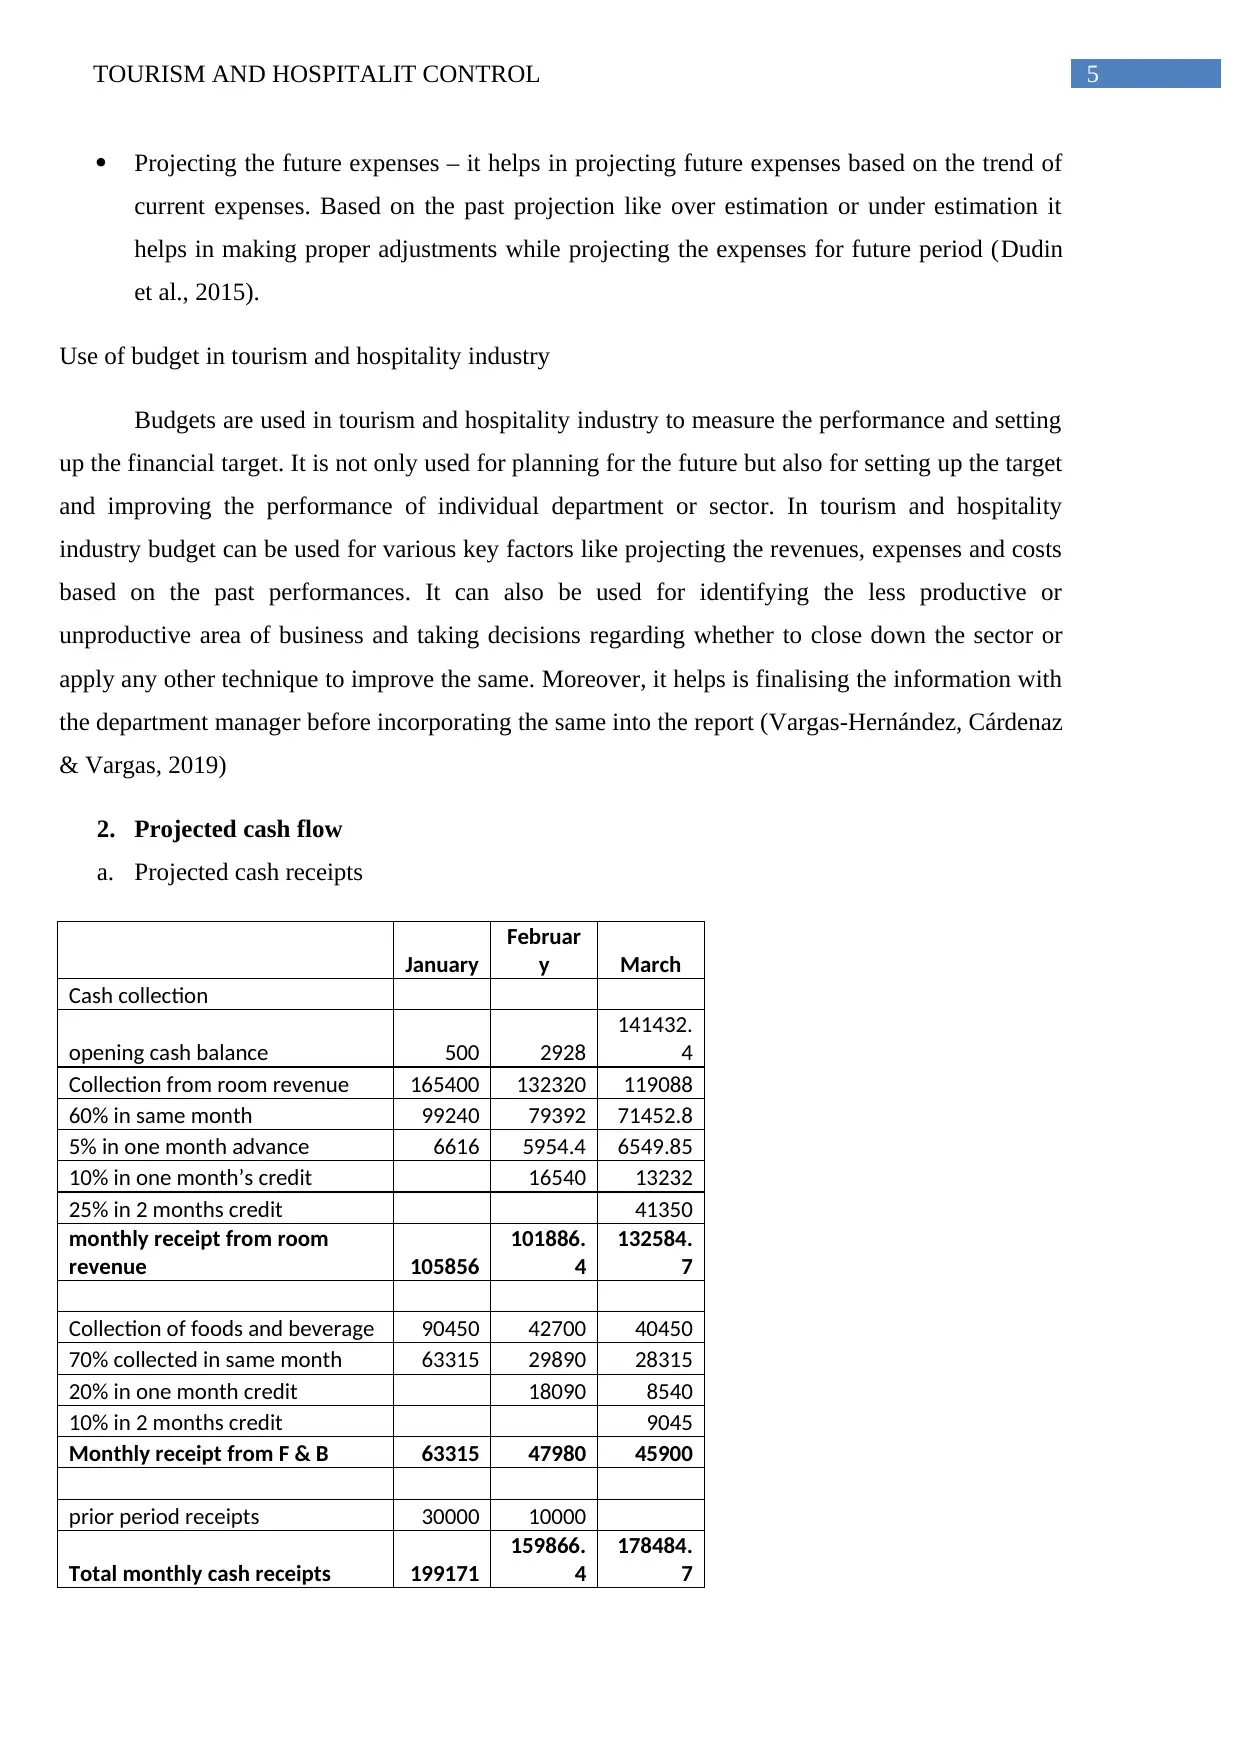
2. Projected cash flow
a. Projected cash receipts
January
Februar
y March
Cash collection
opening cash balance 500 2928
141432.
4
Collection from room revenue 165400 132320 119088
60% in same month 99240 79392 71452.8
5% in one month advance 6616 5954.4 6549.85
10% in one month’s credit 16540 13232
25% in 2 months credit 41350
monthly receipt from room
revenue 105856
101886.
4
132584.
7
Collection of foods and beverage 90450 42700 40450
70% collected in same month 63315 29890 28315
20% in one month credit 18090 8540
10% in 2 months credit 9045
Monthly receipt from F & B 63315 47980 45900
prior period receipts 30000 10000
Total monthly cash receipts 199171
159866.
4
178484.
7
Projecting the future expenses – it helps in projecting future expenses based on the trend of
current expenses. Based on the past projection like over estimation or under estimation it
helps in making proper adjustments while projecting the expenses for future period (Dudin
et al., 2015).
Use of budget in tourism and hospitality industry
Budgets are used in tourism and hospitality industry to measure the performance and setting
up the financial target. It is not only used for planning for the future but also for setting up the target
and improving the performance of individual department or sector. In tourism and hospitality
industry budget can be used for various key factors like projecting the revenues, expenses and costs
based on the past performances. It can also be used for identifying the less productive or
unproductive area of business and taking decisions regarding whether to close down the sector or
apply any other technique to improve the same. Moreover, it helps is finalising the information with
the department manager before incorporating the same into the report (Vargas-Hernández, Cárdenaz
& Vargas, 2019)
2. Projected cash flow
a. Projected cash receipts
January
Februar
y March
Cash collection
opening cash balance 500 2928
141432.
4
Collection from room revenue 165400 132320 119088
60% in same month 99240 79392 71452.8
5% in one month advance 6616 5954.4 6549.85
10% in one month’s credit 16540 13232
25% in 2 months credit 41350
monthly receipt from room
revenue 105856
101886.
4
132584.
7
Collection of foods and beverage 90450 42700 40450
70% collected in same month 63315 29890 28315
20% in one month credit 18090 8540
10% in 2 months credit 9045
Monthly receipt from F & B 63315 47980 45900
prior period receipts 30000 10000
Total monthly cash receipts 199171
159866.
4
178484.
7
⊘ This is a preview!⊘
Do you want full access?
Subscribe today to unlock all pages.
Trusted by 1+ million students worldwide
6TOURISM AND HOSPITALIT CONTROL
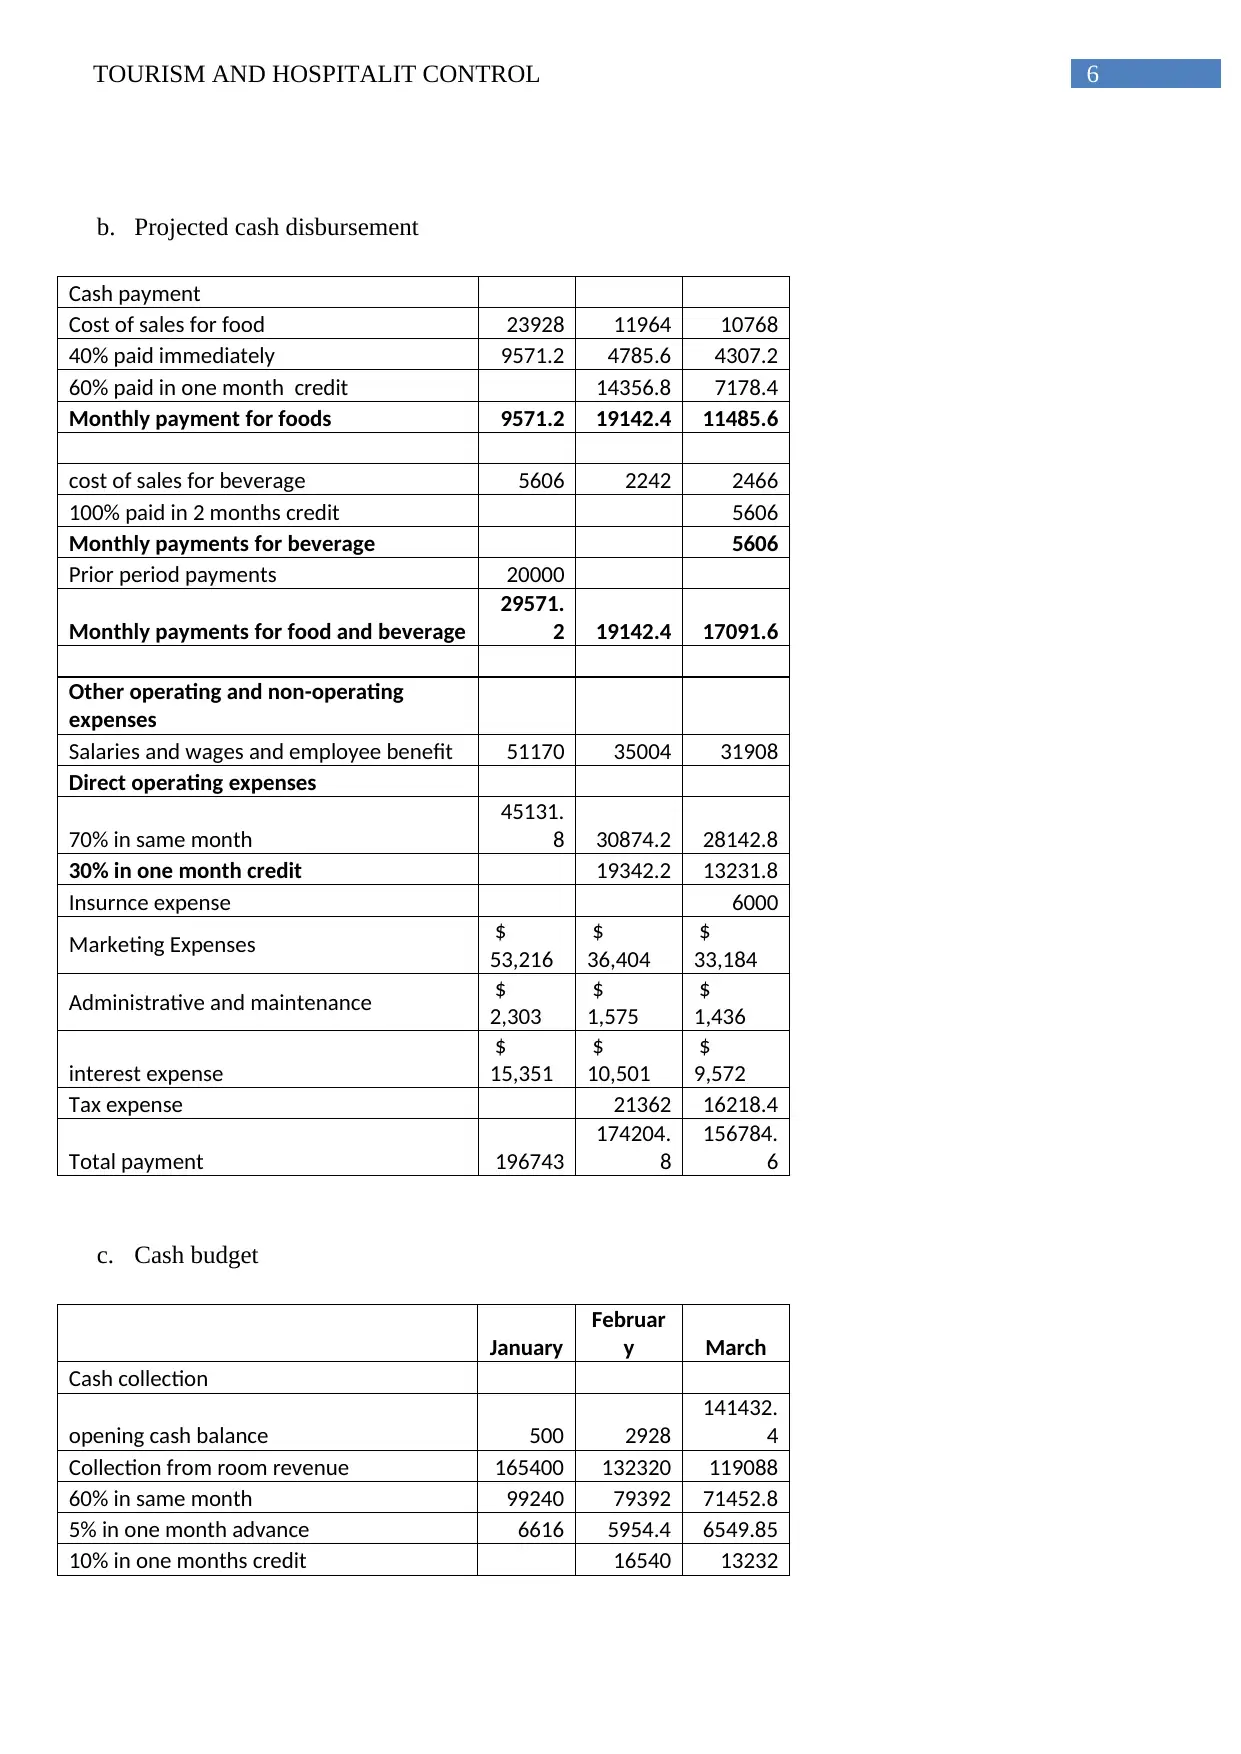
b. Projected cash disbursement
Cash payment
Cost of sales for food 23928 11964 10768
40% paid immediately 9571.2 4785.6 4307.2
60% paid in one month credit 14356.8 7178.4
Monthly payment for foods 9571.2 19142.4 11485.6
cost of sales for beverage 5606 2242 2466
100% paid in 2 months credit 5606
Monthly payments for beverage 5606
Prior period payments 20000
Monthly payments for food and beverage
29571.
2 19142.4 17091.6
Other operating and non-operating
expenses
Salaries and wages and employee benefit 51170 35004 31908
Direct operating expenses
70% in same month
45131.
8 30874.2 28142.8
30% in one month credit 19342.2 13231.8
Insurnce expense 6000
Marketing Expenses $
53,216
$
36,404
$
33,184
Administrative and maintenance $
2,303
$
1,575
$
1,436
interest expense
$
15,351
$
10,501
$
9,572
Tax expense 21362 16218.4
Total payment 196743
174204.
8
156784.
6
c. Cash budget
January
Februar
y March
Cash collection
opening cash balance 500 2928
141432.
4
Collection from room revenue 165400 132320 119088
60% in same month 99240 79392 71452.8
5% in one month advance 6616 5954.4 6549.85
10% in one months credit 16540 13232
Paraphrase This Document
Need a fresh take? Get an instant paraphrase of this document with our AI Paraphraser
7TOURISM AND HOSPITALIT CONTROL
25% in 2 months credit 41350
monthly receipt from room revenue 105856
101886.
4
132584.
7
Collection of foods and beverage 90450 42700 40450
70% collected in same month 63315 29890 28315
20% in one month credit 18090 8540
10% in 2 months credit 9045
Monthly receipt from F & B 63315 47980 45900
prior period receipts 30000 10000
Total monthly cash receipts 199171
159866.
4
178484.
7
Cash payment
Cost of sales for food 23928 11964 10768
40% paid immediatel 9571.2 4785.6 4307.2
60% paid in one month credit 14356.8 7178.4
Monthly paymnet for foods 9571.2 19142.4 11485.6
cost of sales for beverage 5606 2242 2466
100% paid in 2 months credit 5606
Monthly payments for beverage 5606
Prior period payments 20000
Monthly payments for food and beverage
29571.
2 19142.4 17091.6
Other operating and non-operating
expenses
Salaries and wages and employee benefit 51170 35004 31908
Direct operating expenses
70% in same month
45131.
8 30874.2 28142.8
30% in one month credit 19342.2 13231.8
Insurance expense 6000
Marketing Expenses $
53,216
$
36,404
$
33,184
Administrative and maintenance $
2,303
$
1,575
$
1,436
interest expense
$
15,351
$
10,501
$
9,572
Tax expense 21362 16218.4
Total payment 196743
174204.
8
156784.
6
Closing cash balance 2928
141432.
4
163132.
5
8TOURISM AND HOSPITALIT CONTROL
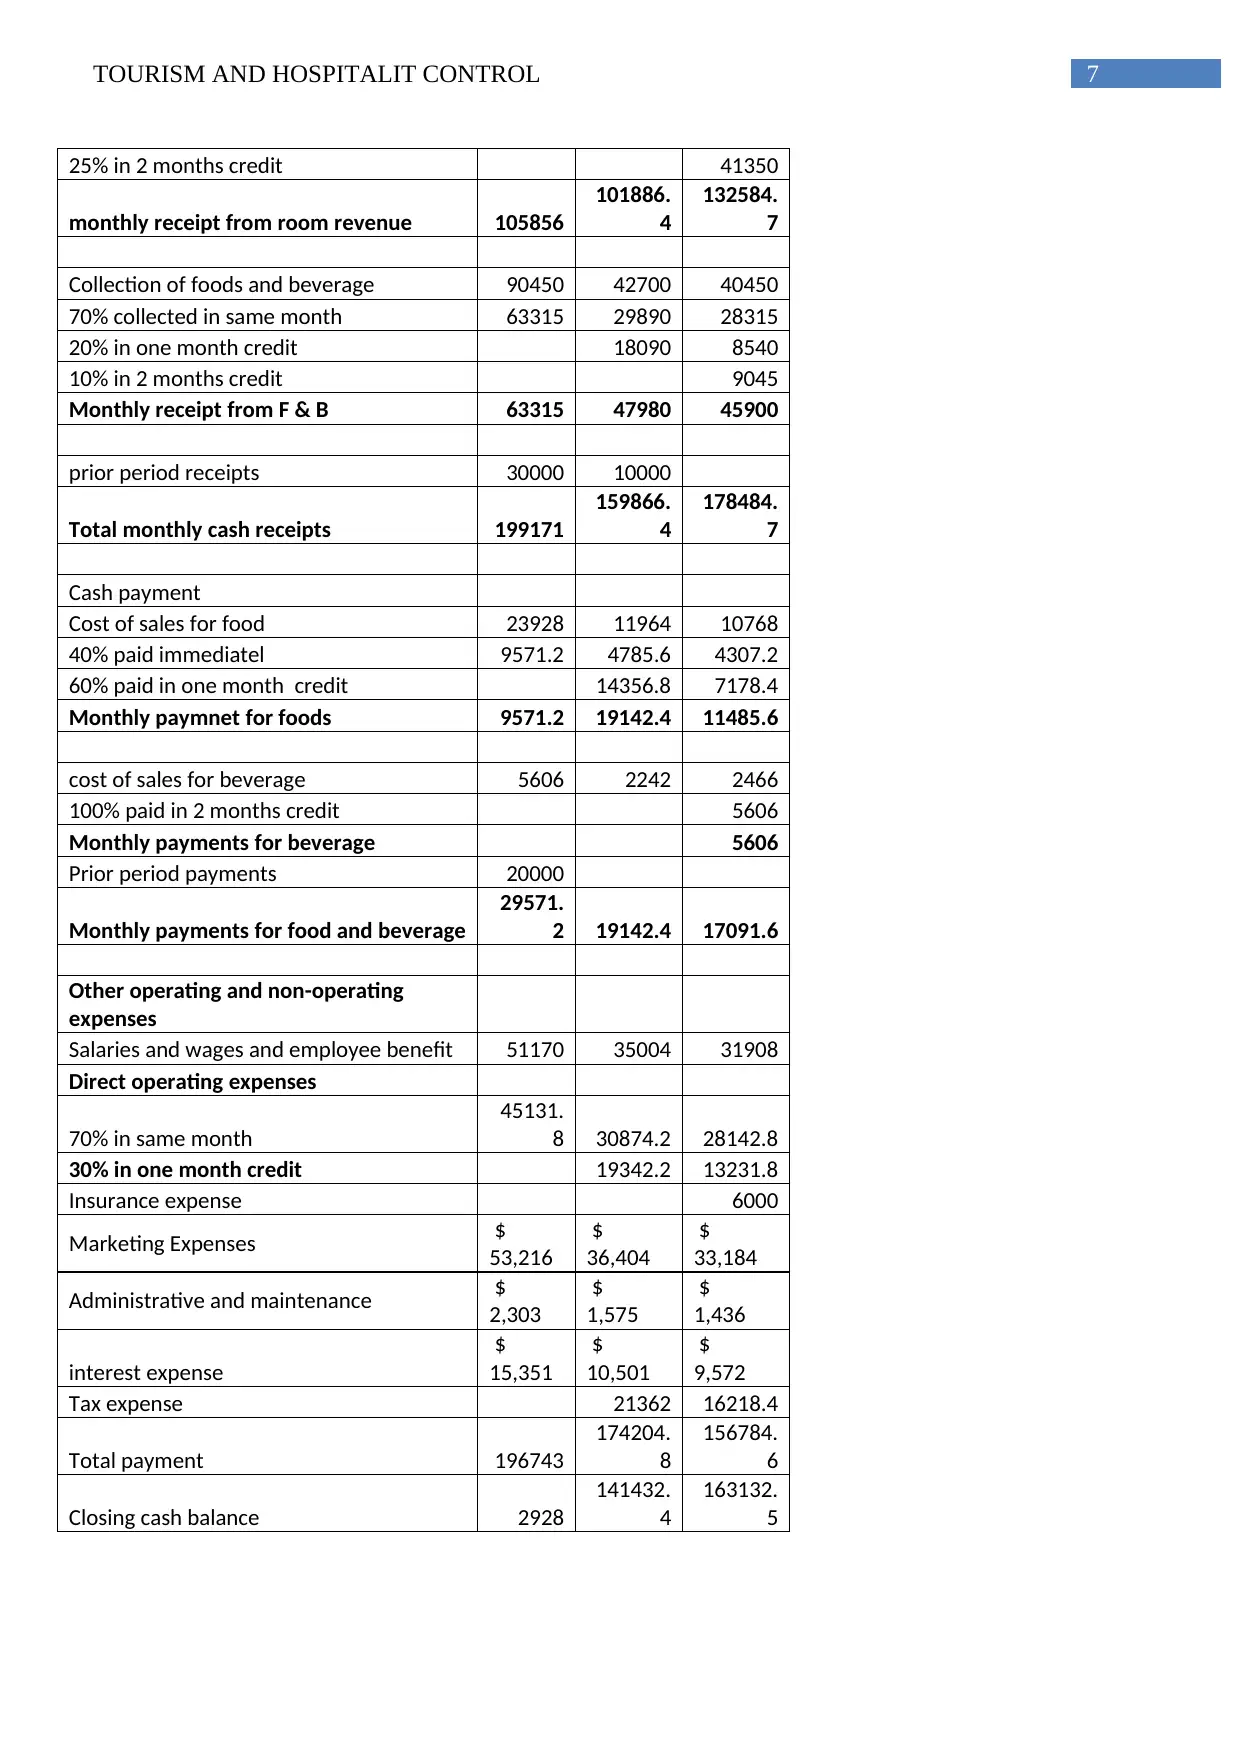
3. Liquidity balance
a. Surplus or deficit
During the 1st quarter of the year the company will have surplus cash flows amounting to
29,28,000, 141432400 and 163132500 for January, February and March consecutively.
b. Possible changes
For improving the cash balance the company shall reduce the credit period allowed to the
airline companies and shall make early payments to the beverage suppliers. It will help to further
improve the company’s liquidity position
⊘ This is a preview!⊘
Do you want full access?
Subscribe today to unlock all pages.
Trusted by 1+ million students worldwide
9TOURISM AND HOSPITALIT CONTROL
Reference
Becker, S. D., Mahlendorf, M. D., Schäffer, U., & Thaten, M. (2016). Budgeting in times of
economic crisis. Contemporary Accounting Research, 33(4), 1489-1517.
Dudin, M., Kucuri, G., Fedorova, I., Dzusova, S., & Namitulina, A. (2015). The innovative business
model canvas in the system of effective budgeting. Asian Social Science, 11(7), 290-296.
Foster, T. A. (2017). Budget planning, budget control, business age, and financial performance in
small businesses.
Mohammadi, A. M., & Mahmudi, A. (2015). The Feasibility of Operational Budgeting
Implementation in Social Security Organization of East Azerbaijan Province. European Online
Journal of Natural and Social Sciences: Proceedings, 4(1 (s)), pp-878.
Pérez-Rave, J., Muñoz-Giraldo, L., & Correa-Morales, J. C. (2017). Use of control charts with
regression analysis for autocorrelated data in the context of logistic financial budgeting. Computers
& Industrial Engineering, 112, 71-83.
Polak, J. J., & Boughton, J. M. (2016). Streamlining the financial structure of the International
Monetary Fund. In Economic Theory and Financial Policy (pp. 175-199). Routledge.
Sponem, S., & Lambert, C. (2016). Exploring differences in budget characteristics, roles and
satisfaction: A configurational approach. Management Accounting Research, 30, 47-61.
Vargas-Hernández, J. G., Cárdenaz, R. C., & Vargas, O. B. (2019). The Budget In The Financial
Management Of The Smes Assisted By The Administrative Process As A Competitive
Tool. Revista Intercontinental De Gestão Desportiva-Rigd, 8(3), 15-35.
1 out of 10
Related Documents


Your All-in-One AI-Powered Toolkit for Academic Success.
+13062052269
info@desklib.com
Available 24*7 on WhatsApp / Email
![[object Object]](/_next/static/media/star-bottom.7253800d.svg)
Unlock your academic potential
Copyright © 2020–2026 A2Z Services. All Rights Reserved. Developed and managed by ZUCOL.