Applied Business Finance: Financial Performance Improvement
VerifiedAdded on 2023/06/17
|12
|2903
|206
Report
AI Summary
This report provides an analysis of applied business finance, focusing on the concept and importance of financial management through a case study approach. It highlights key financial statements like the statement of financial performance, statement of income, and statement of cash flows, explaining their significance in conveying a business's financial position. The report calculates and interprets various financial ratios, including profitability, liquidity, and efficiency ratios, based on the provided case data to assess the company's financial health. It also suggests strategies for the business to improve its financial performance, emphasizing efficient resource utilization and strategic decision-making. Desklib offers a platform for students to access this and other solved assignments, enhancing their understanding of applied business finance principles.

Applied Business
Finance
Finance
Paraphrase This Document
Need a fresh take? Get an instant paraphrase of this document with our AI Paraphraser
Table of Contents
INTRODUCTION ..........................................................................................................................3
TASK 1............................................................................................................................................3
Concept and Importance of Financial Management...............................................................3
TASK 2............................................................................................................................................4
What are the main financial statements..................................................................................4
Use of Ratios in Financial Management:...............................................................................5
TASK 3............................................................................................................................................5
Calculations of different financial data using the case provided ...........................................5
Calculation of Different ratios and describing the profitability, liquidity and efficiency of the
company.................................................................................................................................6
TASK 4............................................................................................................................................8
How can the business in case study improve their financial performance.............................8
CONCLUSION ...............................................................................................................................9
REFERENCES..............................................................................................................................10
APPENDICES...............................................................................................................................11
Calculations performed for the above case study.................................................................11
INTRODUCTION
Applied Business Finance is the practical aspect that is applied in the business. This is a tool that
is used by the strategic managers to strategically plan the future course of action while taking in
account the current financial performance of the company. Financial management is the field that
helps the managers in applying the finance theory (Peterson and Fabozzi, 1999). This report talks
about the concept and importance of financial management with the help of a case study. It
highlights the main financial-statements that are used in the business to present the financial data
with ease. Different financial ratios are calculated in this report using the same finance theory.
TASK 1
Concept and Importance of Financial Management
Financial Management is the process of strategic planning, organising, directing and controlling
of the financial activities of a business enterprise. It refers to the acquisition and utilisation of the
financial resources of the business. Its main focus is to meet the expectations of the shareholders
of the business enterprise. It focuses on maximization of shareholder's wealth, profit and also
maintaining the growth rate of the business. Financial management focuses on three main
decisions and these are discussed below:
Financing Decision- This element of financial management focuses on answering the
sources of the funds that the company can raise funds from. It talks about the short and
long term sources of finance.
Investment Decision- This is the second decision that the business needs to take which
focuses on the amount of the funds that are required by the business (de Souza, Rissatti,
Rover, and Borba, 2019). It is done by critically analysing the allocation of financial
resources and how much are required by the business.
Dividend Decision- This decision refer to the distribution of profits to the shareholders
as dividends. This is a complex managerial judgement as shareholders demand high
dividends while managers would want to retain the amount in business for future growth
prospects.
Importance of Financial Management:
⊘ This is a preview!⊘
Do you want full access?
Subscribe today to unlock all pages.
Trusted by 1+ million students worldwide
1. Profitability: It analyses the efficiency and the growth opportunities of the firm which
will further help in the increasing the profitability and provides a sustainable strategy to
the company.
2. Financial Decision: It helps in taking the critical finance-oriented decisions in respective
of the company. A wrong decision can drive down the whole business (Ponte, and et. al.,
2020). It tells us about the various risks and options and helps in deciding the proportion
of the shareholder's capital and the borrowed funds.
3. Allocation of Funds: The proper distribution of monetary resources and dividends can
be allocated as per the profit. It improves the functional ratio and reduce the cost of
capital and increases the economic value of the firm.
4. Economic Stability: It provides the business a firmness, as it represents the sound
financial system and can prevent from the activities which can be degrading for the
organization and aid in sustaining and earning more profits.
TASK 2
What are the main financial statements
Financial statements refers to the formal records of the financial state and execution records of
the business enterprise. These are written records that help the business convey the crucial
financial position to the different stakeholders of the financial information (Khoja, Chipulu, and
Jayasekera, 2019). These stakeholders include, investors, market analysts, creditors, employees,
owners etc. There are three major financial statements in the field of business. These are
discussed hereunder:
Statement of financial performance: This is the most important financial statement in
the business as it gives insights to the users of financial information about the financial
performance of the business. This statement tells the total assets the firm holds and the
liabilities which the company is obligated to pay in future. It is also known as balance
sheet which is basically the bottom line of the businesses. In simple words, this statement
reflects where the business stands financially at a particular point of time.
Statement of income/ statement or profit or loss: This financial statement summarizes
the revenues, expenses and costs that have incurred in the accounting period. It also9
shows the sales that have been made in the period and what were the expenses that have
Paraphrase This Document
Need a fresh take? Get an instant paraphrase of this document with our AI Paraphraser
been faced by the business to produce and make the sales. By subtracting the expenses
and incomes of the period the company shows its profits for the period. This net profit is
end element in the statement of income (Bordeianu, and Radu, 2020).
Statement of cash flows: This financial statement shows the net amount of
inflow/outflow of cash from the business in a period of time. It shows the changes in the
cash from operations, investing and financing activities during a period of time.
Operating activities shows the changes made in the current assets and current liabilities,
interests and tax payments. Financing activities shows the inflows and outflows from the
issue of equity capital, debentures, loans and dividend paid.
Use of Ratios in Financial Management:
Financial Ratios Analysis is a tool in accounting which helps managers analyse the financial data
that have been collected over a period of time (Gupta, Naithani, and Gautam, 2021). It measures
the relation between two or more elements of the financial statements. It is a great tool for the
management as it helps them evaluate the economic performance of the business. It helps the
managers to take short and long term decisions for the business and identifying the trends in the
business. The main uses of ratio analysis are:
Financial ratios helps the strategic managers in decision-making- The financial
statements, profits, trends in returns, borrowing and paying capacity of the business are
used in calculation of ratios and after thorough comparisons of these ratios, managers get
the insights as to what is needed to be done in the future to gain more profits.
Financial ratios helps in Operational efficiency- the ratios helps in determining the
liquidity, solvency, and profitability of the business. Ratio analysis helps the management
to keep low costs at high efficiency to meet the organisational goals of the business.
Financial ratios helps in comparisons of different elements in the statements of
financial data of the business (Apte and Kapshe, 2020). It evaluates the fiscal
performance of the business and forms a base to coma pre it with other businesses
working in the same industry.
TASK 3
Calculations of different financial data using the case provided
The Net Profit for the year 2016 , is £43,057. (2015: £18,987,000).
and incomes of the period the company shows its profits for the period. This net profit is
end element in the statement of income (Bordeianu, and Radu, 2020).
Statement of cash flows: This financial statement shows the net amount of
inflow/outflow of cash from the business in a period of time. It shows the changes in the
cash from operations, investing and financing activities during a period of time.
Operating activities shows the changes made in the current assets and current liabilities,
interests and tax payments. Financing activities shows the inflows and outflows from the
issue of equity capital, debentures, loans and dividend paid.
Use of Ratios in Financial Management:
Financial Ratios Analysis is a tool in accounting which helps managers analyse the financial data
that have been collected over a period of time (Gupta, Naithani, and Gautam, 2021). It measures
the relation between two or more elements of the financial statements. It is a great tool for the
management as it helps them evaluate the economic performance of the business. It helps the
managers to take short and long term decisions for the business and identifying the trends in the
business. The main uses of ratio analysis are:
Financial ratios helps the strategic managers in decision-making- The financial
statements, profits, trends in returns, borrowing and paying capacity of the business are
used in calculation of ratios and after thorough comparisons of these ratios, managers get
the insights as to what is needed to be done in the future to gain more profits.
Financial ratios helps in Operational efficiency- the ratios helps in determining the
liquidity, solvency, and profitability of the business. Ratio analysis helps the management
to keep low costs at high efficiency to meet the organisational goals of the business.
Financial ratios helps in comparisons of different elements in the statements of
financial data of the business (Apte and Kapshe, 2020). It evaluates the fiscal
performance of the business and forms a base to coma pre it with other businesses
working in the same industry.
TASK 3
Calculations of different financial data using the case provided
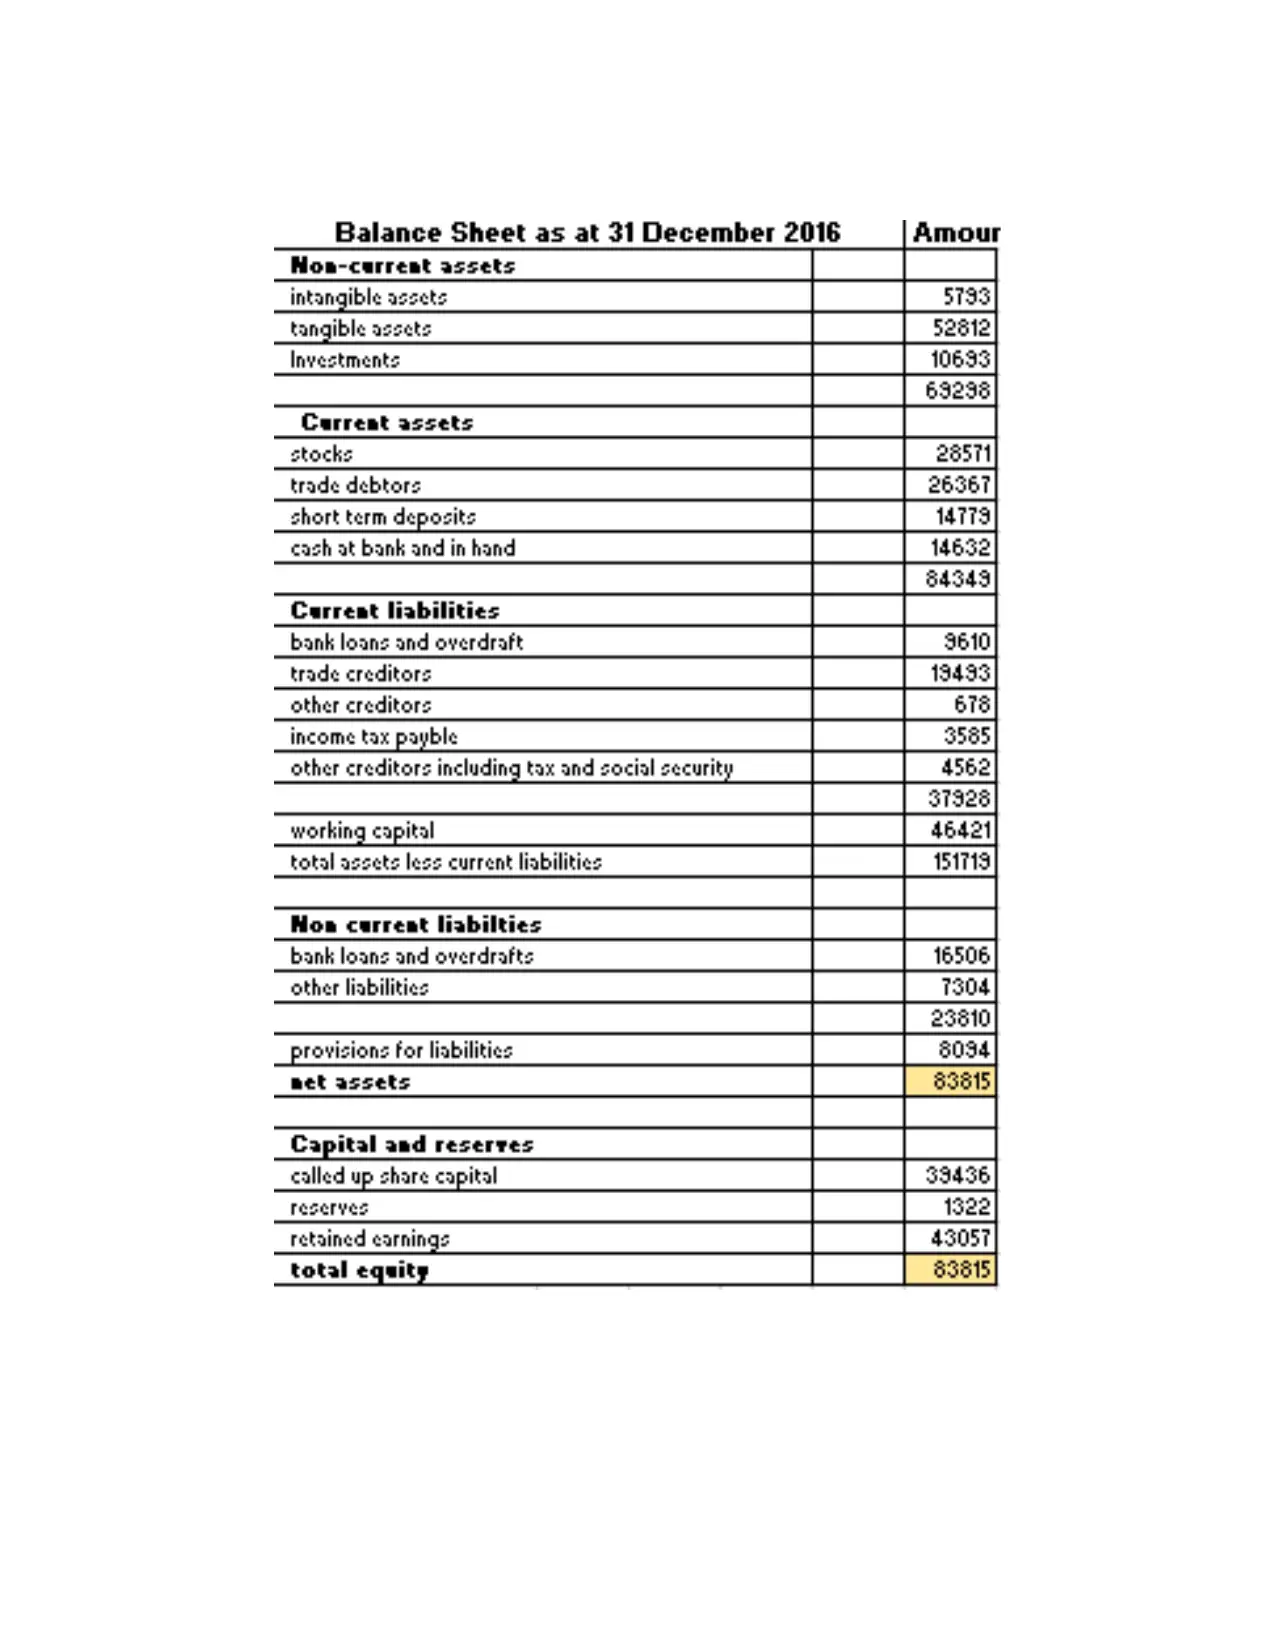
The Net Profit for the year 2016 , is £43,057. (2015: £18,987,000).
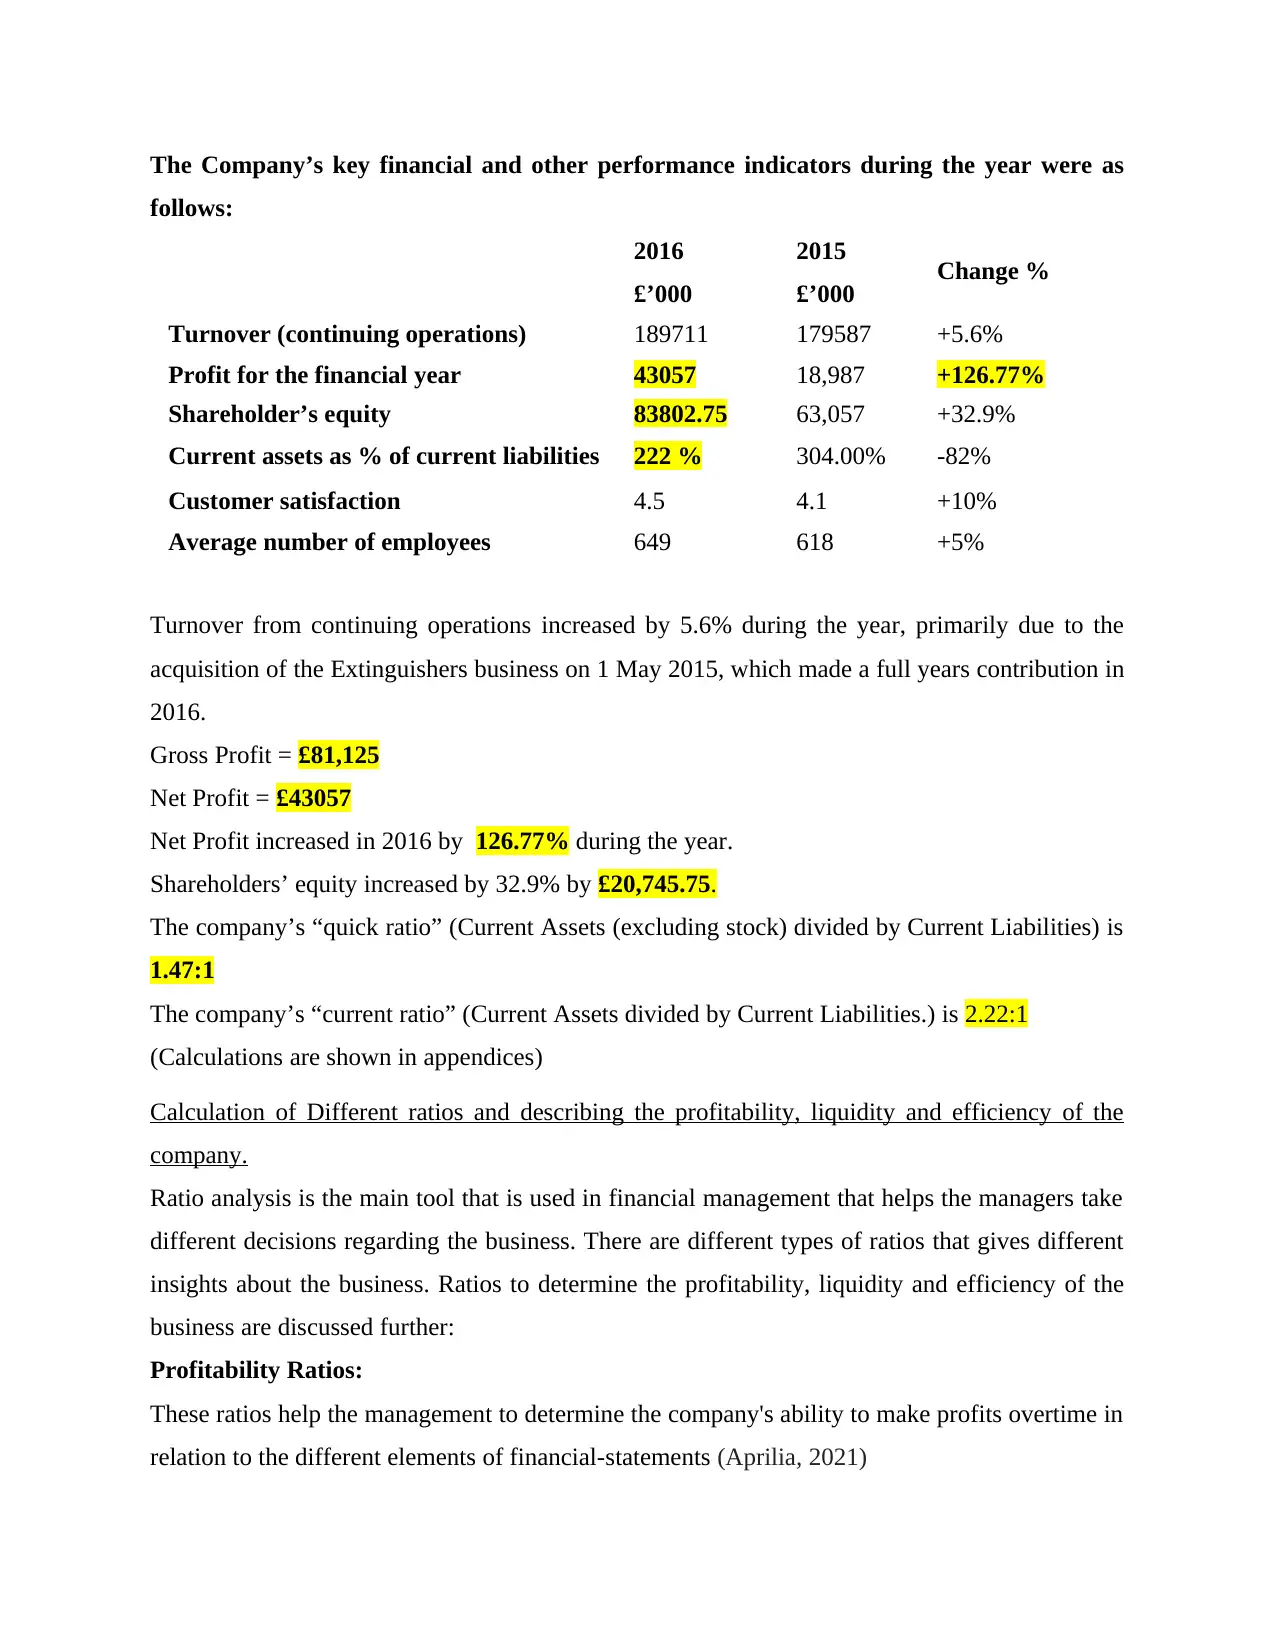
The Company’s key financial and other performance indicators during the year were as
follows:
2016
£’000
2015
£’000 Change %
Turnover (continuing operations) 189711 179587 +5.6%
Profit for the financial year 43057 18,987 +126.77%
Shareholder’s equity 83802.75 63,057 +32.9%
Current assets as % of current liabilities 222 % 304.00% -82%
Customer satisfaction 4.5 4.1 +10%
Average number of employees 649 618 +5%
Turnover from continuing operations increased by 5.6% during the year, primarily due to the
acquisition of the Extinguishers business on 1 May 2015, which made a full years contribution in
2016.
Gross Profit = £81,125
Net Profit = £43057
Net Profit increased in 2016 by 126.77% during the year.
Shareholders’ equity increased by 32.9% by £20,745.75.
The company’s “quick ratio” (Current Assets (excluding stock) divided by Current Liabilities) is
1.47:1
The company’s “current ratio” (Current Assets divided by Current Liabilities.) is 2.22:1
(Calculations are shown in appendices)
Calculation of Different ratios and describing the profitability, liquidity and efficiency of the
company.
Ratio analysis is the main tool that is used in financial management that helps the managers take
different decisions regarding the business. There are different types of ratios that gives different
insights about the business. Ratios to determine the profitability, liquidity and efficiency of the
business are discussed further:
Profitability Ratios:
These ratios help the management to determine the company's ability to make profits overtime in
relation to the different elements of financial-statements (Aprilia, 2021)
⊘ This is a preview!⊘
Do you want full access?
Subscribe today to unlock all pages.
Trusted by 1+ million students worldwide
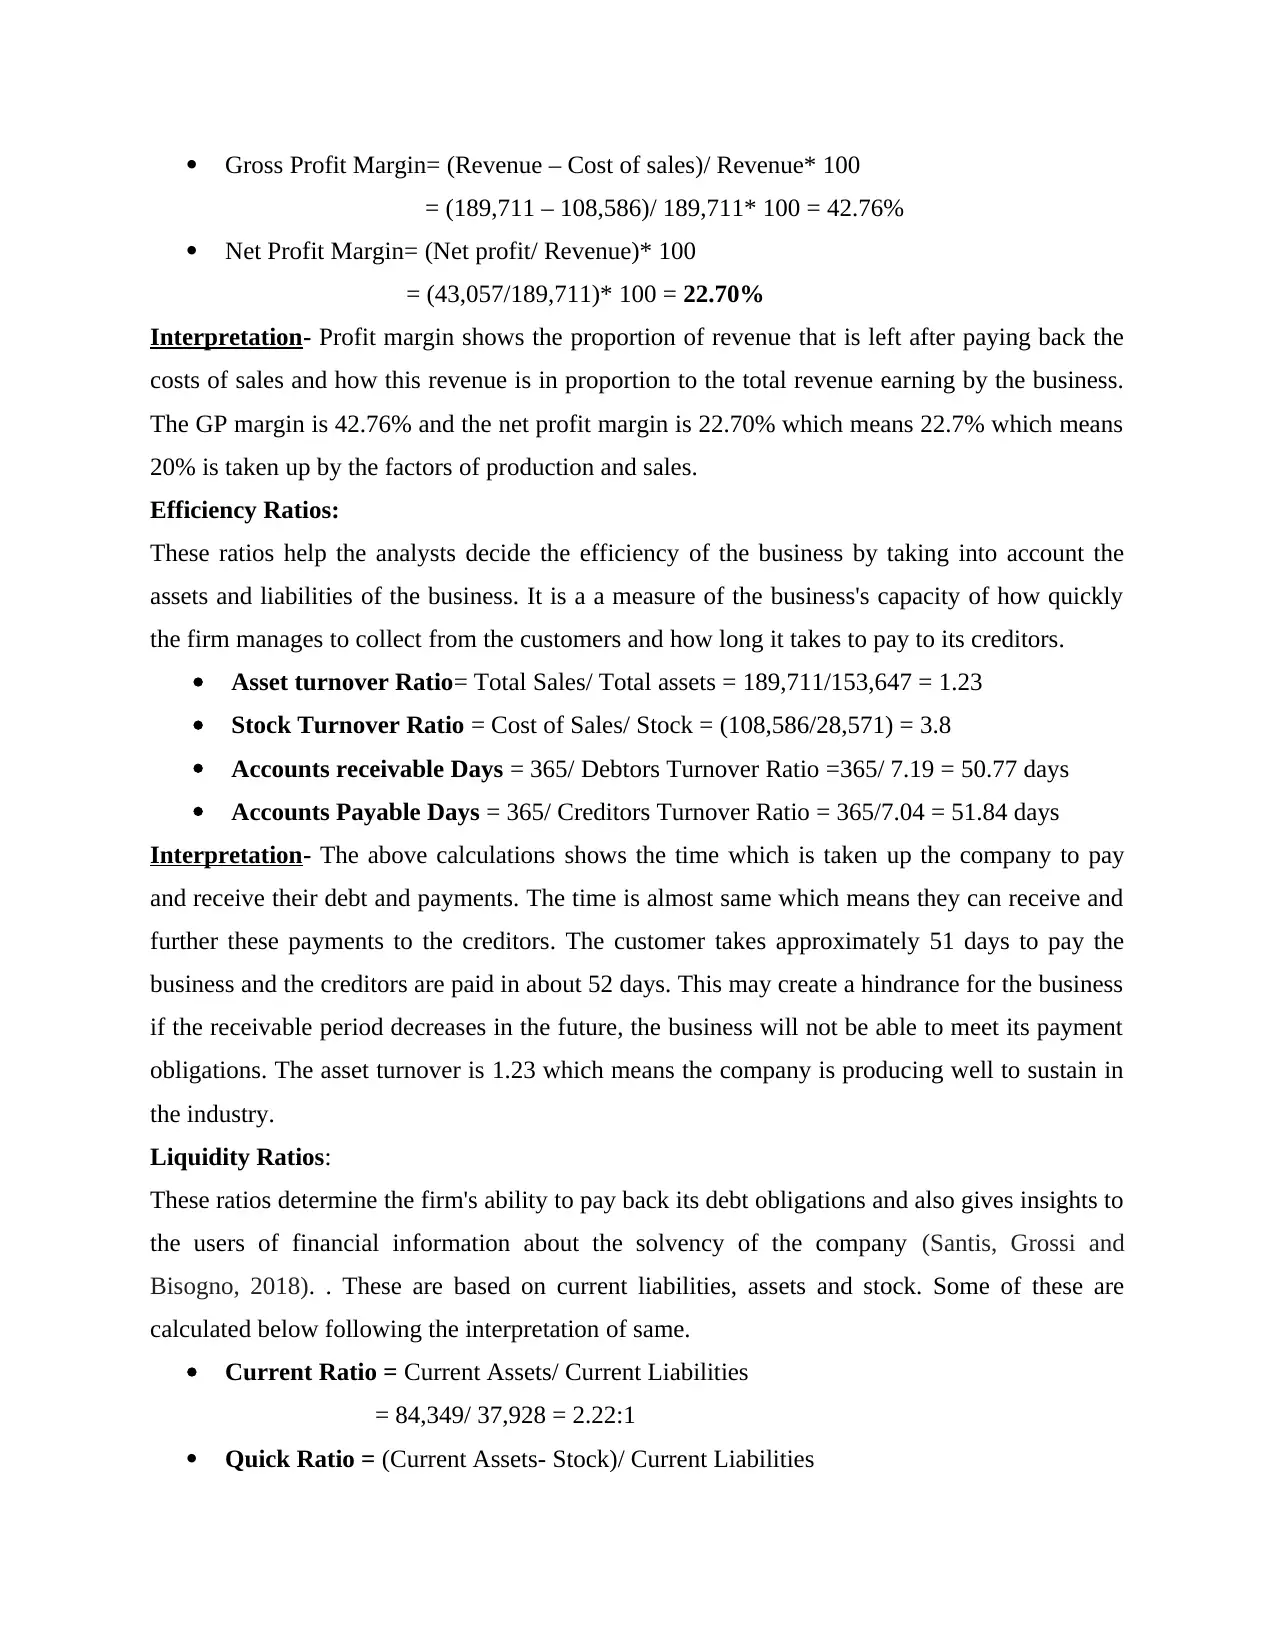
Gross Profit Margin= (Revenue – Cost of sales)/ Revenue* 100
= (189,711 – 108,586)/ 189,711* 100 = 42.76%
Net Profit Margin= (Net profit/ Revenue)* 100
= (43,057/189,711)* 100 = 22.70%
Interpretation- Profit margin shows the proportion of revenue that is left after paying back the
costs of sales and how this revenue is in proportion to the total revenue earning by the business.
The GP margin is 42.76% and the net profit margin is 22.70% which means 22.7% which means
20% is taken up by the factors of production and sales.
Efficiency Ratios:
These ratios help the analysts decide the efficiency of the business by taking into account the
assets and liabilities of the business. It is a a measure of the business's capacity of how quickly
the firm manages to collect from the customers and how long it takes to pay to its creditors.
Asset turnover Ratio= Total Sales/ Total assets = 189,711/153,647 = 1.23
Stock Turnover Ratio = Cost of Sales/ Stock = (108,586/28,571) = 3.8
Accounts receivable Days = 365/ Debtors Turnover Ratio =365/ 7.19 = 50.77 days
Accounts Payable Days = 365/ Creditors Turnover Ratio = 365/7.04 = 51.84 days
Interpretation- The above calculations shows the time which is taken up the company to pay
and receive their debt and payments. The time is almost same which means they can receive and
further these payments to the creditors. The customer takes approximately 51 days to pay the
business and the creditors are paid in about 52 days. This may create a hindrance for the business
if the receivable period decreases in the future, the business will not be able to meet its payment
obligations. The asset turnover is 1.23 which means the company is producing well to sustain in
the industry.
Liquidity Ratios:
These ratios determine the firm's ability to pay back its debt obligations and also gives insights to
the users of financial information about the solvency of the company (Santis, Grossi and
Bisogno, 2018). . These are based on current liabilities, assets and stock. Some of these are
calculated below following the interpretation of same.
Current Ratio = Current Assets/ Current Liabilities
= 84,349/ 37,928 = 2.22:1
Quick Ratio = (Current Assets- Stock)/ Current Liabilities
Paraphrase This Document
Need a fresh take? Get an instant paraphrase of this document with our AI Paraphraser
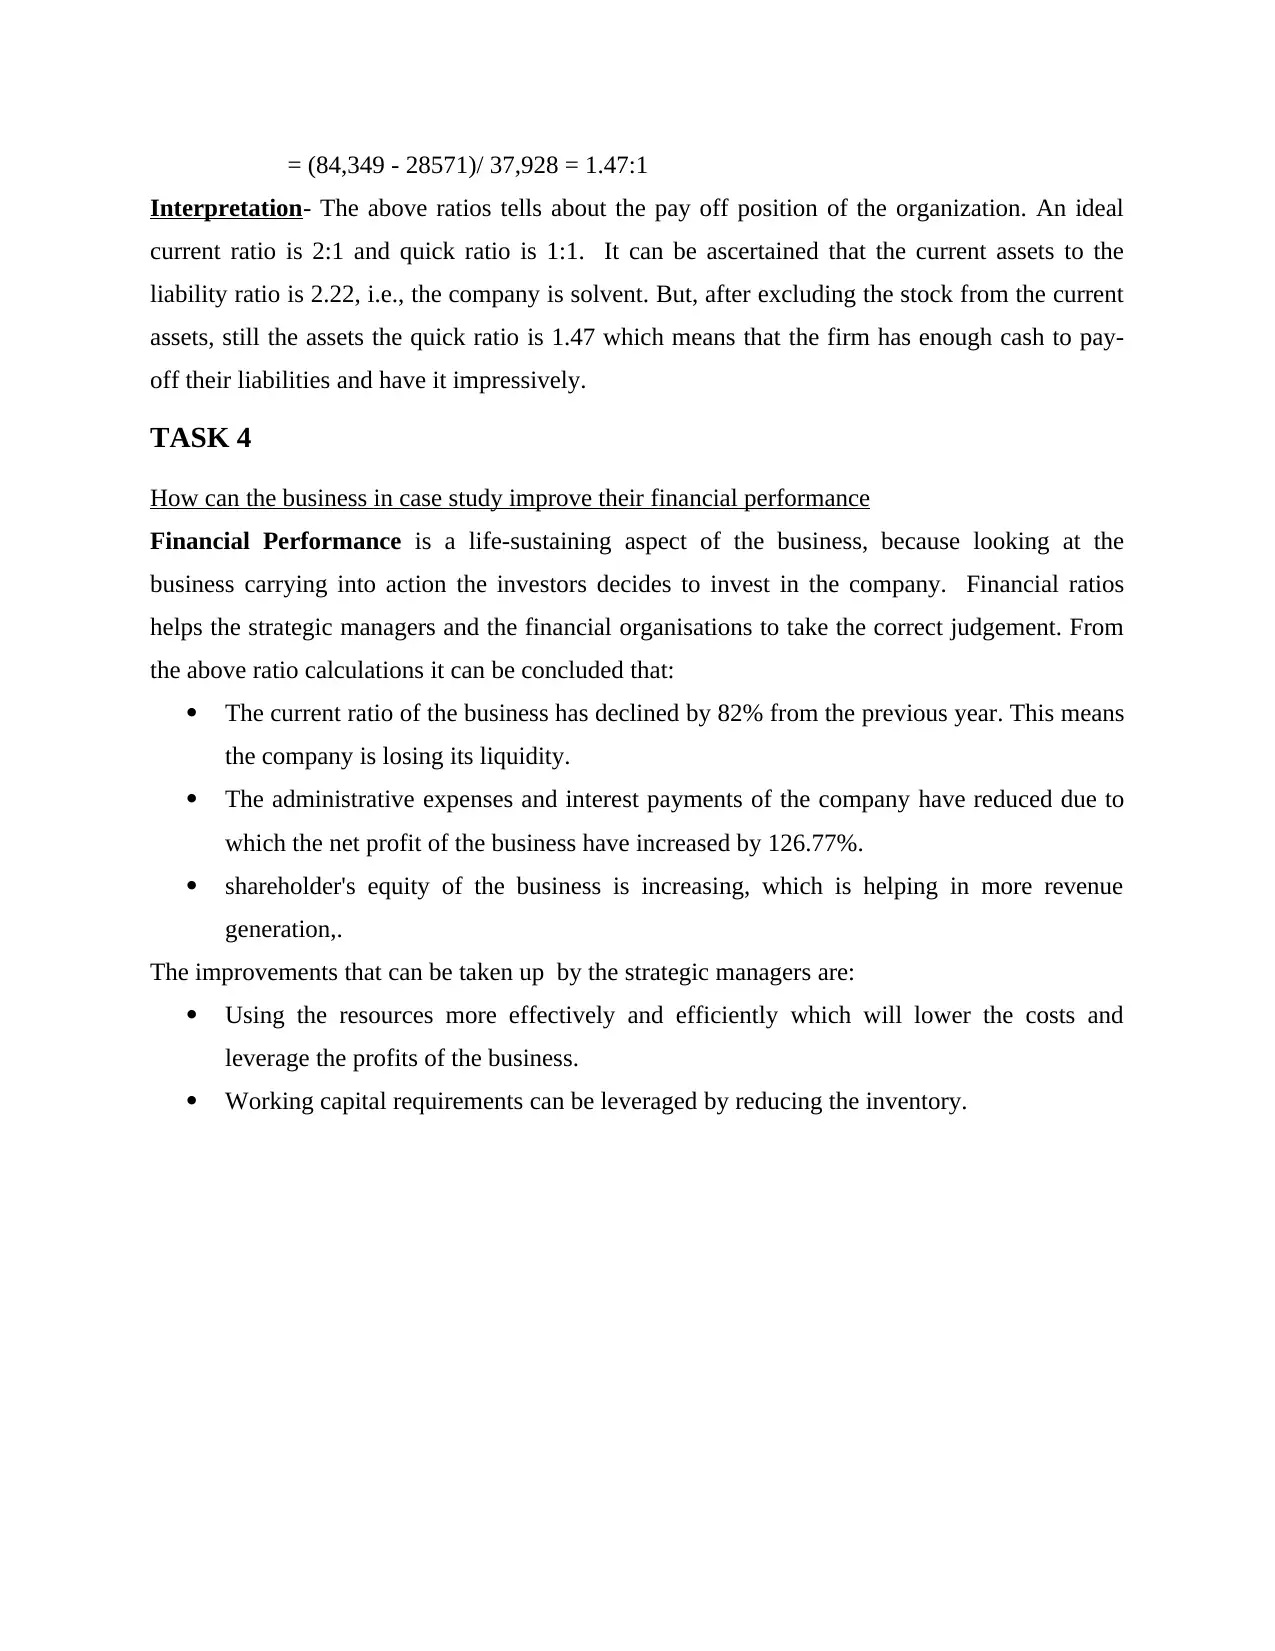
= (84,349 - 28571)/ 37,928 = 1.47:1
Interpretation- The above ratios tells about the pay off position of the organization. An ideal
current ratio is 2:1 and quick ratio is 1:1. It can be ascertained that the current assets to the
liability ratio is 2.22, i.e., the company is solvent. But, after excluding the stock from the current
assets, still the assets the quick ratio is 1.47 which means that the firm has enough cash to pay-
off their liabilities and have it impressively.
TASK 4
How can the business in case study improve their financial performance
Financial Performance is a life-sustaining aspect of the business, because looking at the
business carrying into action the investors decides to invest in the company. Financial ratios
helps the strategic managers and the financial organisations to take the correct judgement. From
the above ratio calculations it can be concluded that:
The current ratio of the business has declined by 82% from the previous year. This means
the company is losing its liquidity.
The administrative expenses and interest payments of the company have reduced due to
which the net profit of the business have increased by 126.77%.
shareholder's equity of the business is increasing, which is helping in more revenue
generation,.
The improvements that can be taken up by the strategic managers are:
Using the resources more effectively and efficiently which will lower the costs and
leverage the profits of the business.
Working capital requirements can be leveraged by reducing the inventory.
CONCLUSION
From the above mentioned report it can be concluded that the financial management is an
important aspect in the field of business. It helps the strategic managers take better and analysed
decisions regarding different aspects of the business. The main purpose of financial management
is to maximize the shareholder's wealth while lowering the costs of business. The report
discusses the different financial statements that are created and calculations of different ratios.
These ratios are then interpreted with recommendations. It is analysed that the company is
earning a high net profit but it can lower its inventory cost which will help in increasing the
revenues and also in the net earnings.
⊘ This is a preview!⊘
Do you want full access?
Subscribe today to unlock all pages.
Trusted by 1+ million students worldwide
REFERENCES
Books and Journals
Peterson, P.P. and Fabozzi, F.J., 1999. Analysis of financial statements (Vol. 54). John Wiley &
Sons.
de Souza, J.A.S., Rissatti, J.C., Rover, S. and Borba, J.A., 2019. The linguistic complexities of
narrative accounting disclosure on financial statements: An analysis based on
readability characteristics. Research in International Business and Finance, 48, pp.59-
74.
Ponte, V.M.R., and et. al., 2020. Analysis of mandatory, non-mandatory and advanced
information disclosure practices in financial statements of companies in Brazil: a
comparative study between 2002 and 2005.
Khoja, L., Chipulu, M. and Jayasekera, R., 2019. Analysis of financial distress cross countries:
Using macroeconomic, industrial indicators and accounting data. International Review
of Financial Analysis, 66, p.101379.
Bordeianu, G.D. and Radu, F., 2020. Basic Types of Financial Ratios Used to Measure a
Company's Performance. Economy Transdisciplinarity Cognition, 23(2).
Gupta, S., Naithani, A. and Gautam, V., 2021. The impact of the recession on the liquidity and
activity ratios of top power transmission company: case of power grid corporation of
India Ltd. International Journal of System Assurance Engineering and Management,
pp.1-8.
Apte, P.G. and Kapshe, S., 2020. International Financial Management|. McGraw-Hill
Education.
Aprilia, Z., 2021. Pengaruh locus of control, financial knowledge, dan personal income terhadap
financial management behavior pada karyawan KPP Pratama Blitar. SKRIPSI
Mahasiswa UM.
Santis, S., Grossi, G. and Bisogno, M., 2018. Public sector consolidated financial statements: a
structured literature review. Journal of Public Budgeting, Accounting & Financial
Management.
Paraphrase This Document
Need a fresh take? Get an instant paraphrase of this document with our AI Paraphraser
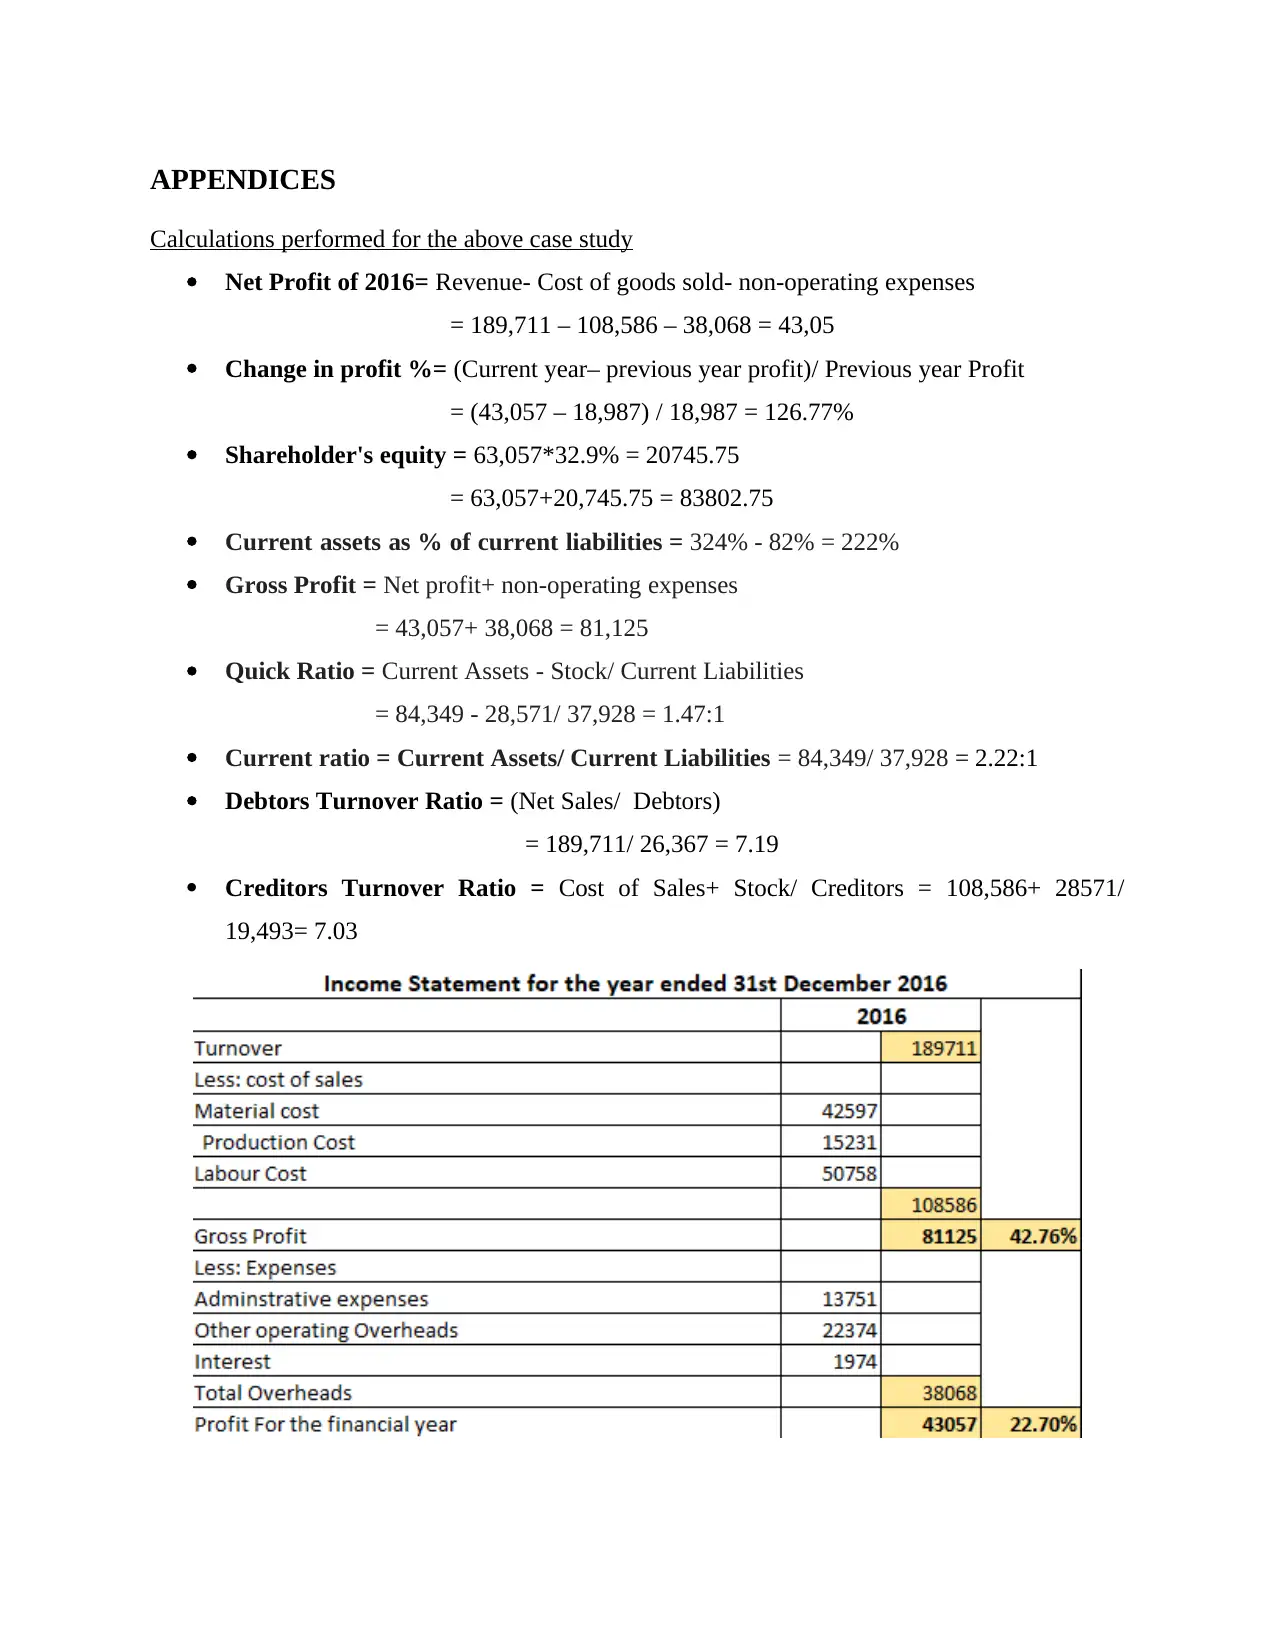
APPENDICES
Calculations performed for the above case study
Net Profit of 2016= Revenue- Cost of goods sold- non-operating expenses
= 189,711 – 108,586 – 38,068 = 43,05
Change in profit %= (Current year– previous year profit)/ Previous year Profit
= (43,057 – 18,987) / 18,987 = 126.77%
Shareholder's equity = 63,057*32.9% = 20745.75
= 63,057+20,745.75 = 83802.75
Current assets as % of current liabilities = 324% - 82% = 222%
Gross Profit = Net profit+ non-operating expenses
= 43,057+ 38,068 = 81,125
Quick Ratio = Current Assets - Stock/ Current Liabilities
= 84,349 - 28,571/ 37,928 = 1.47:1
Current ratio = Current Assets/ Current Liabilities = 84,349/ 37,928 = 2.22:1
Debtors Turnover Ratio = (Net Sales/ Debtors)
= 189,711/ 26,367 = 7.19
Creditors Turnover Ratio = Cost of Sales+ Stock/ Creditors = 108,586+ 28571/
19,493= 7.03
⊘ This is a preview!⊘
Do you want full access?
Subscribe today to unlock all pages.
Trusted by 1+ million students worldwide
1 out of 12
Related Documents


Your All-in-One AI-Powered Toolkit for Academic Success.
+13062052269
info@desklib.com
Available 24*7 on WhatsApp / Email
![[object Object]](/_next/static/media/star-bottom.7253800d.svg)
Unlock your academic potential
Copyright © 2020–2026 A2Z Services. All Rights Reserved. Developed and managed by ZUCOL.