Comprehensive Business Finance and Investment Report

Verified

Added on  2019/12/28

|20
|2858
|79
Report
AI Summary
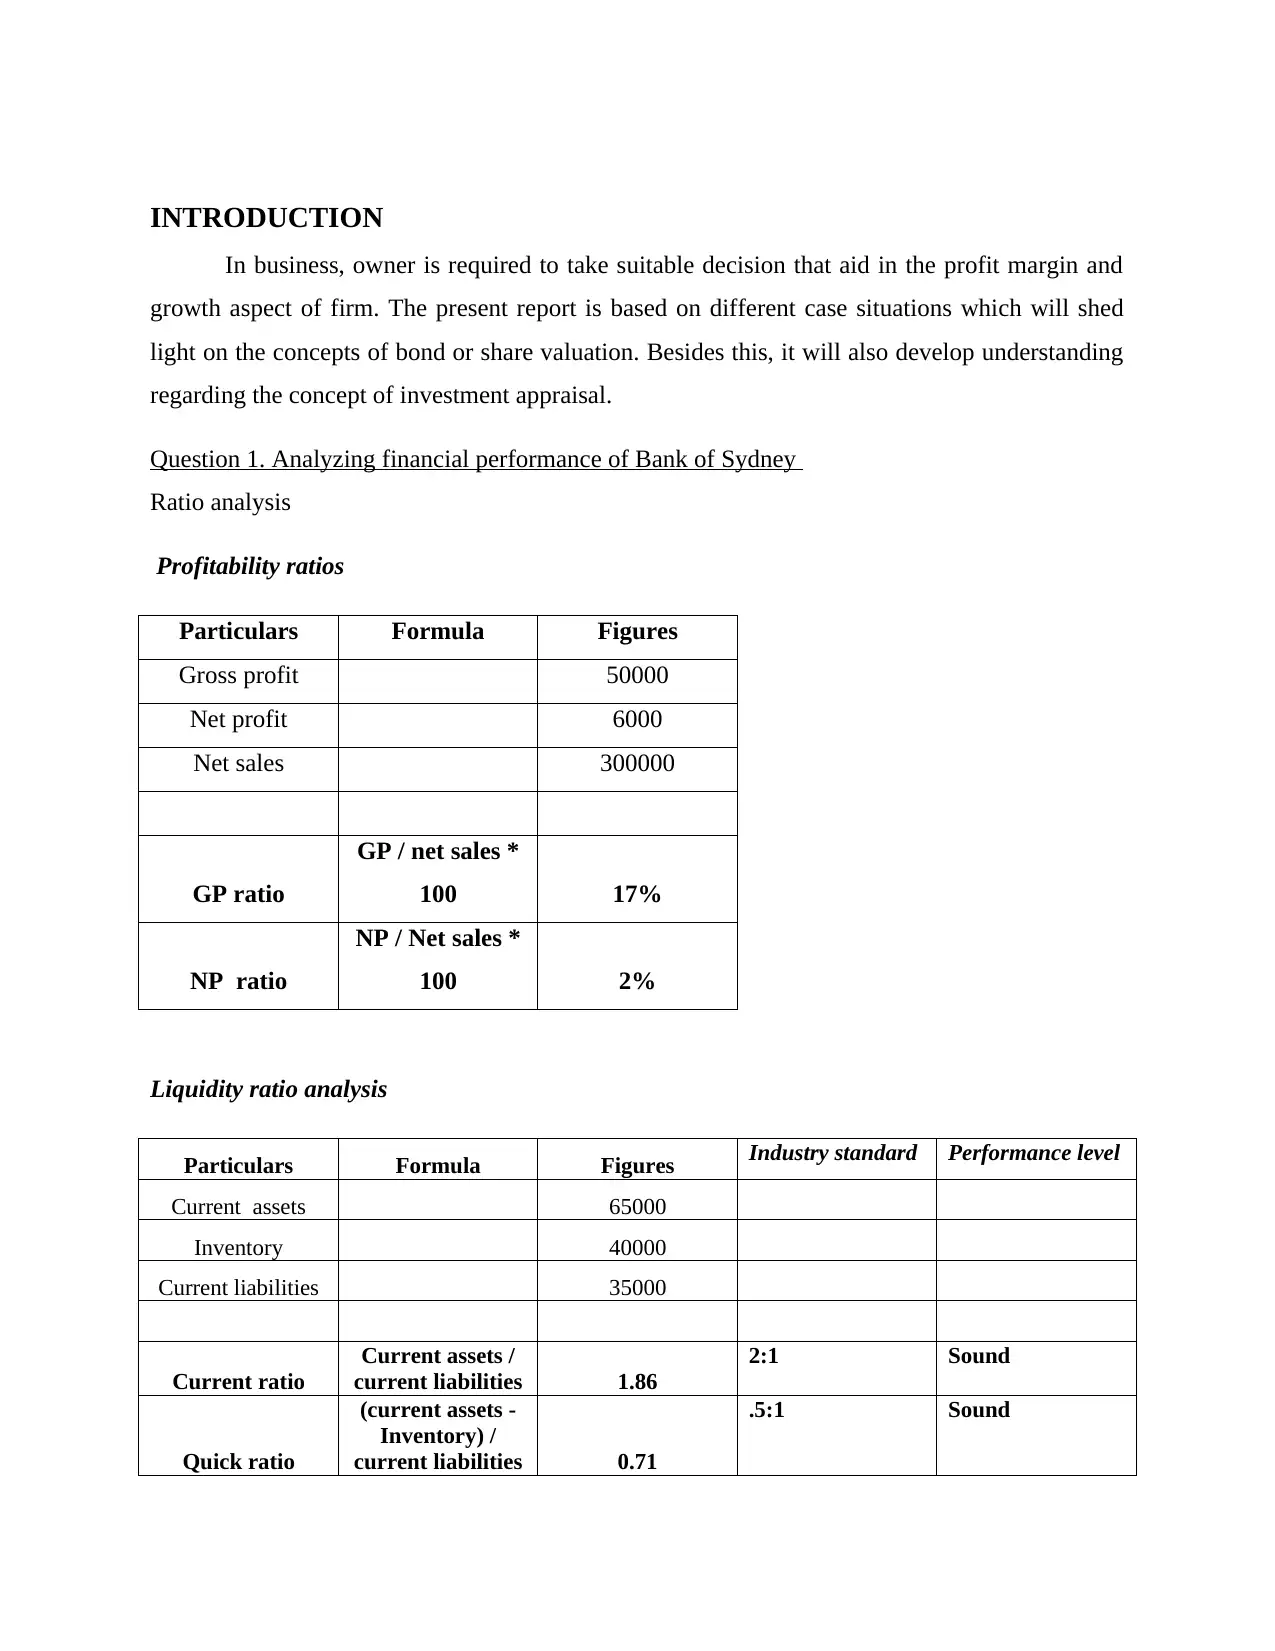
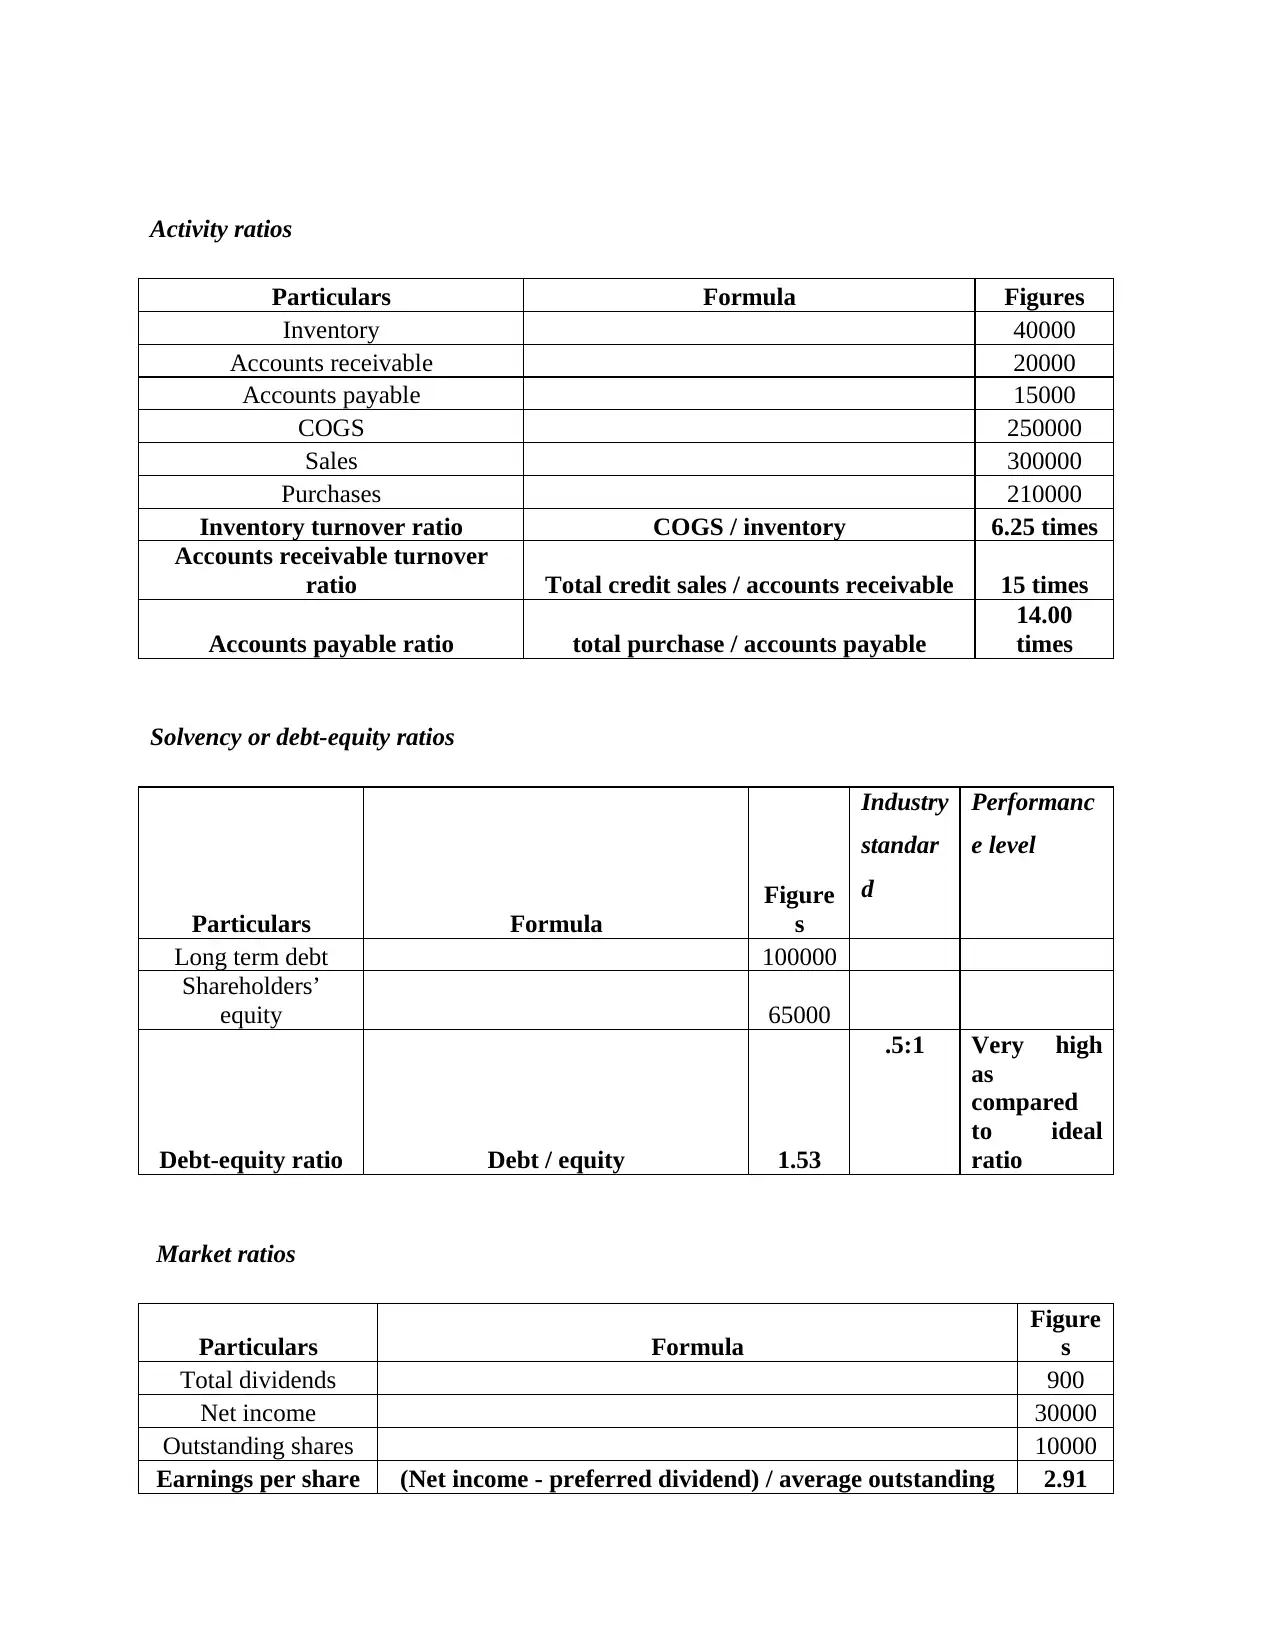
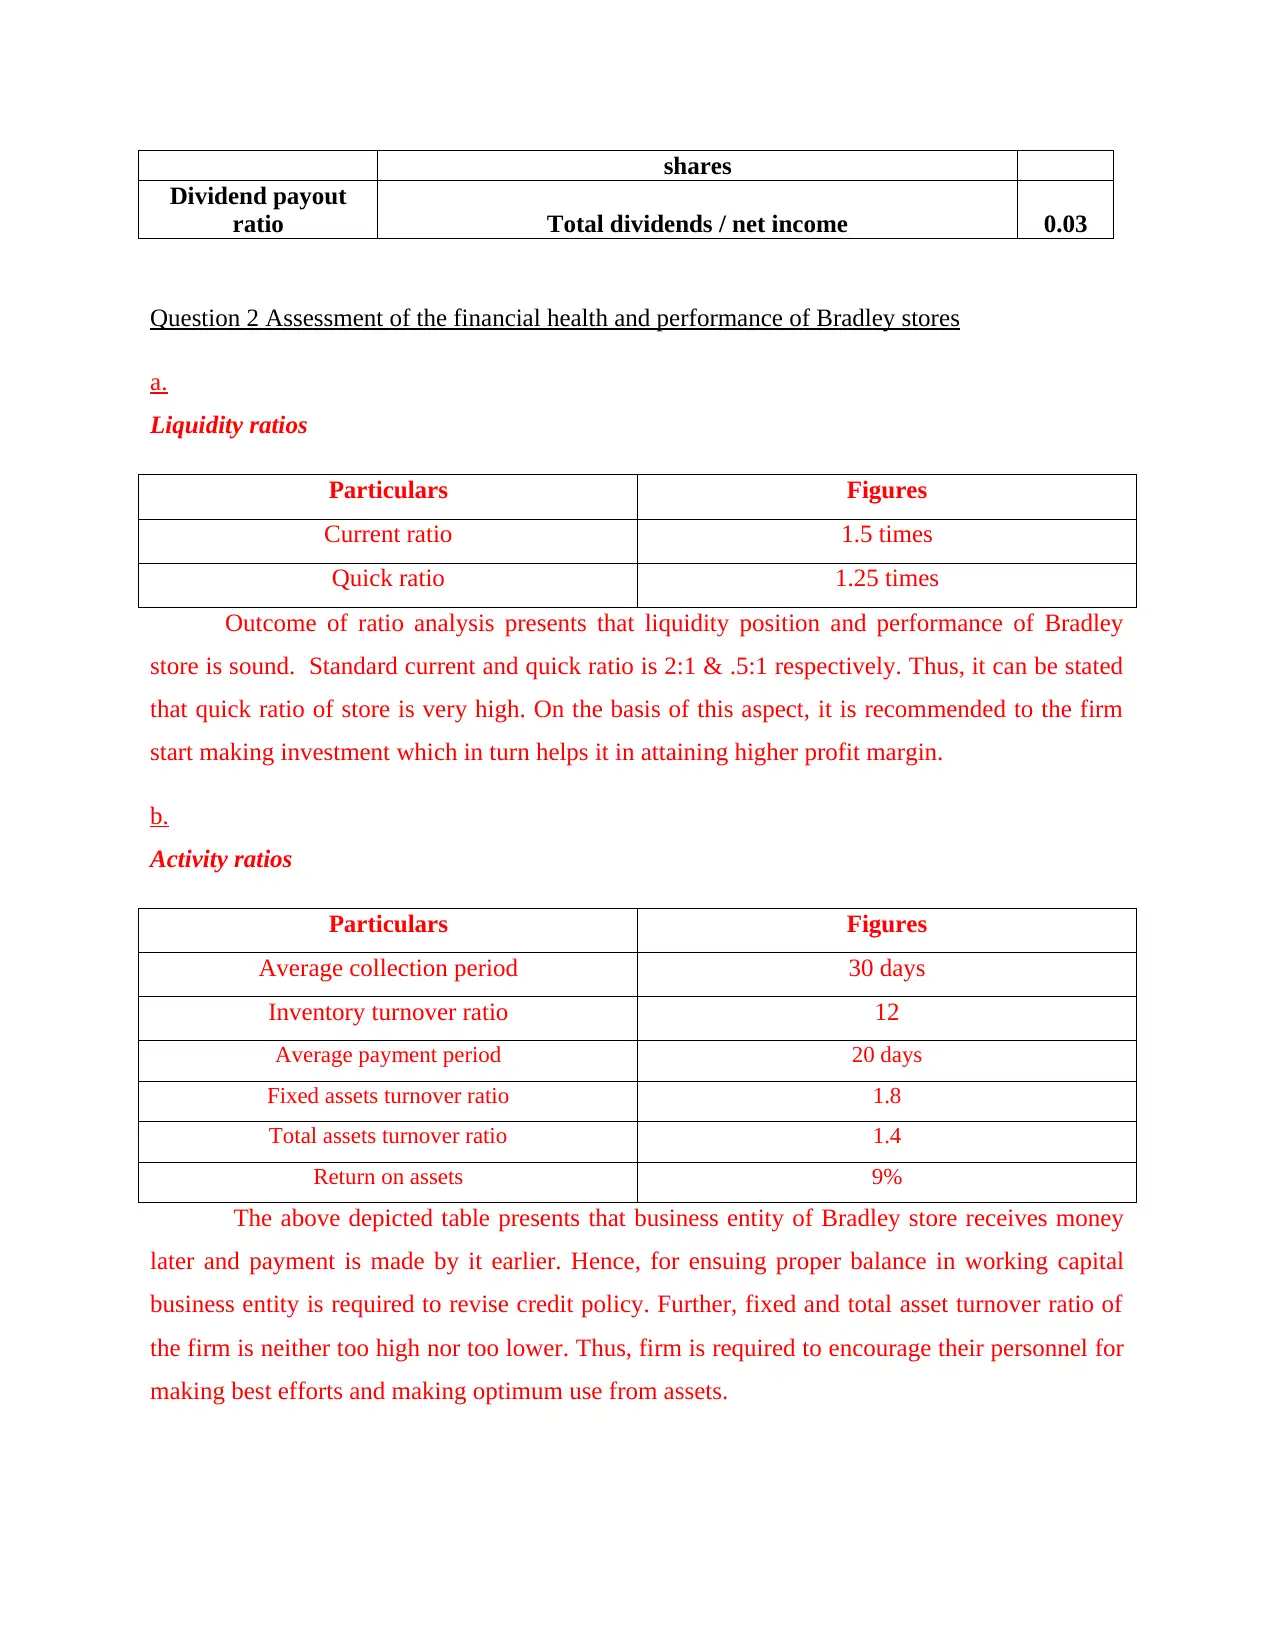
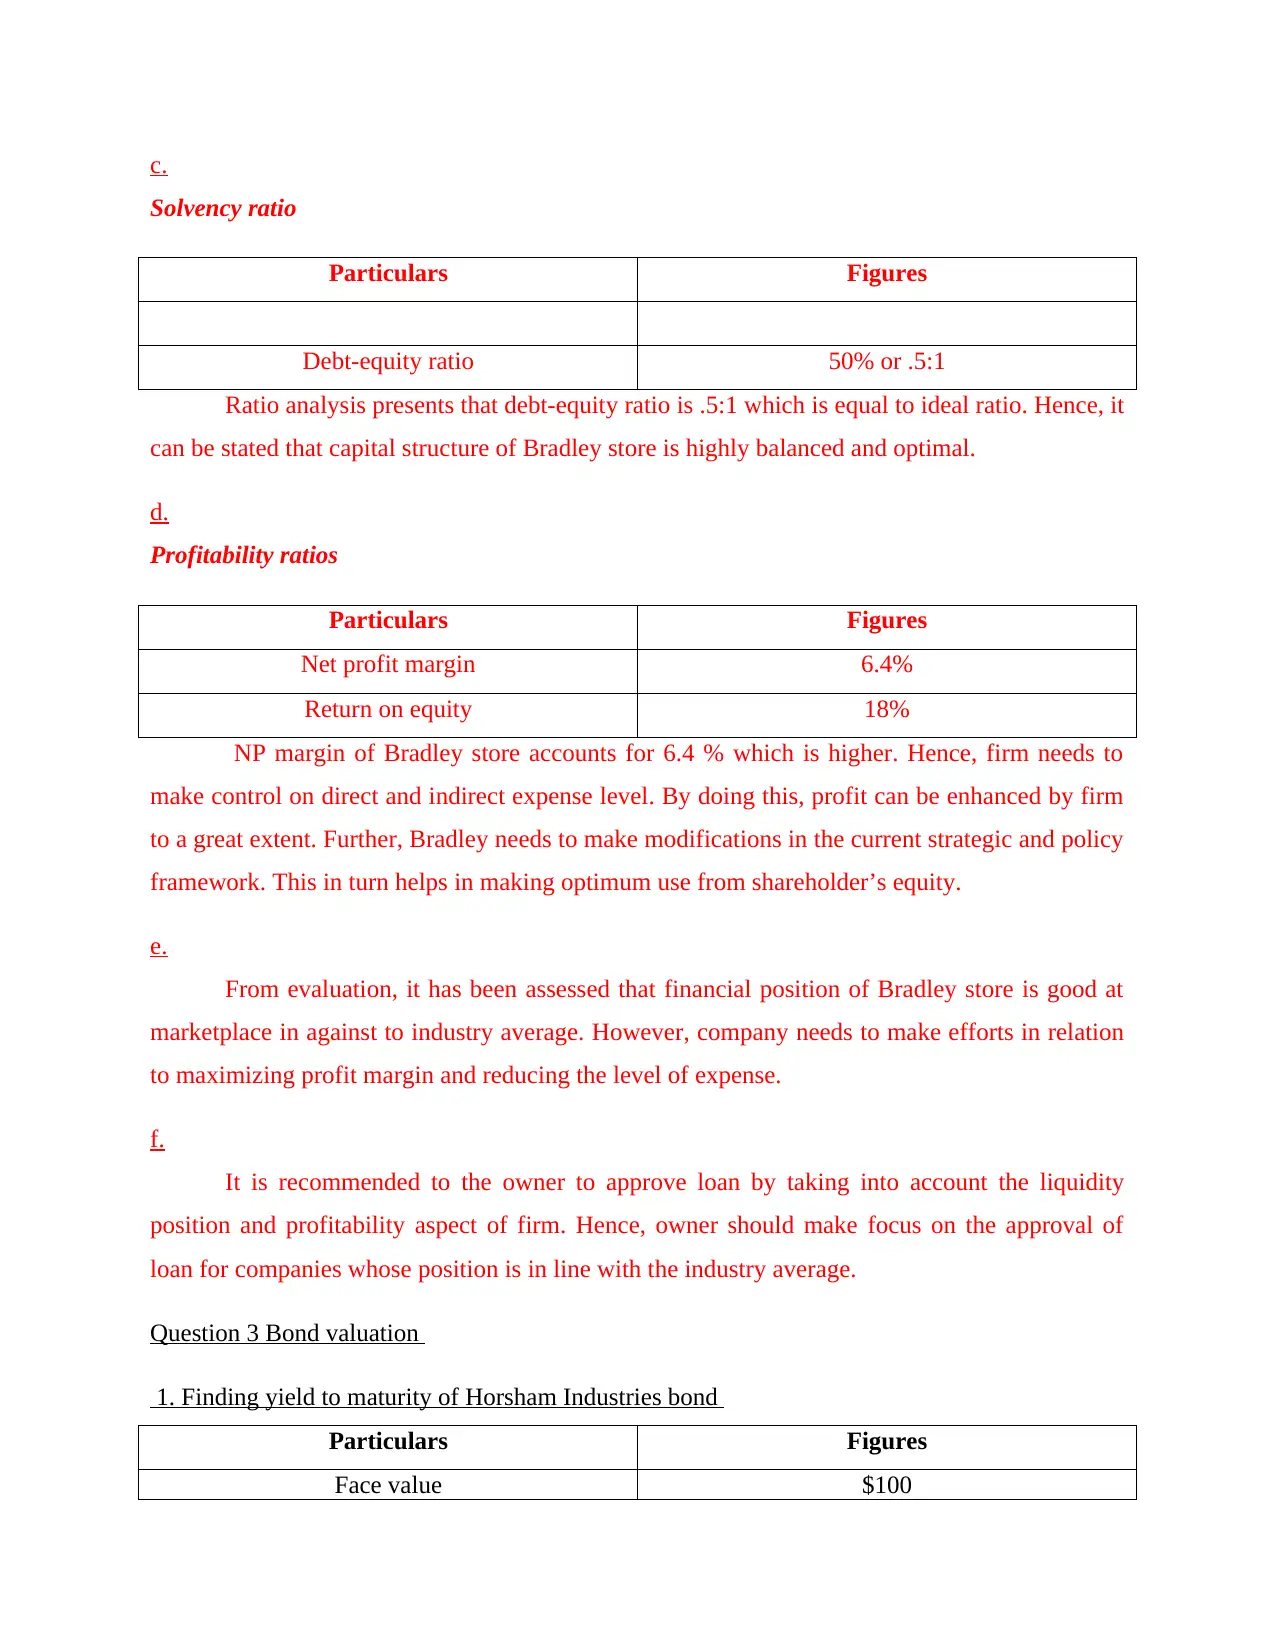
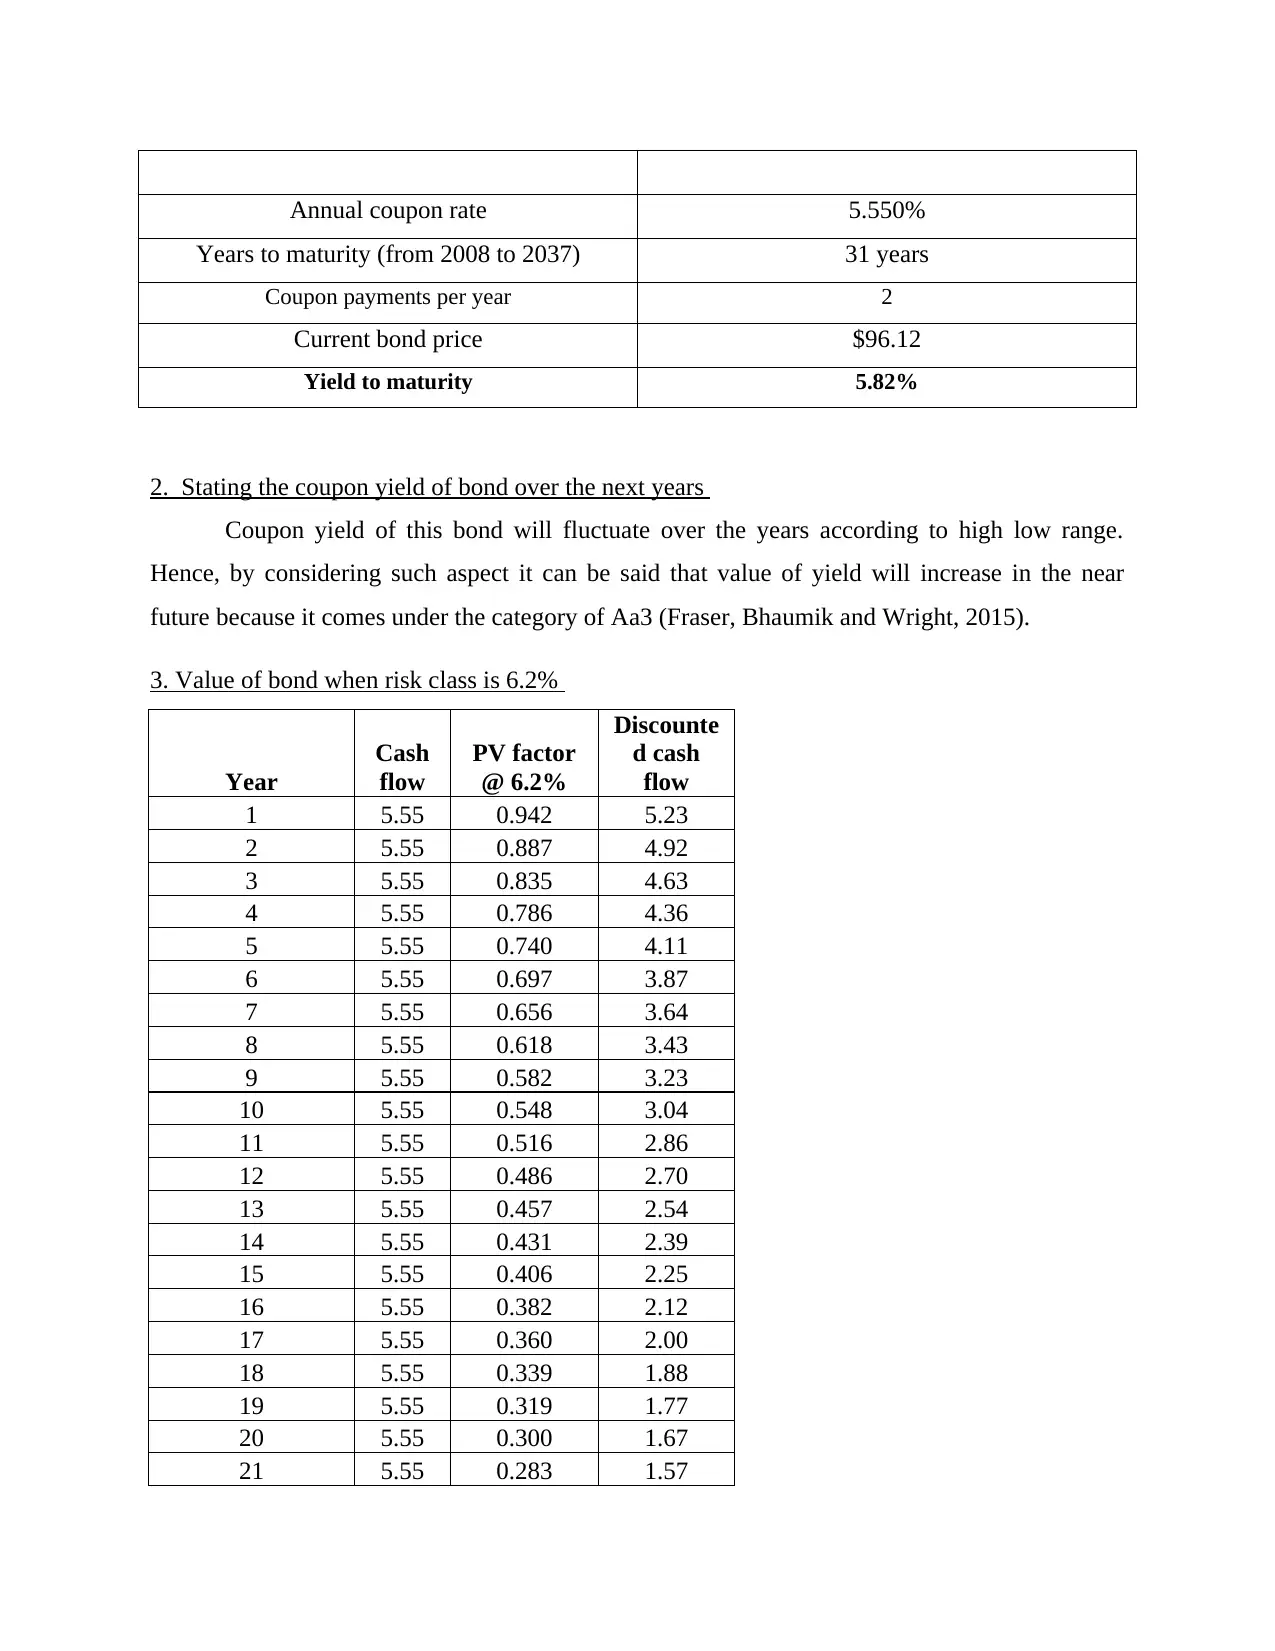
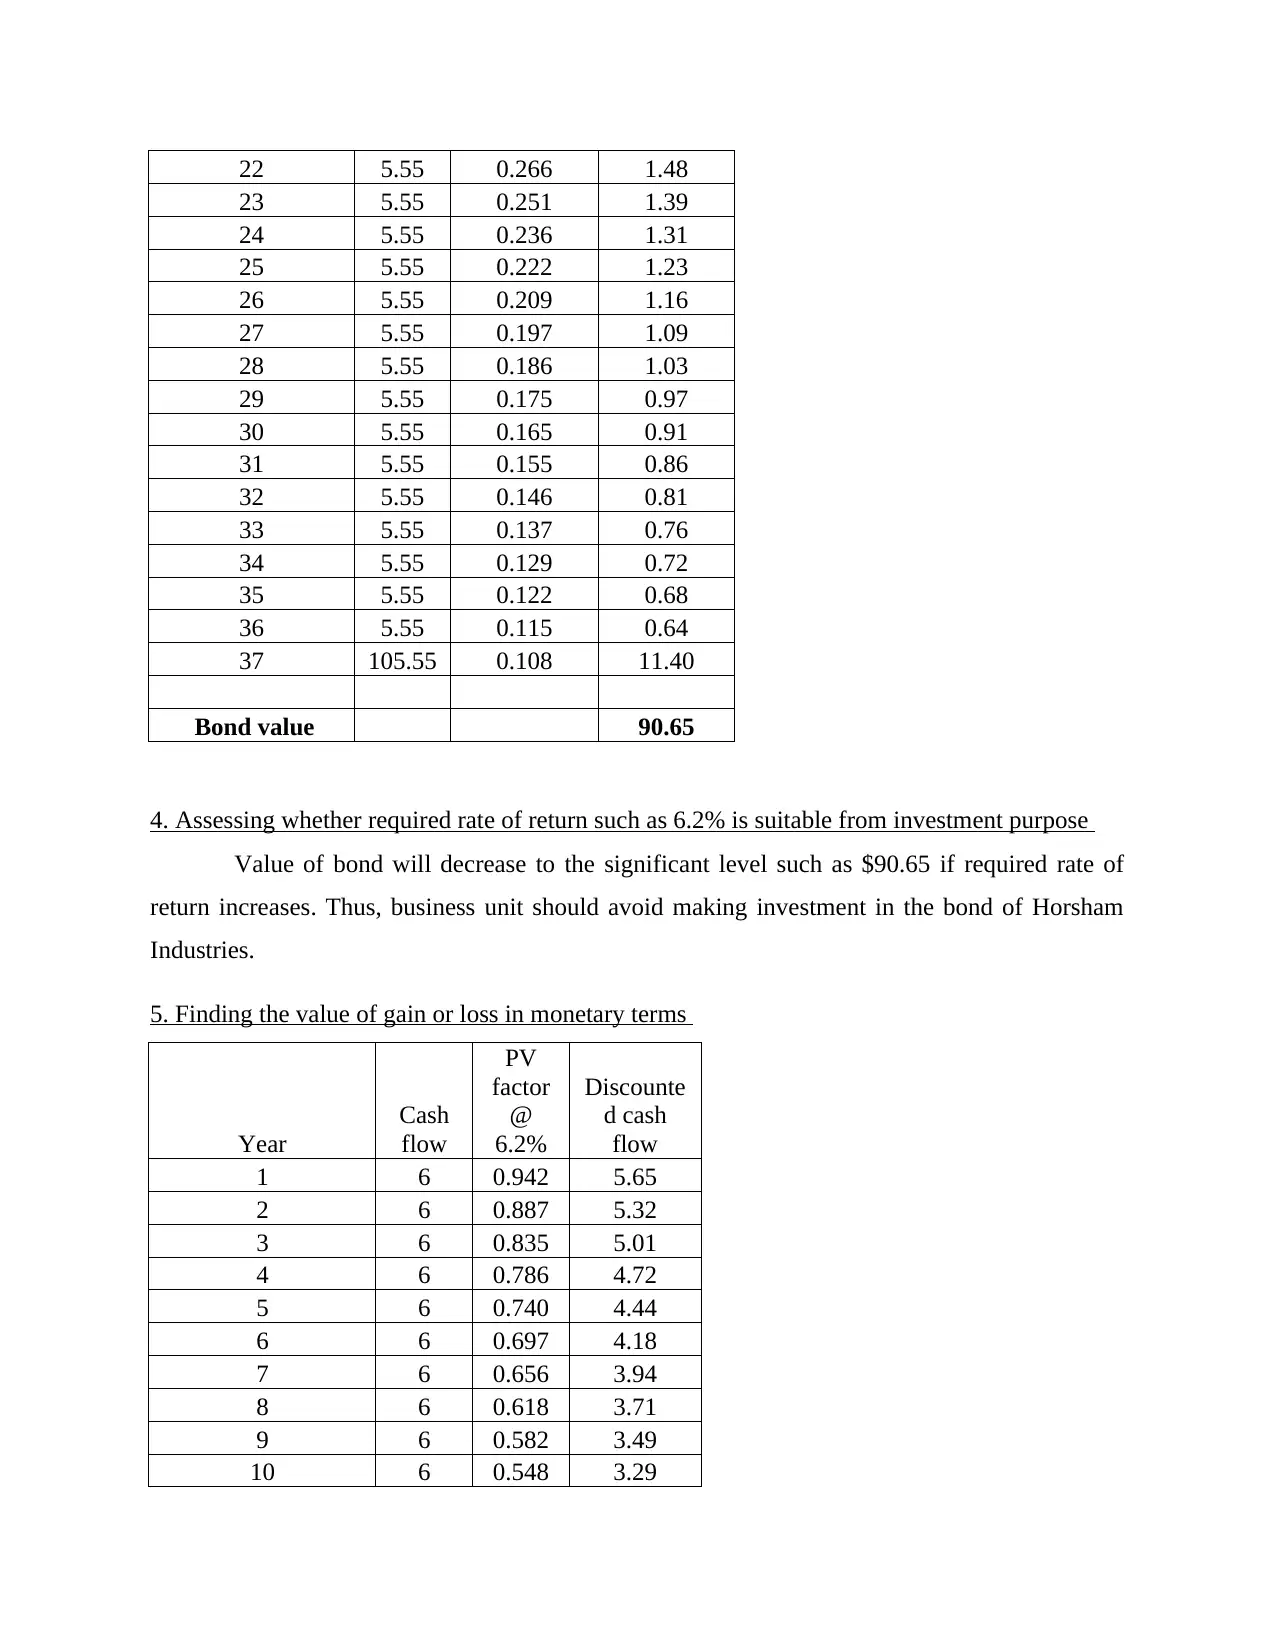
This comprehensive business finance report delves into various aspects of financial management and investment strategies. It begins with an analysis of a company's financial performance, utilizing ratio analysis to assess profitability, liquidity, activity, and solvency. The report then moves on to bond valuation, calculating yield to maturity, coupon yield, and bond values under different risk scenarios. It also explores portfolio evaluation, including the calculation of expected rates of return and standard deviations, along with assessing risk using beta. The report further examines investment appraisal techniques, such as payback period, net present value (NPV), internal rate of return (IRR), and profitability index, to evaluate the viability of proposed investments. Finally, the report provides recommendations based on the financial analysis and investment assessments, offering insights into optimal investment strategies and decision-making processes. The report covers topics such as ratio analysis, bond valuation, portfolio evaluation, and investment appraisal, providing a holistic view of financial management.
Document Page
Business Finance
tabler-icon-diamond-filled.svg

Paraphrase This Document

Need a fresh take? Get an instant paraphrase of this document with our AI Paraphraser
Document Page
Table of Contents
INTRODUCTION...........................................................................................................................3
Question 1. Analyzing financial performance of Bank of Sydney..............................................3
Question 2 Assessment of the financial health and performance of Bradley stores....................5
Question 3 Bond valuation..........................................................................................................5
1. Finding yield to maturity of Horsham Industries bond...........................................................5
2. Stating the coupon yield of bond over the next years.............................................................5
3. Value of bond when risk class is 6.2%....................................................................................5
4. Assessing whether required rate of return such as 6.2% is suitable from investment purpose
.....................................................................................................................................................6
5. Finding the value of gain or loss in monetary terms...............................................................6
Question 4....................................................................................................................................8
1...................................................................................................................................................8
2...................................................................................................................................................8
3...................................................................................................................................................8
4.................................................................................................................................................10
Question 5 Portfolio evaluation.................................................................................................10
1. Calculating expected rate of return using probabilistic approach.........................................10
2. Finding standard deviations of the estimated rate of returns.................................................10
3. Assessing better measurement for the valuation of risk........................................................11
4. Identifying expected rate of return on the basis of beta.........................................................11
5. Portfolio beta and ERR..........................................................................................................11
6. Assessing beta of portfolio and ERR in the case of varied investment.................................12
7. Stating the portfolio which firm should prefer......................................................................12
Question 6 Evaluating the viability of proposed investment.....................................................13
Document Page
1. Computing payback period and NPV....................................................................................13
3. Calculating IRR.....................................................................................................................14
4. Profitability index..................................................................................................................14
5. Recommendations..................................................................................................................15
6 and 7 Recommending project when NPV is 15%..................................................................15
8. Assessing NPV when WACC is 25%....................................................................................15
9. assessing the factors need to consider while making selection of project.............................16
CONCLUSION..............................................................................................................................16
REFERENCES..............................................................................................................................17
Document Page
INTRODUCTION
In business, owner is required to take suitable decision that aid in the profit margin and
growth aspect of firm. The present report is based on different case situations which will shed
light on the concepts of bond or share valuation. Besides this, it will also develop understanding
regarding the concept of investment appraisal.
Question 1. Analyzing financial performance of Bank of Sydney
Ratio analysis
Profitability ratios
Particulars Formula Figures
Gross profit 50000
Net profit 6000
Net sales 300000
GP ratio
GP / net sales *
100 17%
NP ratio
NP / Net sales *
100 2%
Liquidity ratio analysis
Particulars Formula Figures Industry standard Performance level
Current assets 65000
Inventory 40000
Current liabilities 35000
Current ratio
Current assets /
current liabilities 1.86
2:1 Sound
Quick ratio
(current assets -
Inventory) /
current liabilities 0.71
.5:1 Sound
tabler-icon-diamond-filled.svg

Paraphrase This Document

Need a fresh take? Get an instant paraphrase of this document with our AI Paraphraser
Document Page
Activity ratios
Particulars Formula Figures
Inventory 40000
Accounts receivable 20000
Accounts payable 15000
COGS 250000
Sales 300000
Purchases 210000
Inventory turnover ratio COGS / inventory 6.25 times
Accounts receivable turnover
ratio Total credit sales / accounts receivable 15 times
Accounts payable ratio total purchase / accounts payable
14.00
times
Solvency or debt-equity ratios
Particulars Formula
Figure
s
Industry
standar
d
Performanc
e level
Long term debt 100000
Shareholders’
equity 65000
Debt-equity ratio Debt / equity 1.53
.5:1 Very high
as
compared
to ideal
ratio
Market ratios
Particulars Formula
Figure
s
Total dividends 900
Net income 30000
Outstanding shares 10000
Earnings per share (Net income - preferred dividend) / average outstanding 2.91
Document Page
shares
Dividend payout
ratio Total dividends / net income 0.03
Question 2 Assessment of the financial health and performance of Bradley stores
a.
Liquidity ratios
Particulars Figures
Current ratio 1.5 times
Quick ratio 1.25 times
Outcome of ratio analysis presents that liquidity position and performance of Bradley
store is sound. Standard current and quick ratio is 2:1 & .5:1 respectively. Thus, it can be stated
that quick ratio of store is very high. On the basis of this aspect, it is recommended to the firm
start making investment which in turn helps it in attaining higher profit margin.
b.
Activity ratios
Particulars Figures
Average collection period 30 days
Inventory turnover ratio 12
Average payment period 20 days
Fixed assets turnover ratio 1.8
Total assets turnover ratio 1.4
Return on assets 9%
The above depicted table presents that business entity of Bradley store receives money
later and payment is made by it earlier. Hence, for ensuing proper balance in working capital
business entity is required to revise credit policy. Further, fixed and total asset turnover ratio of
the firm is neither too high nor too lower. Thus, firm is required to encourage their personnel for
making best efforts and making optimum use from assets.
Document Page
c.
Solvency ratio
Particulars Figures
Debt-equity ratio 50% or .5:1
Ratio analysis presents that debt-equity ratio is .5:1 which is equal to ideal ratio. Hence, it
can be stated that capital structure of Bradley store is highly balanced and optimal.
d.
Profitability ratios
Particulars Figures
Net profit margin 6.4%
Return on equity 18%
NP margin of Bradley store accounts for 6.4 % which is higher. Hence, firm needs to
make control on direct and indirect expense level. By doing this, profit can be enhanced by firm
to a great extent. Further, Bradley needs to make modifications in the current strategic and policy
framework. This in turn helps in making optimum use from shareholder’s equity.
e.
From evaluation, it has been assessed that financial position of Bradley store is good at
marketplace in against to industry average. However, company needs to make efforts in relation
to maximizing profit margin and reducing the level of expense.
f.
It is recommended to the owner to approve loan by taking into account the liquidity
position and profitability aspect of firm. Hence, owner should make focus on the approval of
loan for companies whose position is in line with the industry average.
Question 3 Bond valuation
1. Finding yield to maturity of Horsham Industries bond
Particulars Figures
Face value $100
tabler-icon-diamond-filled.svg

Paraphrase This Document

Need a fresh take? Get an instant paraphrase of this document with our AI Paraphraser
Document Page
Annual coupon rate 5.550%
Years to maturity (from 2008 to 2037) 31 years
Coupon payments per year 2
Current bond price $96.12
Yield to maturity 5.82%
2. Stating the coupon yield of bond over the next years
Coupon yield of this bond will fluctuate over the years according to high low range.
Hence, by considering such aspect it can be said that value of yield will increase in the near
future because it comes under the category of Aa3 (Fraser, Bhaumik and Wright, 2015).
3. Value of bond when risk class is 6.2%
Year
Cash
flow
PV factor
@ 6.2%
Discounte
d cash
flow
1 5.55 0.942 5.23
2 5.55 0.887 4.92
3 5.55 0.835 4.63
4 5.55 0.786 4.36
5 5.55 0.740 4.11
6 5.55 0.697 3.87
7 5.55 0.656 3.64
8 5.55 0.618 3.43
9 5.55 0.582 3.23
10 5.55 0.548 3.04
11 5.55 0.516 2.86
12 5.55 0.486 2.70
13 5.55 0.457 2.54
14 5.55 0.431 2.39
15 5.55 0.406 2.25
16 5.55 0.382 2.12
17 5.55 0.360 2.00
18 5.55 0.339 1.88
19 5.55 0.319 1.77
20 5.55 0.300 1.67
21 5.55 0.283 1.57
Document Page
22 5.55 0.266 1.48
23 5.55 0.251 1.39
24 5.55 0.236 1.31
25 5.55 0.222 1.23
26 5.55 0.209 1.16
27 5.55 0.197 1.09
28 5.55 0.186 1.03
29 5.55 0.175 0.97
30 5.55 0.165 0.91
31 5.55 0.155 0.86
32 5.55 0.146 0.81
33 5.55 0.137 0.76
34 5.55 0.129 0.72
35 5.55 0.122 0.68
36 5.55 0.115 0.64
37 105.55 0.108 11.40
Bond value 90.65
4. Assessing whether required rate of return such as 6.2% is suitable from investment purpose
Value of bond will decrease to the significant level such as $90.65 if required rate of
return increases. Thus, business unit should avoid making investment in the bond of Horsham
Industries.
5. Finding the value of gain or loss in monetary terms
Year
Cash
flow
PV
factor
@
6.2%
Discounte
d cash
flow
1 6 0.942 5.65
2 6 0.887 5.32
3 6 0.835 5.01
4 6 0.786 4.72
5 6 0.740 4.44
6 6 0.697 4.18
7 6 0.656 3.94
8 6 0.618 3.71
9 6 0.582 3.49
10 6 0.548 3.29
Document Page
11 6 0.516 3.10
12 6 0.486 2.92
13 6 0.457 2.74
14 6 0.431 2.58
15 6 0.406 2.43
16 6 0.382 2.29
17 6 0.360 2.16
18 6 0.339 2.03
19 6 0.319 1.91
20 6 0.300 1.80
21 6 0.283 1.70
22 6 0.266 1.60
23 6 0.251 1.50
24 6 0.236 1.42
25 6 0.222 1.33
26 6 0.209 1.26
27 6 0.197 1.18
28 6 0.186 1.11
29 6 0.175 1.05
30 6 0.165 0.99
31 6 0.155 0.93
32 6 0.146 0.88
33 6 0.137 0.82
34 6 0.129 0.78
35 6 0.122 0.73
36 6 0.115 0.69
37 106 0.108 11.45
Bond value 97.12
In comparison to par value such as 100, investor will suffer loss of $3. However, such
bond purchased by the company @ $96.124 and today’s bond value is 97.12. This aspect shows
the gain of $.99. Hence, by considering the overall scenario or situation it can be stated that
investor will earn profit by investing money in such bonds.
Question 4
1.
If business unit such as Wild Rydes Pty Ltd will offer 100% earnings in the form of
dividend then it may result into high decline in share value such as near to zero. Moreover, when
tabler-icon-diamond-filled.svg

Paraphrase This Document

Need a fresh take? Get an instant paraphrase of this document with our AI Paraphraser
Document Page
business unit does not have fund for making investment in other profitable opportunities then it
may result into decline in share price or image.
2.
Earning method of share valuation
Particulars
Figure
s
Income 300000
Pay-out ratio 30% 90000
Net income 210000
Shares in number 50000
EPS 4.2
Price per share 450
price earnings ratio
107.14
3
Value of share 450
3.
Dividend growth method of share valuation:
Given that
Particulars Figures
Dividend per share 1.5
K or payout ratio 12%%
Document Page
G1 50%
G2 20%
G3 20%
Gn 9%
Dividen
d
Figur
es
D1 1.5
D2 2.25
D3 1.8
D4 1.8
D5 1.64
Working note: Value of 5th year
= 1.64 / (.30 - .09)
= $7.79
S. No. Value of dividend
Payout
ratio
or PV
factor
@
30%
Discounted
amount
1 1.5 0.893 1.34
chevron_up_icon
1 out of 20
circle_padding
hide_on_mobile
zoom_out_icon
[object Object]