Financial Management and Control: Zurich Plc Performance and Appraisal
VerifiedAdded on 2024/06/05
|16
|3411
|471
Report
AI Summary
This report provides a comprehensive financial analysis of Zurich Plc, evaluating its performance in terms of profitability, liquidity, gearing, asset utilization, and investment potential for the years 2015 and 2016. It employs ratio analysis to assess the company's financial health, highlighting areas of concern such as declining profitability and an unoptimal capital structure. The report also critically evaluates the limitations of ratio analysis in decision-making. Furthermore, it assesses the economic feasibility of acquiring a machine using investment appraisal techniques, including payback period, discounted payback period, accounting rate of return, net present value, and internal rate of return, recommending the acquisition based on positive NPV and favorable returns. Finally, it explores potential sources of finance for the investment, providing a holistic view of Zurich Plc's financial management and control. Desklib offers a wide range of solved assignments and study resources for students.

Financial Management and Control
1
1
Paraphrase This Document
Need a fresh take? Get an instant paraphrase of this document with our AI Paraphraser
Contents
Introduction:....................................................................................................................................3
Part A:..............................................................................................................................................4
1. Prepare a report for the Board of Zurich Plc. that evaluates the performance of the company
in relation to profitability, liquidity, gearing, asset utilization, and invest or potential...............4
2. Critically evaluate the limitations of ratio analysis for decision-making purposes as an
additional section within the report..............................................................................................8
Part B:..............................................................................................................................................9
1. Calculate using the following investment appraisal techniques, and provide
recommendations as to the economic feasibility of acquiring the machine:...............................9
2. Critically evaluate the key benefits and limitations of each of the differing investment
appraisal techniques, supporting the response with relevant academic research as to whether
each of the differing techniques is applied in practice within a real life business context........12
3. You are also required to critical evaluate the possible sources of finance to fund this
investment..................................................................................................................................14
Conclusion:....................................................................................................................................15
References:....................................................................................................................................16
2
Introduction:
The financial management and control report has been prepared in order to develop an
understanding of the user regarding the use of ratio analysis in evaluating the performance of the
company and also describing the utilization of capital budgeting techniques in taking financial
decisions for a company. The part A of the report will involve evaluation of the financial
performance and position of the company and recommending the necessary solutions. This will
also involve explanation of some of the limitation associated with using ratio analysis. The
second part of the report will consist of evaluating the investment option for a company while
calculating net present value, internal rate of return, accounting rate of return and payback period
for the given project. The various types of benefits along with the limitations of sing these
investment appraisal techniques will be discussed in this report. The last part will describe the
various sources of finances available for funding purposes.
3
⊘ This is a preview!⊘
Do you want full access?
Subscribe today to unlock all pages.
Trusted by 1+ million students worldwide
Part A:
1. Prepare a report for the Board of Zurich Plc. that evaluates the performance of the
company in relation to profitability, liquidity, gearing, asset utilization, and invest or
potential.
Introduction:
The report has been prepared to evaluate the performance of Zurich Plc. for the last two years
ending 2015 and 2016. For this purpose various ratios will be calculated for the company and
necessary recommendation will be made accordingly.
Ratio Analysis:
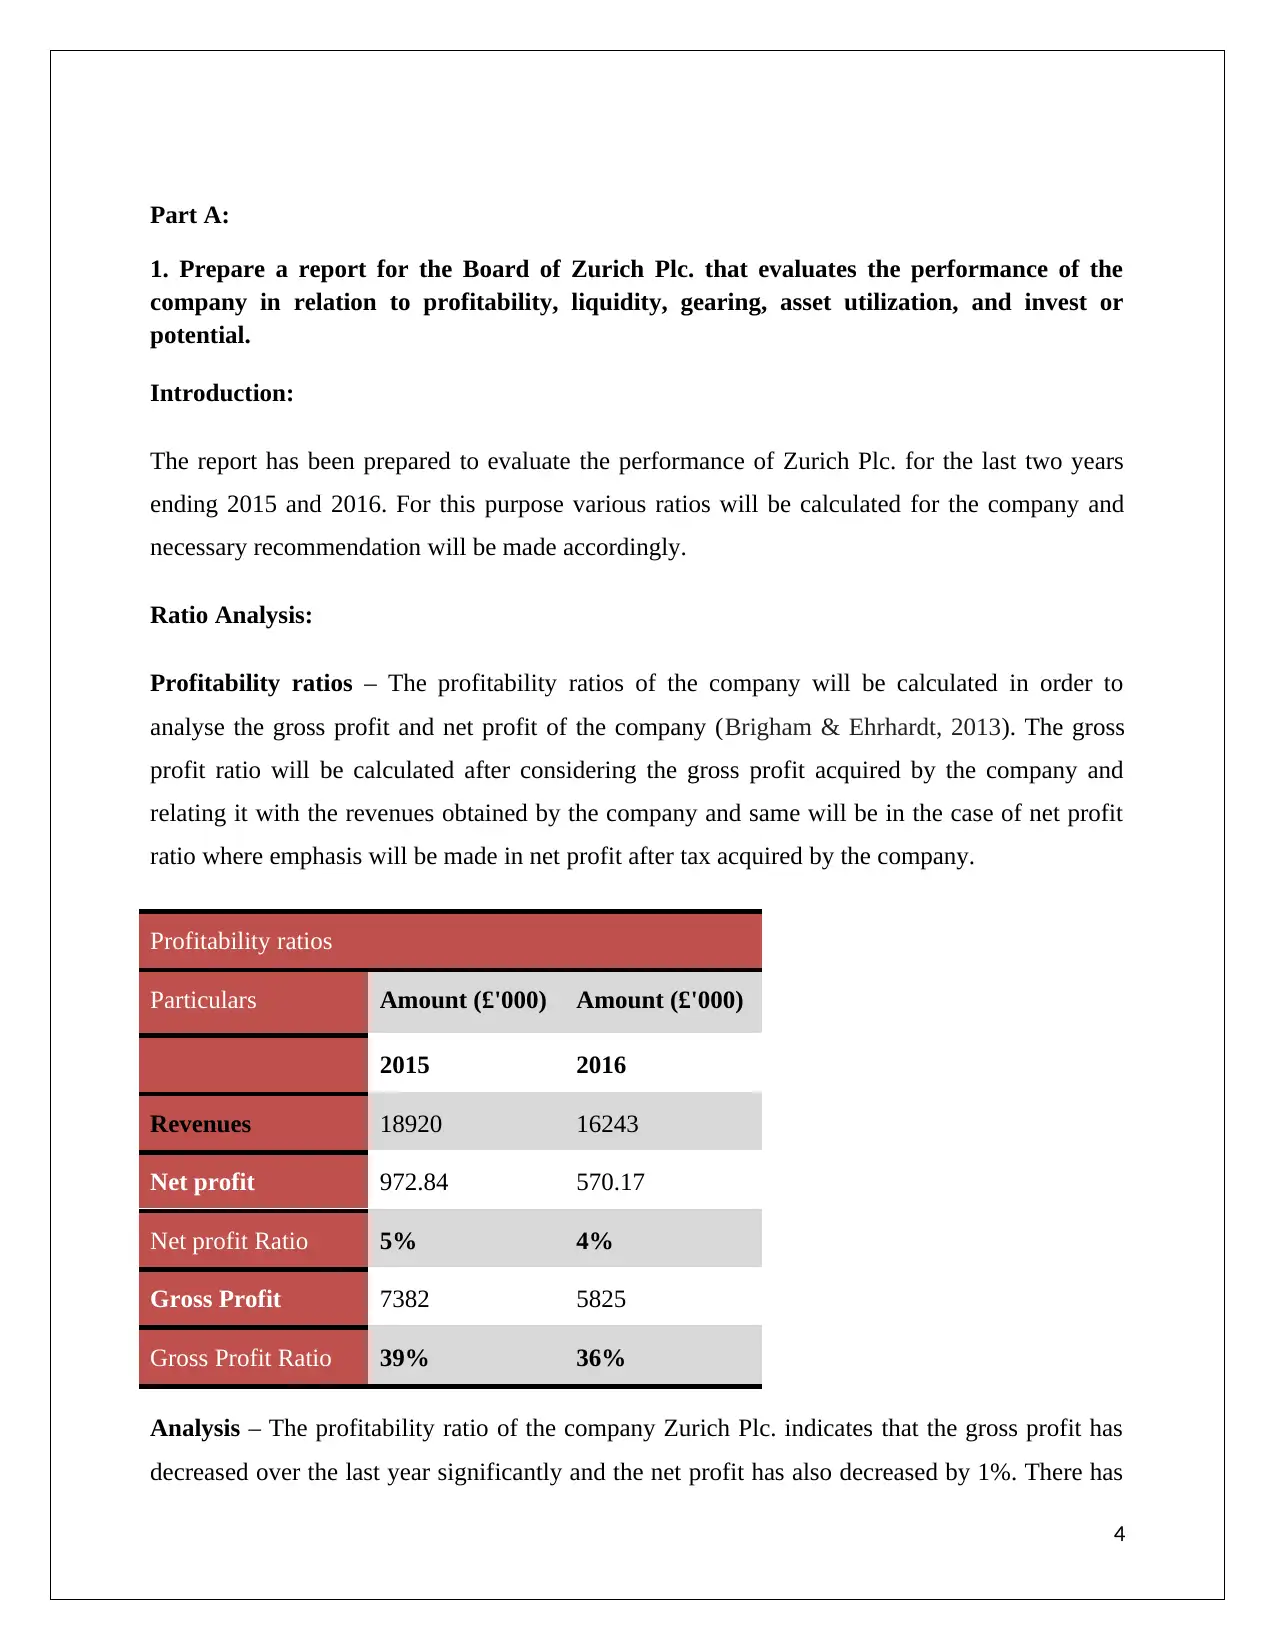
Profitability ratios – The profitability ratios of the company will be calculated in order to
analyse the gross profit and net profit of the company (Brigham & Ehrhardt, 2013). The gross
profit ratio will be calculated after considering the gross profit acquired by the company and
relating it with the revenues obtained by the company and same will be in the case of net profit
ratio where emphasis will be made in net profit after tax acquired by the company.
Profitability ratios
Particulars Amount (£'000) Amount (£'000)
2015 2016
Revenues 18920 16243
Net profit 972.84 570.17
Net profit Ratio 5% 4%
Gross Profit 7382 5825
Gross Profit Ratio 39% 36%
Analysis – The profitability ratio of the company Zurich Plc. indicates that the gross profit has
decreased over the last year significantly and the net profit has also decreased by 1%. There has
4
1. Prepare a report for the Board of Zurich Plc. that evaluates the performance of the
company in relation to profitability, liquidity, gearing, asset utilization, and invest or
potential.
Introduction:
The report has been prepared to evaluate the performance of Zurich Plc. for the last two years
ending 2015 and 2016. For this purpose various ratios will be calculated for the company and
necessary recommendation will be made accordingly.
Ratio Analysis:
Profitability ratios – The profitability ratios of the company will be calculated in order to
analyse the gross profit and net profit of the company (Brigham & Ehrhardt, 2013). The gross
profit ratio will be calculated after considering the gross profit acquired by the company and
relating it with the revenues obtained by the company and same will be in the case of net profit
ratio where emphasis will be made in net profit after tax acquired by the company.
Profitability ratios
Particulars Amount (£'000) Amount (£'000)
2015 2016
Revenues 18920 16243
Net profit 972.84 570.17
Net profit Ratio 5% 4%
Gross Profit 7382 5825
Gross Profit Ratio 39% 36%
Analysis – The profitability ratio of the company Zurich Plc. indicates that the gross profit has
decreased over the last year significantly and the net profit has also decreased by 1%. There has
4
Paraphrase This Document
Need a fresh take? Get an instant paraphrase of this document with our AI Paraphraser
been significant amount of operating expenses incurred by the company which is affecting the
long term profitability of the company. The gross profit for the year 2015 was 39% which
decreased significantly to 36% in the year 2016.
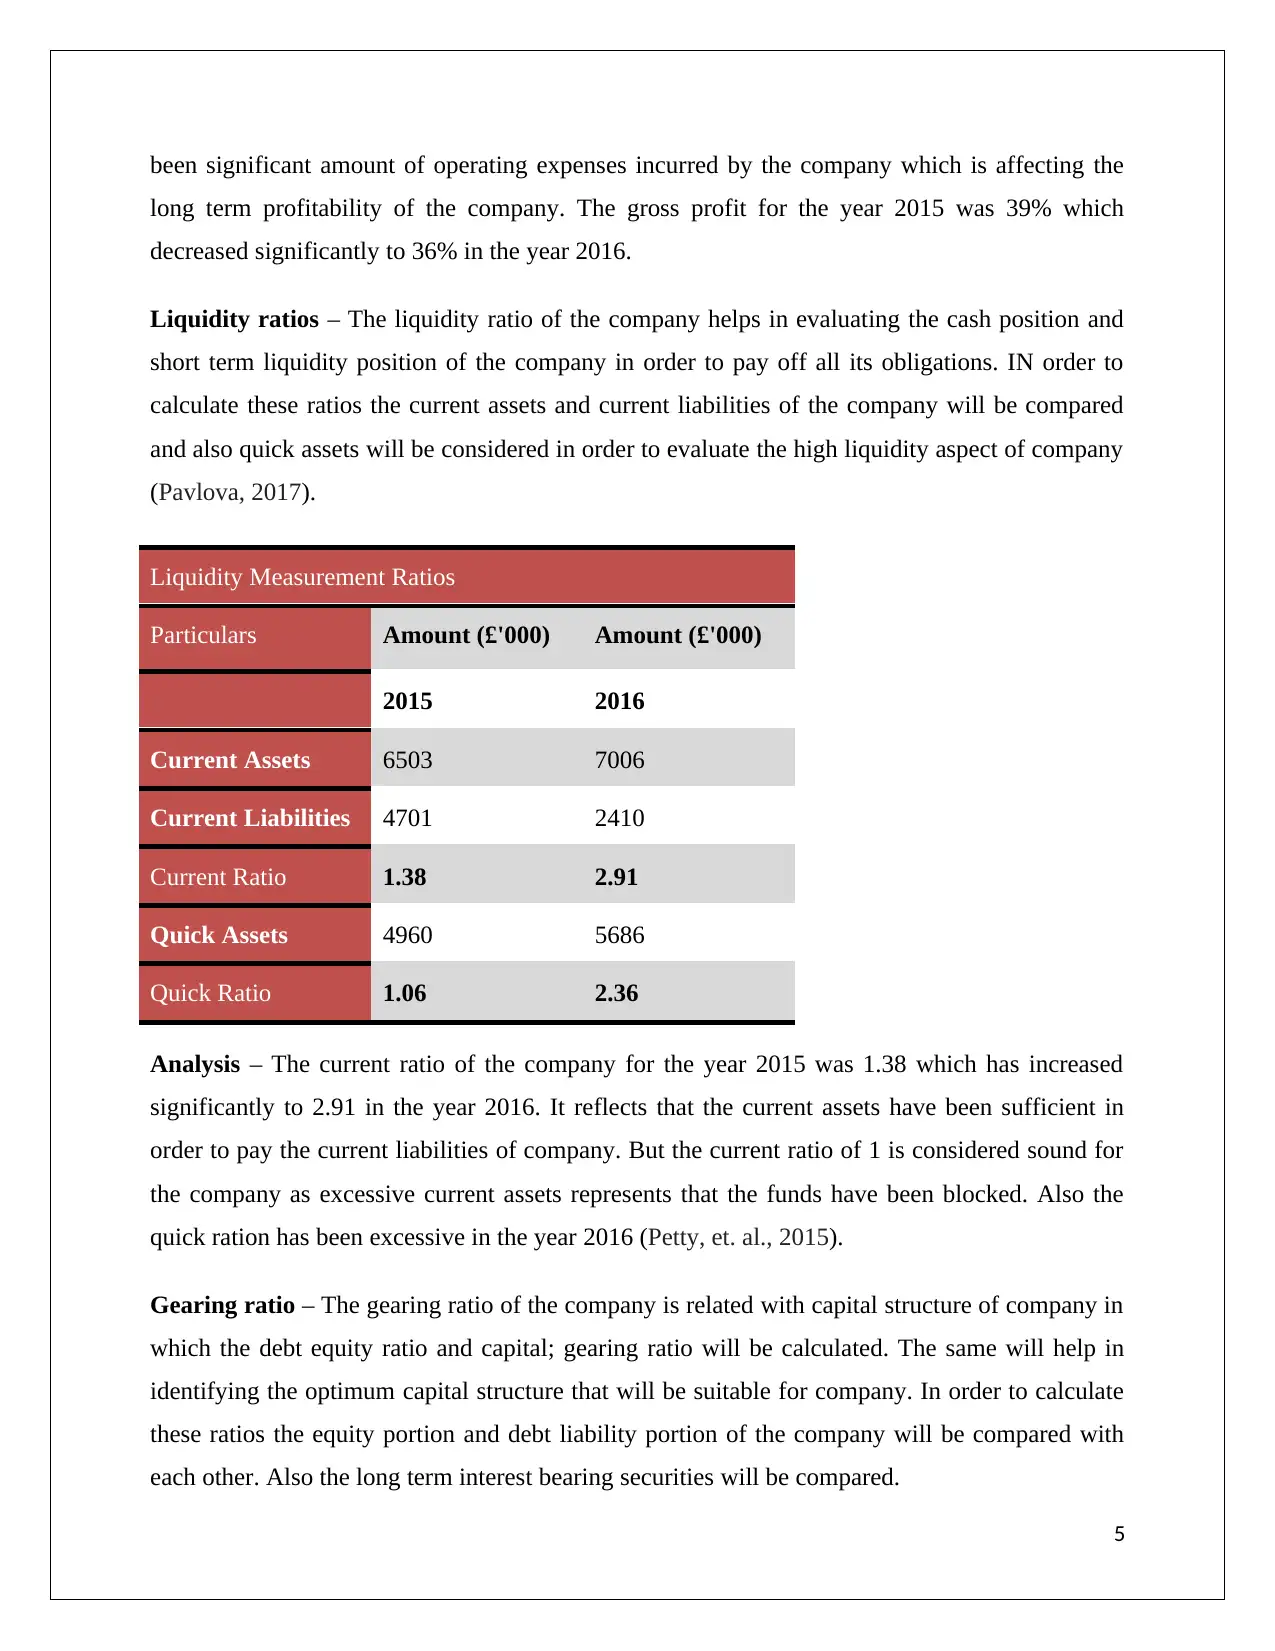
Liquidity ratios – The liquidity ratio of the company helps in evaluating the cash position and
short term liquidity position of the company in order to pay off all its obligations. IN order to
calculate these ratios the current assets and current liabilities of the company will be compared
and also quick assets will be considered in order to evaluate the high liquidity aspect of company
(Pavlova, 2017).
Liquidity Measurement Ratios
Particulars Amount (£'000) Amount (£'000)
2015 2016
Current Assets 6503 7006
Current Liabilities 4701 2410
Current Ratio 1.38 2.91
Quick Assets 4960 5686
Quick Ratio 1.06 2.36
Analysis – The current ratio of the company for the year 2015 was 1.38 which has increased
significantly to 2.91 in the year 2016. It reflects that the current assets have been sufficient in
order to pay the current liabilities of company. But the current ratio of 1 is considered sound for
the company as excessive current assets represents that the funds have been blocked. Also the
quick ration has been excessive in the year 2016 (Petty, et. al., 2015).
Gearing ratio – The gearing ratio of the company is related with capital structure of company in
which the debt equity ratio and capital; gearing ratio will be calculated. The same will help in
identifying the optimum capital structure that will be suitable for company. In order to calculate
these ratios the equity portion and debt liability portion of the company will be compared with
each other. Also the long term interest bearing securities will be compared.
5
long term profitability of the company. The gross profit for the year 2015 was 39% which
decreased significantly to 36% in the year 2016.
Liquidity ratios – The liquidity ratio of the company helps in evaluating the cash position and
short term liquidity position of the company in order to pay off all its obligations. IN order to
calculate these ratios the current assets and current liabilities of the company will be compared
and also quick assets will be considered in order to evaluate the high liquidity aspect of company
(Pavlova, 2017).
Liquidity Measurement Ratios
Particulars Amount (£'000) Amount (£'000)
2015 2016
Current Assets 6503 7006
Current Liabilities 4701 2410
Current Ratio 1.38 2.91
Quick Assets 4960 5686
Quick Ratio 1.06 2.36
Analysis – The current ratio of the company for the year 2015 was 1.38 which has increased
significantly to 2.91 in the year 2016. It reflects that the current assets have been sufficient in
order to pay the current liabilities of company. But the current ratio of 1 is considered sound for
the company as excessive current assets represents that the funds have been blocked. Also the
quick ration has been excessive in the year 2016 (Petty, et. al., 2015).
Gearing ratio – The gearing ratio of the company is related with capital structure of company in
which the debt equity ratio and capital; gearing ratio will be calculated. The same will help in
identifying the optimum capital structure that will be suitable for company. In order to calculate
these ratios the equity portion and debt liability portion of the company will be compared with
each other. Also the long term interest bearing securities will be compared.
5
Gearing ratio
Particulars Amount
(£'000)
Amount
(£'000)
2015 2016
Equity 20108 19635.16
Fixed Cost Bearing
Funds
7120 5292
Capital Gearing Ratio 2.82 3.71
Total Liabilities 11821 7702
Debt Equity Ratio 0.59 0.39
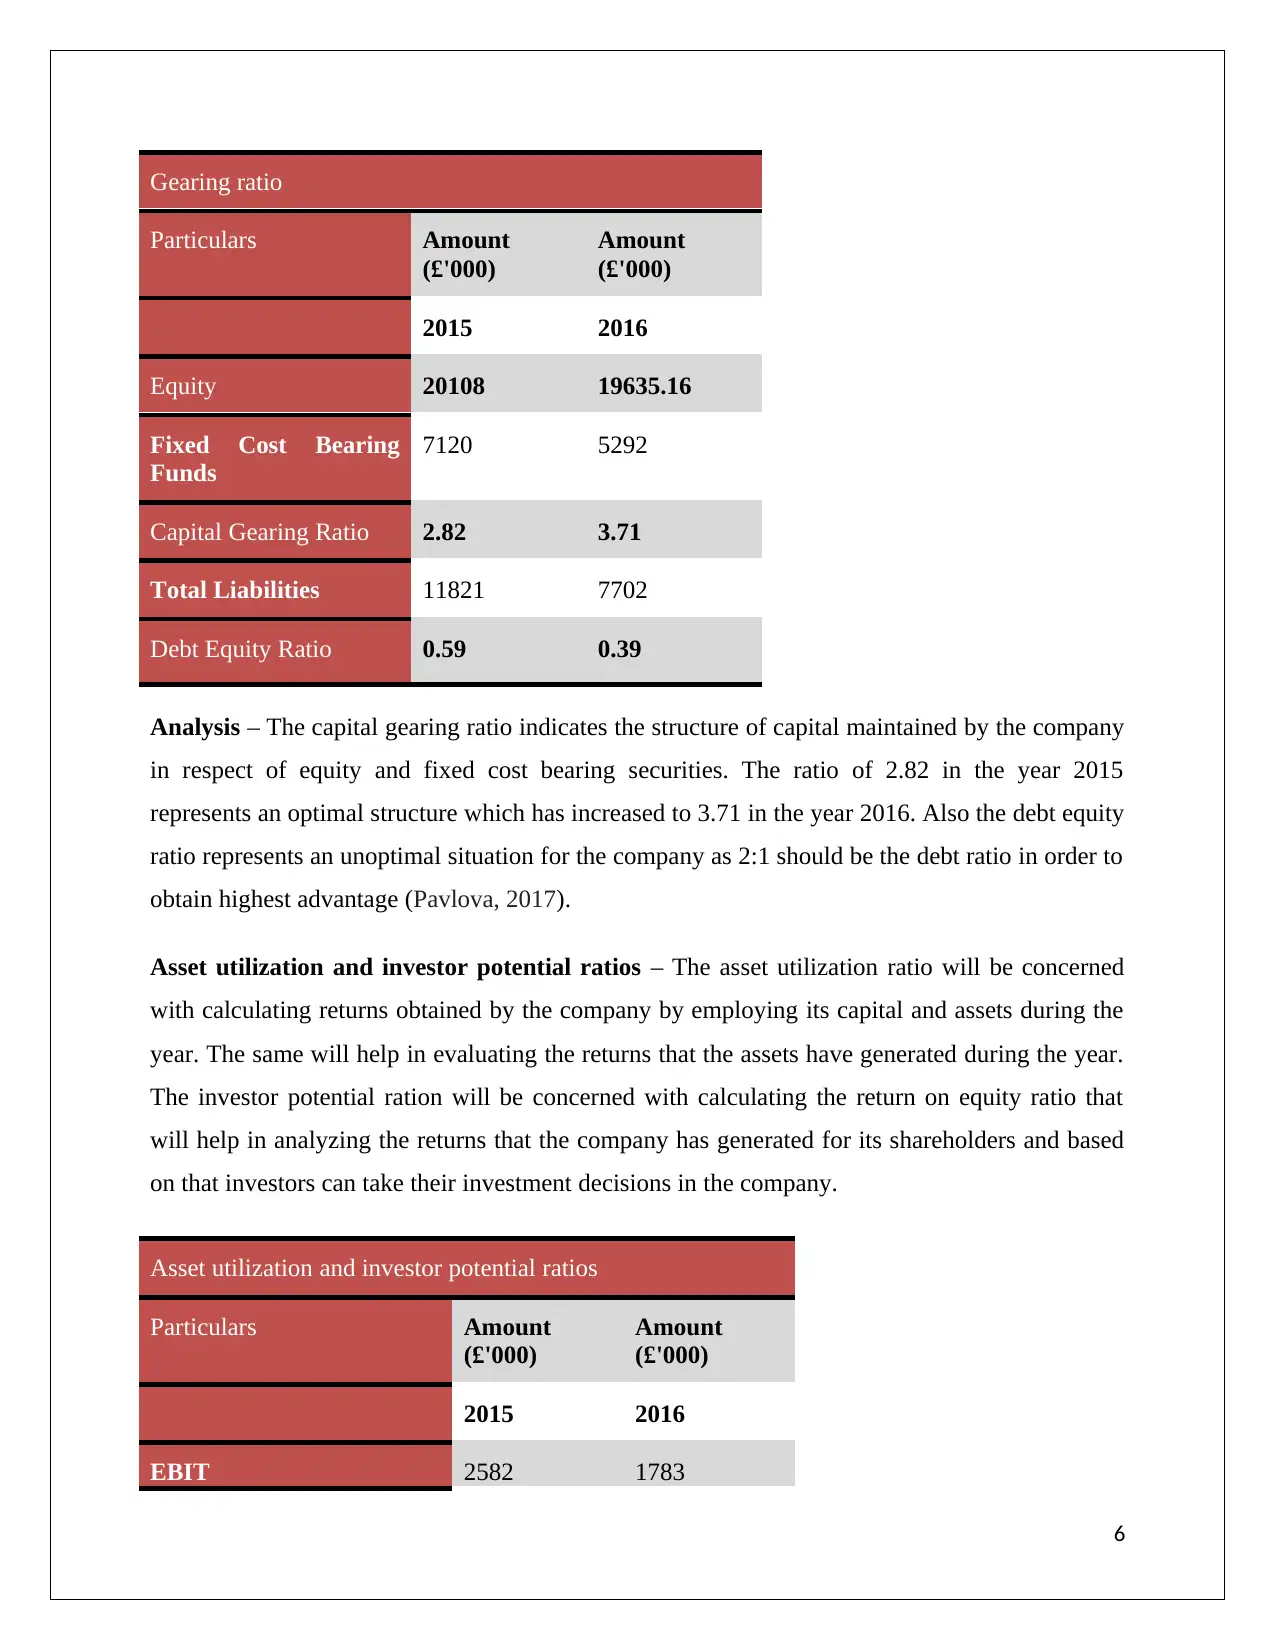
Analysis – The capital gearing ratio indicates the structure of capital maintained by the company
in respect of equity and fixed cost bearing securities. The ratio of 2.82 in the year 2015
represents an optimal structure which has increased to 3.71 in the year 2016. Also the debt equity
ratio represents an unoptimal situation for the company as 2:1 should be the debt ratio in order to
obtain highest advantage (Pavlova, 2017).
Asset utilization and investor potential ratios – The asset utilization ratio will be concerned
with calculating returns obtained by the company by employing its capital and assets during the
year. The same will help in evaluating the returns that the assets have generated during the year.
The investor potential ration will be concerned with calculating the return on equity ratio that
will help in analyzing the returns that the company has generated for its shareholders and based
on that investors can take their investment decisions in the company.
Asset utilization and investor potential ratios
Particulars Amount
(£'000)
Amount
(£'000)
2015 2016
EBIT 2582 1783
6
Particulars Amount
(£'000)
Amount
(£'000)
2015 2016
Equity 20108 19635.16
Fixed Cost Bearing
Funds
7120 5292
Capital Gearing Ratio 2.82 3.71
Total Liabilities 11821 7702
Debt Equity Ratio 0.59 0.39
Analysis – The capital gearing ratio indicates the structure of capital maintained by the company
in respect of equity and fixed cost bearing securities. The ratio of 2.82 in the year 2015
represents an optimal structure which has increased to 3.71 in the year 2016. Also the debt equity
ratio represents an unoptimal situation for the company as 2:1 should be the debt ratio in order to
obtain highest advantage (Pavlova, 2017).
Asset utilization and investor potential ratios – The asset utilization ratio will be concerned
with calculating returns obtained by the company by employing its capital and assets during the
year. The same will help in evaluating the returns that the assets have generated during the year.
The investor potential ration will be concerned with calculating the return on equity ratio that
will help in analyzing the returns that the company has generated for its shareholders and based
on that investors can take their investment decisions in the company.
Asset utilization and investor potential ratios
Particulars Amount
(£'000)
Amount
(£'000)
2015 2016
EBIT 2582 1783
6
⊘ This is a preview!⊘
Do you want full access?
Subscribe today to unlock all pages.
Trusted by 1+ million students worldwide
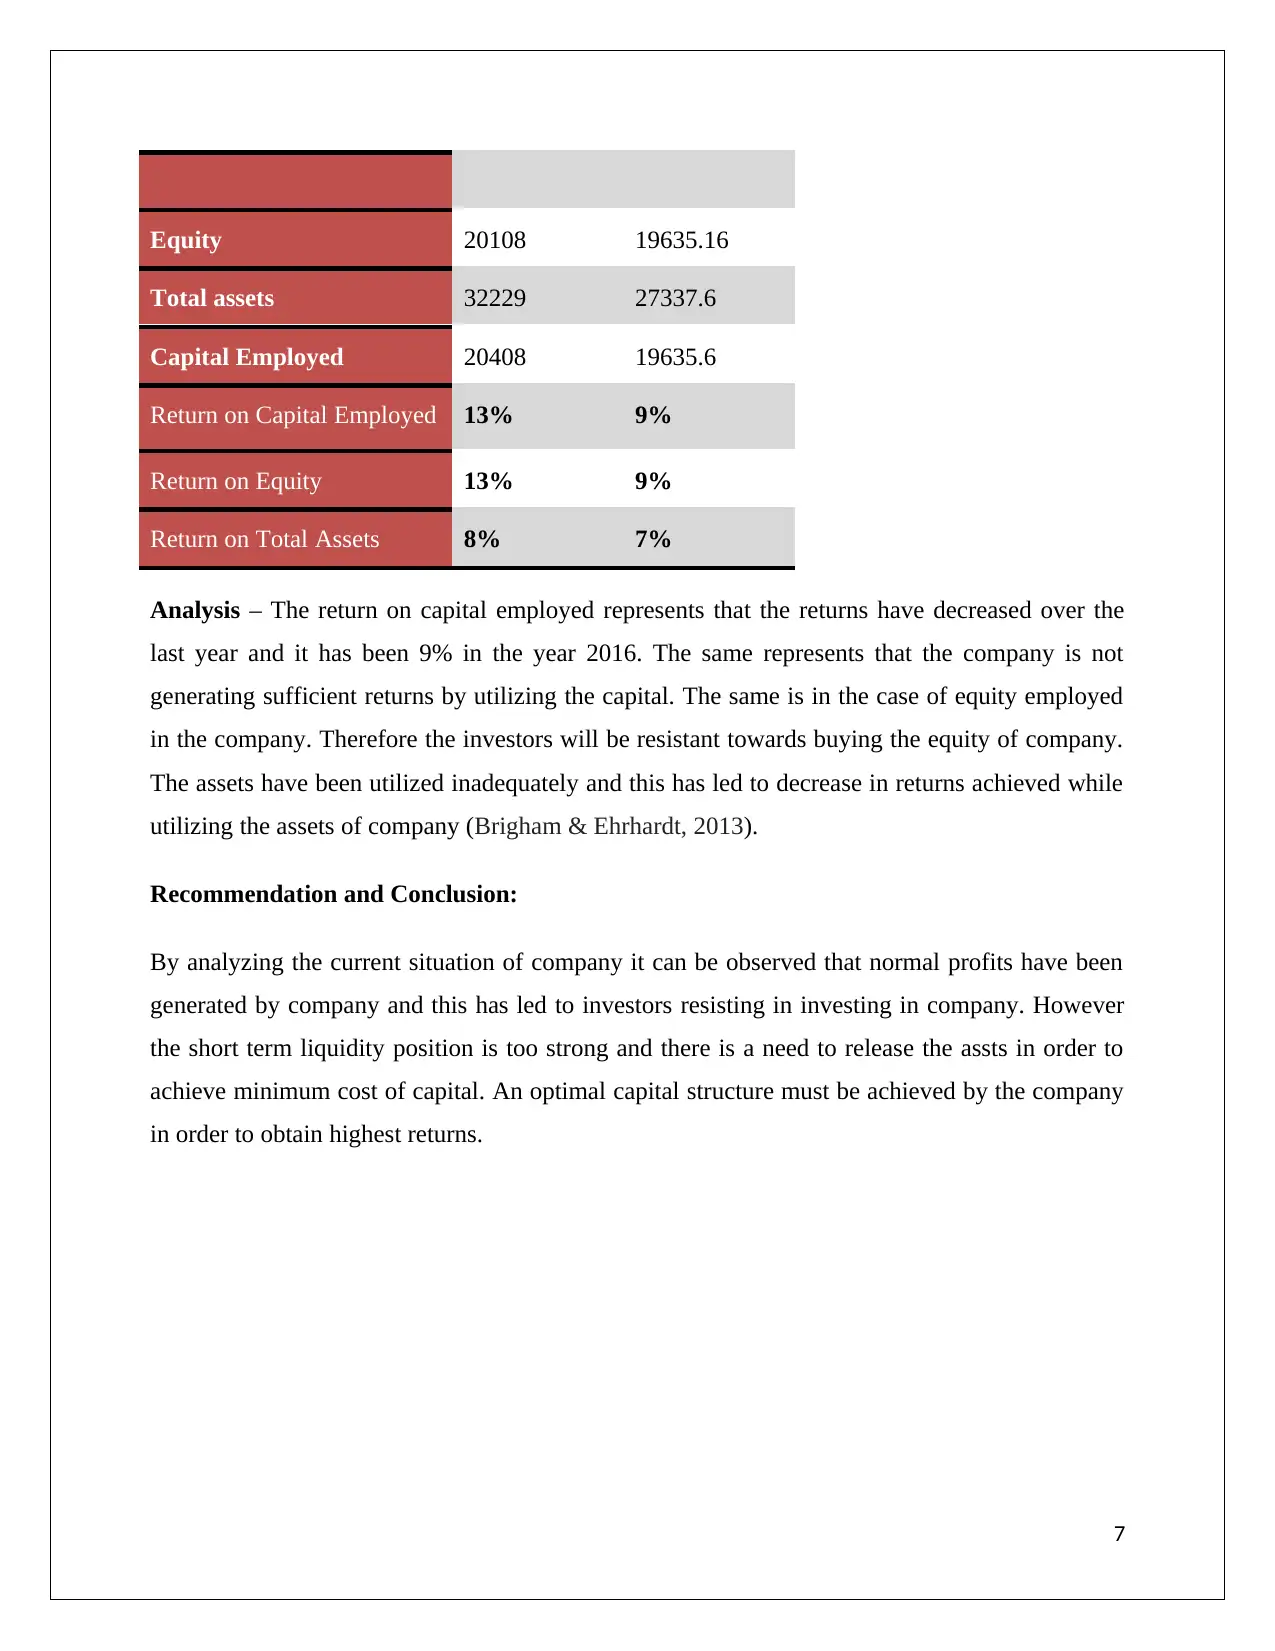
Equity 20108 19635.16
Total assets 32229 27337.6
Capital Employed 20408 19635.6
Return on Capital Employed 13% 9%
Return on Equity 13% 9%
Return on Total Assets 8% 7%
Analysis – The return on capital employed represents that the returns have decreased over the
last year and it has been 9% in the year 2016. The same represents that the company is not
generating sufficient returns by utilizing the capital. The same is in the case of equity employed
in the company. Therefore the investors will be resistant towards buying the equity of company.
The assets have been utilized inadequately and this has led to decrease in returns achieved while
utilizing the assets of company (Brigham & Ehrhardt, 2013).
Recommendation and Conclusion:
By analyzing the current situation of company it can be observed that normal profits have been
generated by company and this has led to investors resisting in investing in company. However
the short term liquidity position is too strong and there is a need to release the assts in order to
achieve minimum cost of capital. An optimal capital structure must be achieved by the company
in order to obtain highest returns.
7
Paraphrase This Document
Need a fresh take? Get an instant paraphrase of this document with our AI Paraphraser
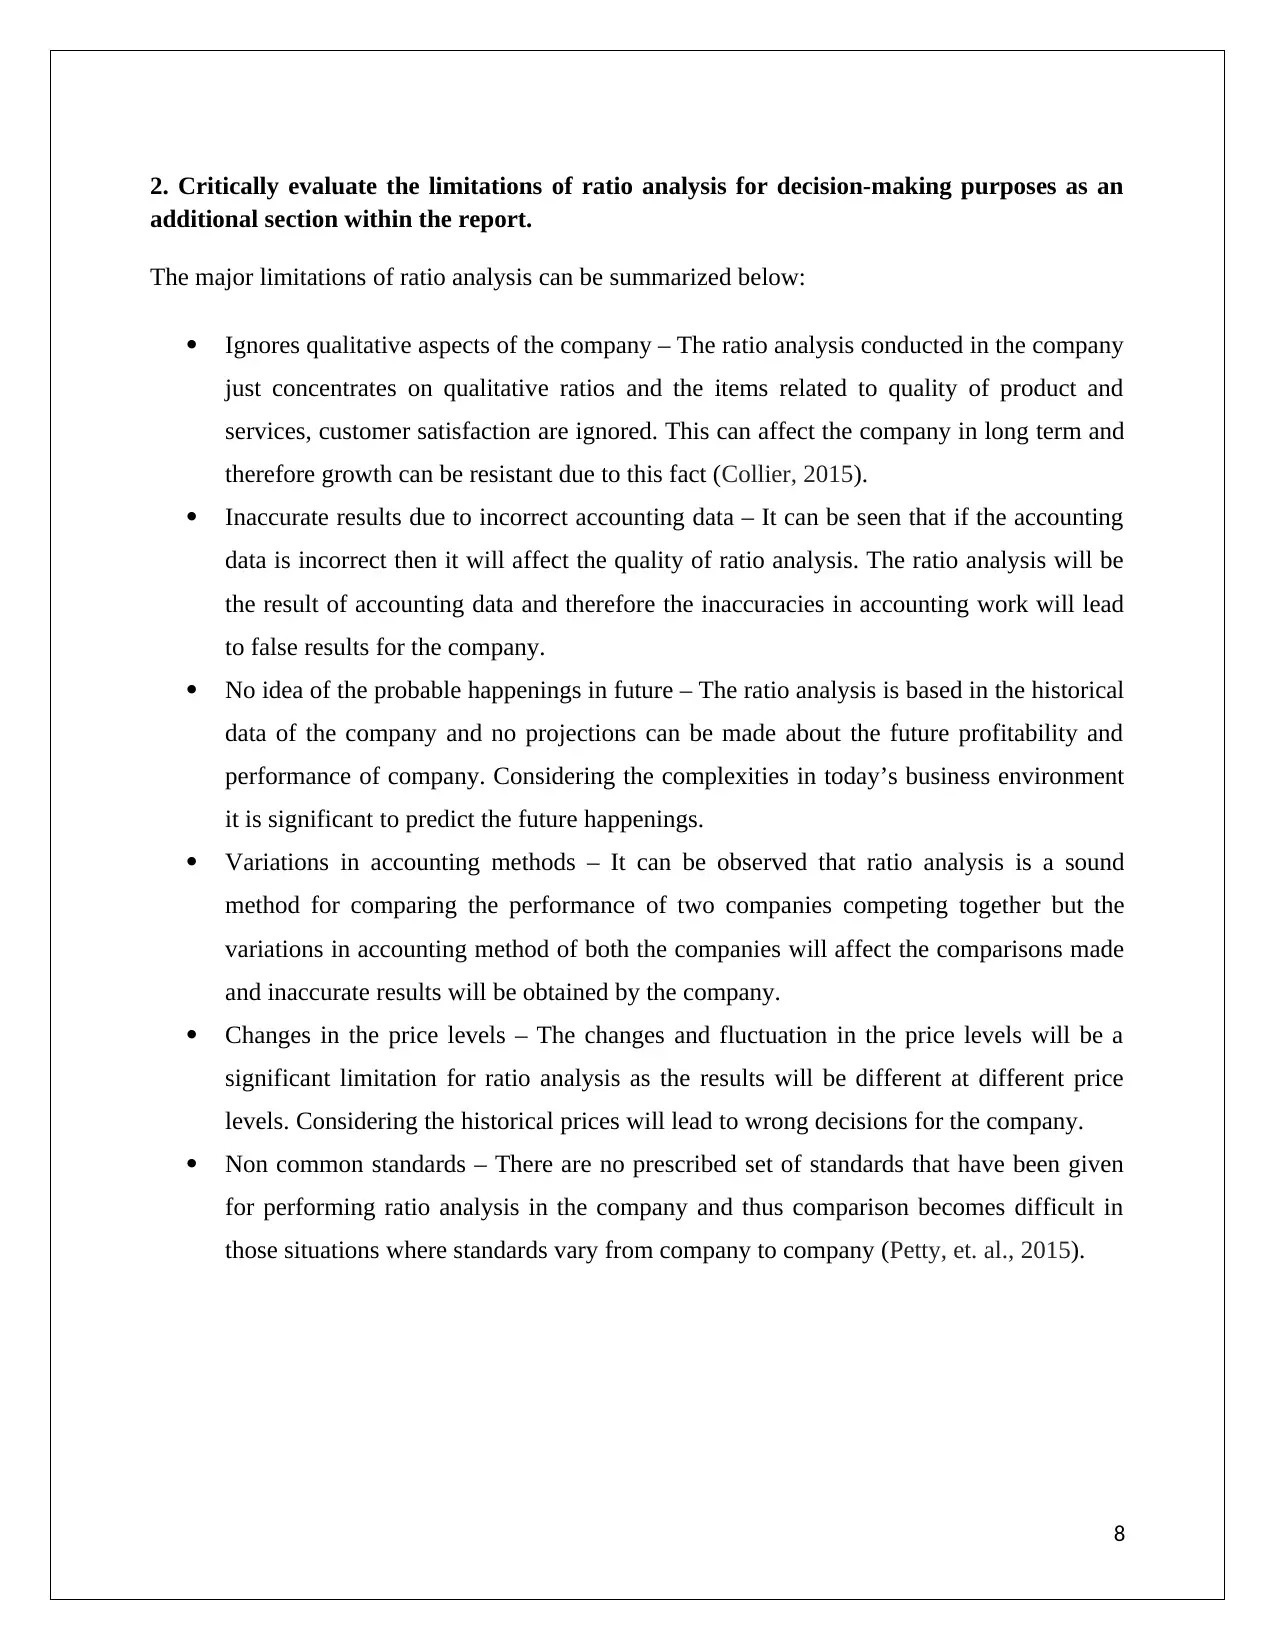
2. Critically evaluate the limitations of ratio analysis for decision-making purposes as an
additional section within the report.
The major limitations of ratio analysis can be summarized below:
Ignores qualitative aspects of the company – The ratio analysis conducted in the company
just concentrates on qualitative ratios and the items related to quality of product and
services, customer satisfaction are ignored. This can affect the company in long term and
therefore growth can be resistant due to this fact (Collier, 2015).
Inaccurate results due to incorrect accounting data – It can be seen that if the accounting
data is incorrect then it will affect the quality of ratio analysis. The ratio analysis will be
the result of accounting data and therefore the inaccuracies in accounting work will lead
to false results for the company.
No idea of the probable happenings in future – The ratio analysis is based in the historical
data of the company and no projections can be made about the future profitability and
performance of company. Considering the complexities in today’s business environment
it is significant to predict the future happenings.
Variations in accounting methods – It can be observed that ratio analysis is a sound
method for comparing the performance of two companies competing together but the
variations in accounting method of both the companies will affect the comparisons made
and inaccurate results will be obtained by the company.
Changes in the price levels – The changes and fluctuation in the price levels will be a
significant limitation for ratio analysis as the results will be different at different price
levels. Considering the historical prices will lead to wrong decisions for the company.
Non common standards – There are no prescribed set of standards that have been given
for performing ratio analysis in the company and thus comparison becomes difficult in
those situations where standards vary from company to company (Petty, et. al., 2015).
8
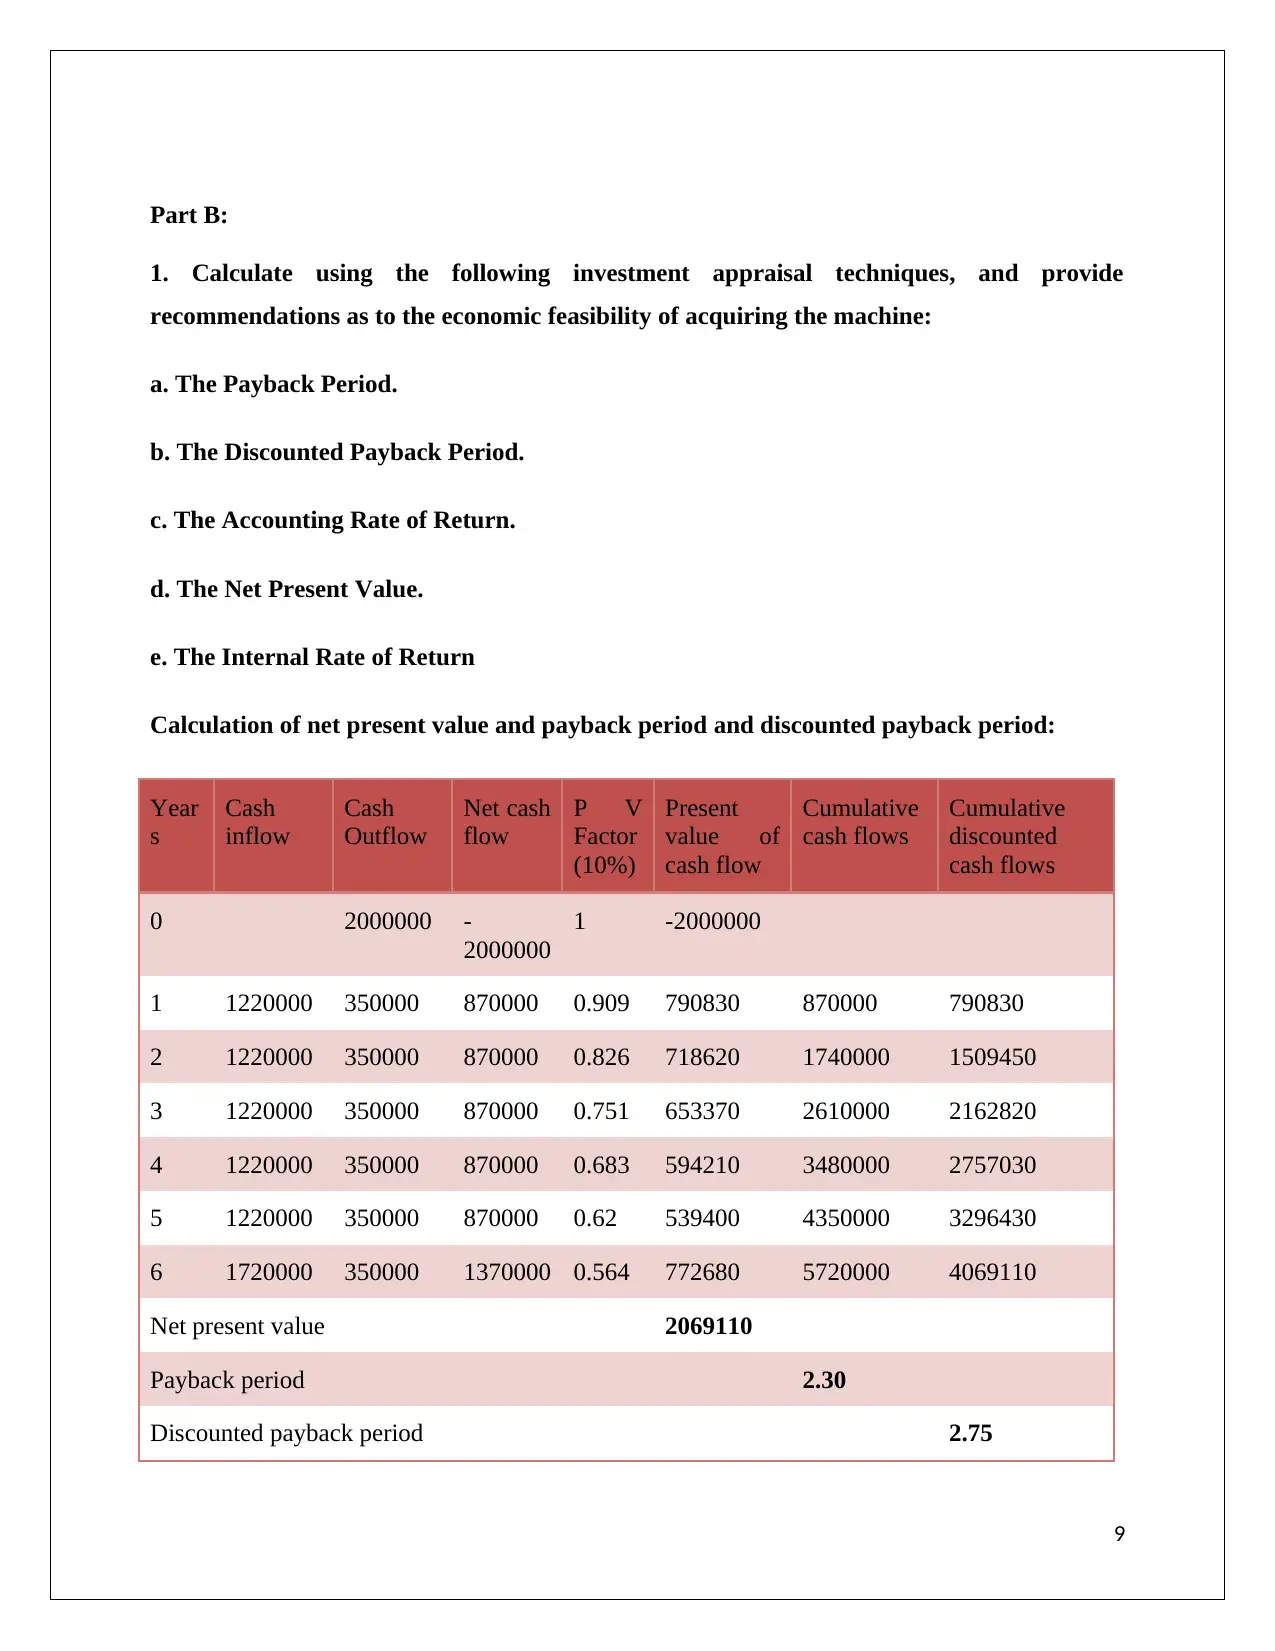
Part B:
1. Calculate using the following investment appraisal techniques, and provide
recommendations as to the economic feasibility of acquiring the machine:
a. The Payback Period.
b. The Discounted Payback Period.
c. The Accounting Rate of Return.
d. The Net Present Value.
e. The Internal Rate of Return
Calculation of net present value and payback period and discounted payback period:
Year
s
Cash
inflow
Cash
Outflow
Net cash
flow
P V
Factor
(10%)
Present
value of
cash flow
Cumulative
cash flows
Cumulative
discounted
cash flows
0 2000000 -
2000000
1 -2000000
1 1220000 350000 870000 0.909 790830 870000 790830
2 1220000 350000 870000 0.826 718620 1740000 1509450
3 1220000 350000 870000 0.751 653370 2610000 2162820
4 1220000 350000 870000 0.683 594210 3480000 2757030
5 1220000 350000 870000 0.62 539400 4350000 3296430
6 1720000 350000 1370000 0.564 772680 5720000 4069110
Net present value 2069110
Payback period 2.30
Discounted payback period 2.75
9
⊘ This is a preview!⊘
Do you want full access?
Subscribe today to unlock all pages.
Trusted by 1+ million students worldwide
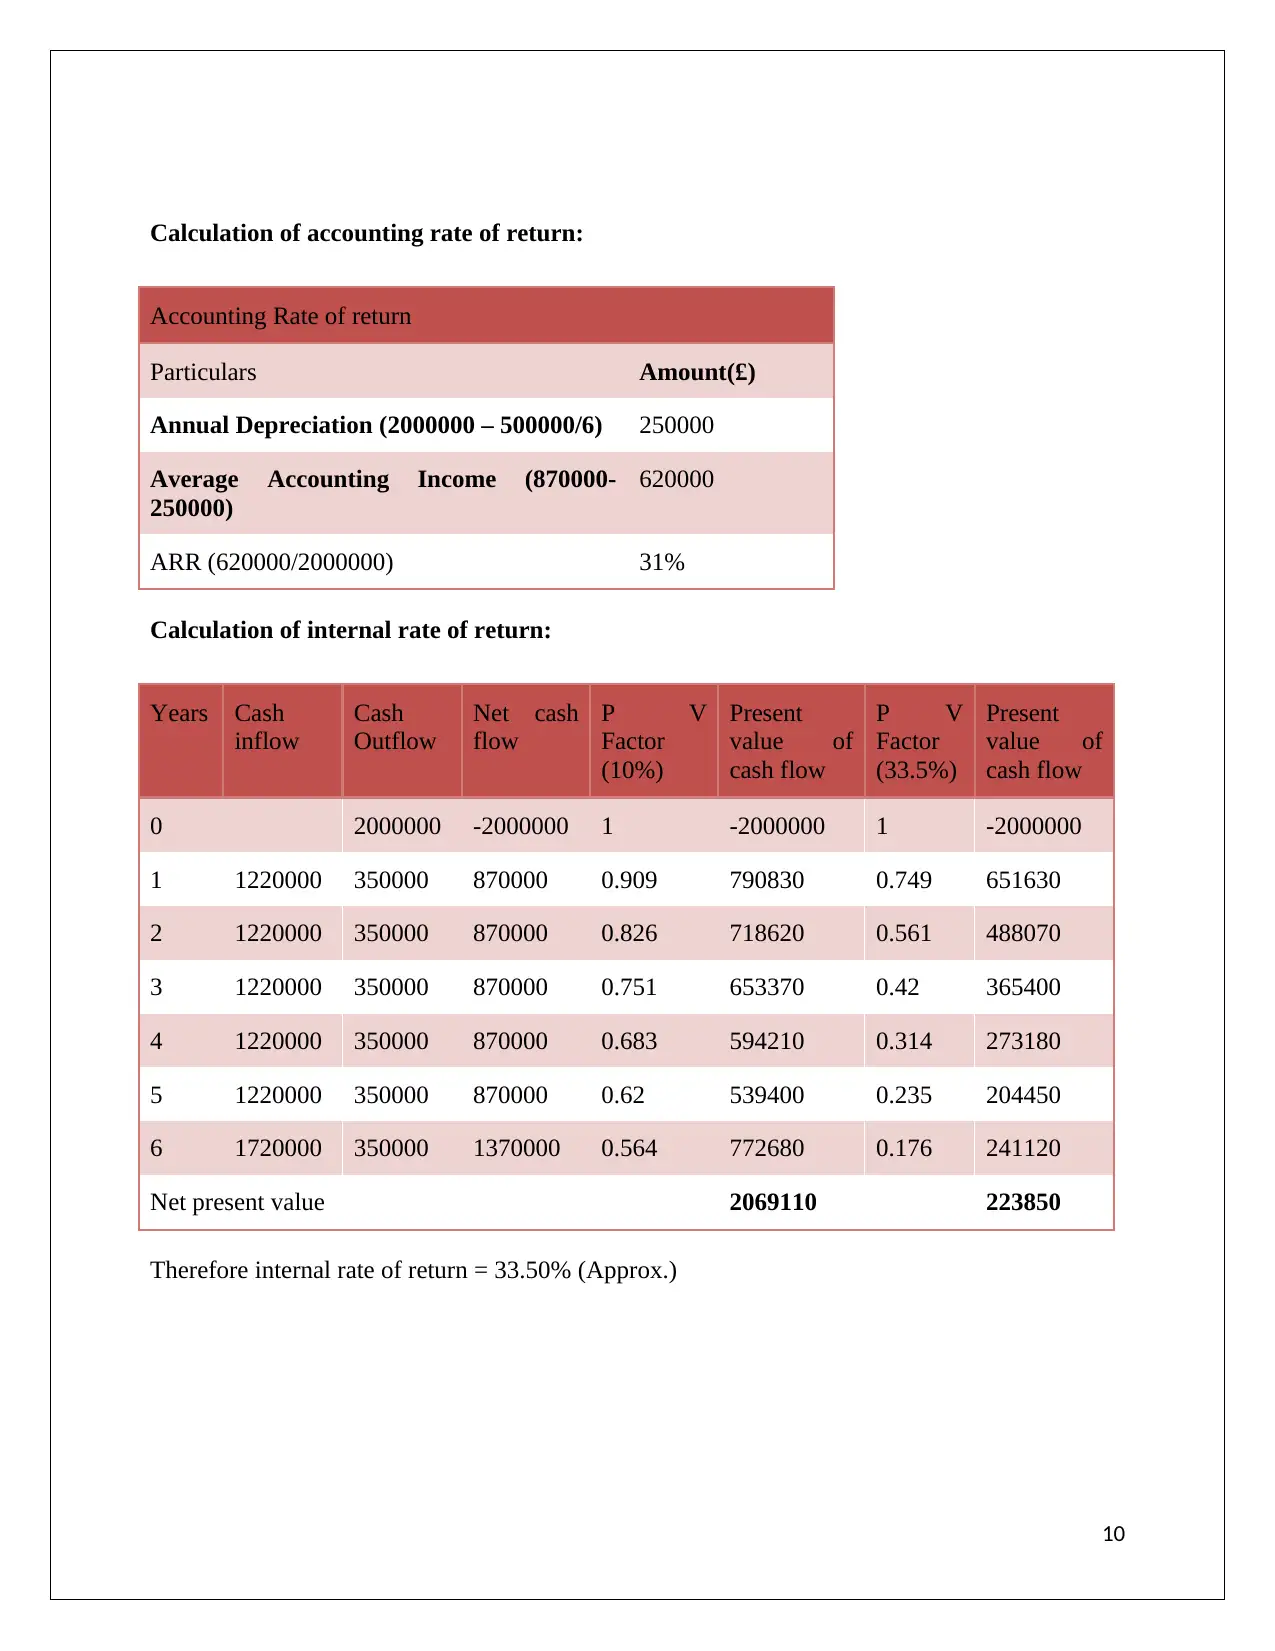
Calculation of accounting rate of return:
Accounting Rate of return
Particulars Amount(£)
Annual Depreciation (2000000 – 500000/6) 250000
Average Accounting Income (870000-
250000)
620000
ARR (620000/2000000) 31%
Calculation of internal rate of return:
Years Cash
inflow
Cash
Outflow
Net cash
flow
P V
Factor
(10%)
Present
value of
cash flow
P V
Factor
(33.5%)
Present
value of
cash flow
0 2000000 -2000000 1 -2000000 1 -2000000
1 1220000 350000 870000 0.909 790830 0.749 651630
2 1220000 350000 870000 0.826 718620 0.561 488070
3 1220000 350000 870000 0.751 653370 0.42 365400
4 1220000 350000 870000 0.683 594210 0.314 273180
5 1220000 350000 870000 0.62 539400 0.235 204450
6 1720000 350000 1370000 0.564 772680 0.176 241120
Net present value 2069110 223850
Therefore internal rate of return = 33.50% (Approx.)
10
Paraphrase This Document
Need a fresh take? Get an instant paraphrase of this document with our AI Paraphraser
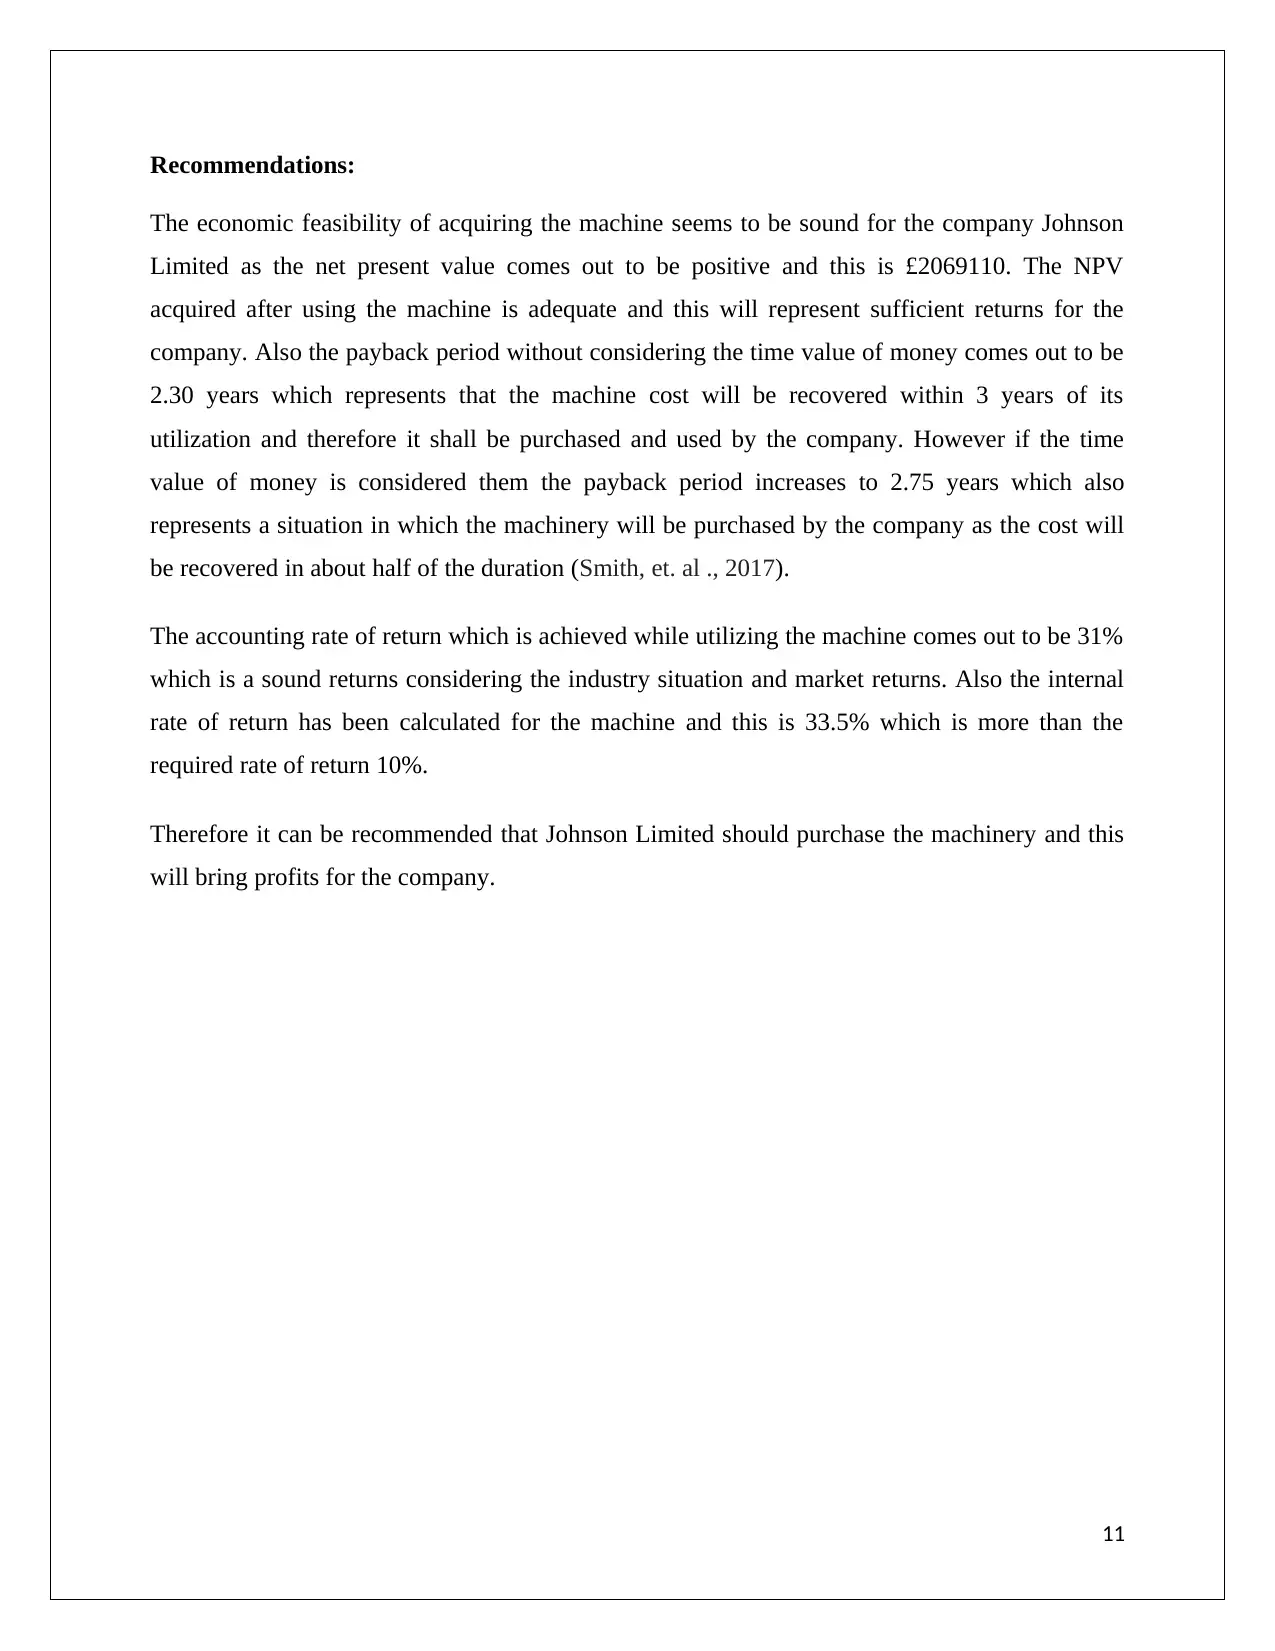
Recommendations:
The economic feasibility of acquiring the machine seems to be sound for the company Johnson
Limited as the net present value comes out to be positive and this is £2069110. The NPV
acquired after using the machine is adequate and this will represent sufficient returns for the
company. Also the payback period without considering the time value of money comes out to be
2.30 years which represents that the machine cost will be recovered within 3 years of its
utilization and therefore it shall be purchased and used by the company. However if the time
value of money is considered them the payback period increases to 2.75 years which also
represents a situation in which the machinery will be purchased by the company as the cost will
be recovered in about half of the duration (Smith, et. al ., 2017).
The accounting rate of return which is achieved while utilizing the machine comes out to be 31%
which is a sound returns considering the industry situation and market returns. Also the internal
rate of return has been calculated for the machine and this is 33.5% which is more than the
required rate of return 10%.
Therefore it can be recommended that Johnson Limited should purchase the machinery and this
will bring profits for the company.
11
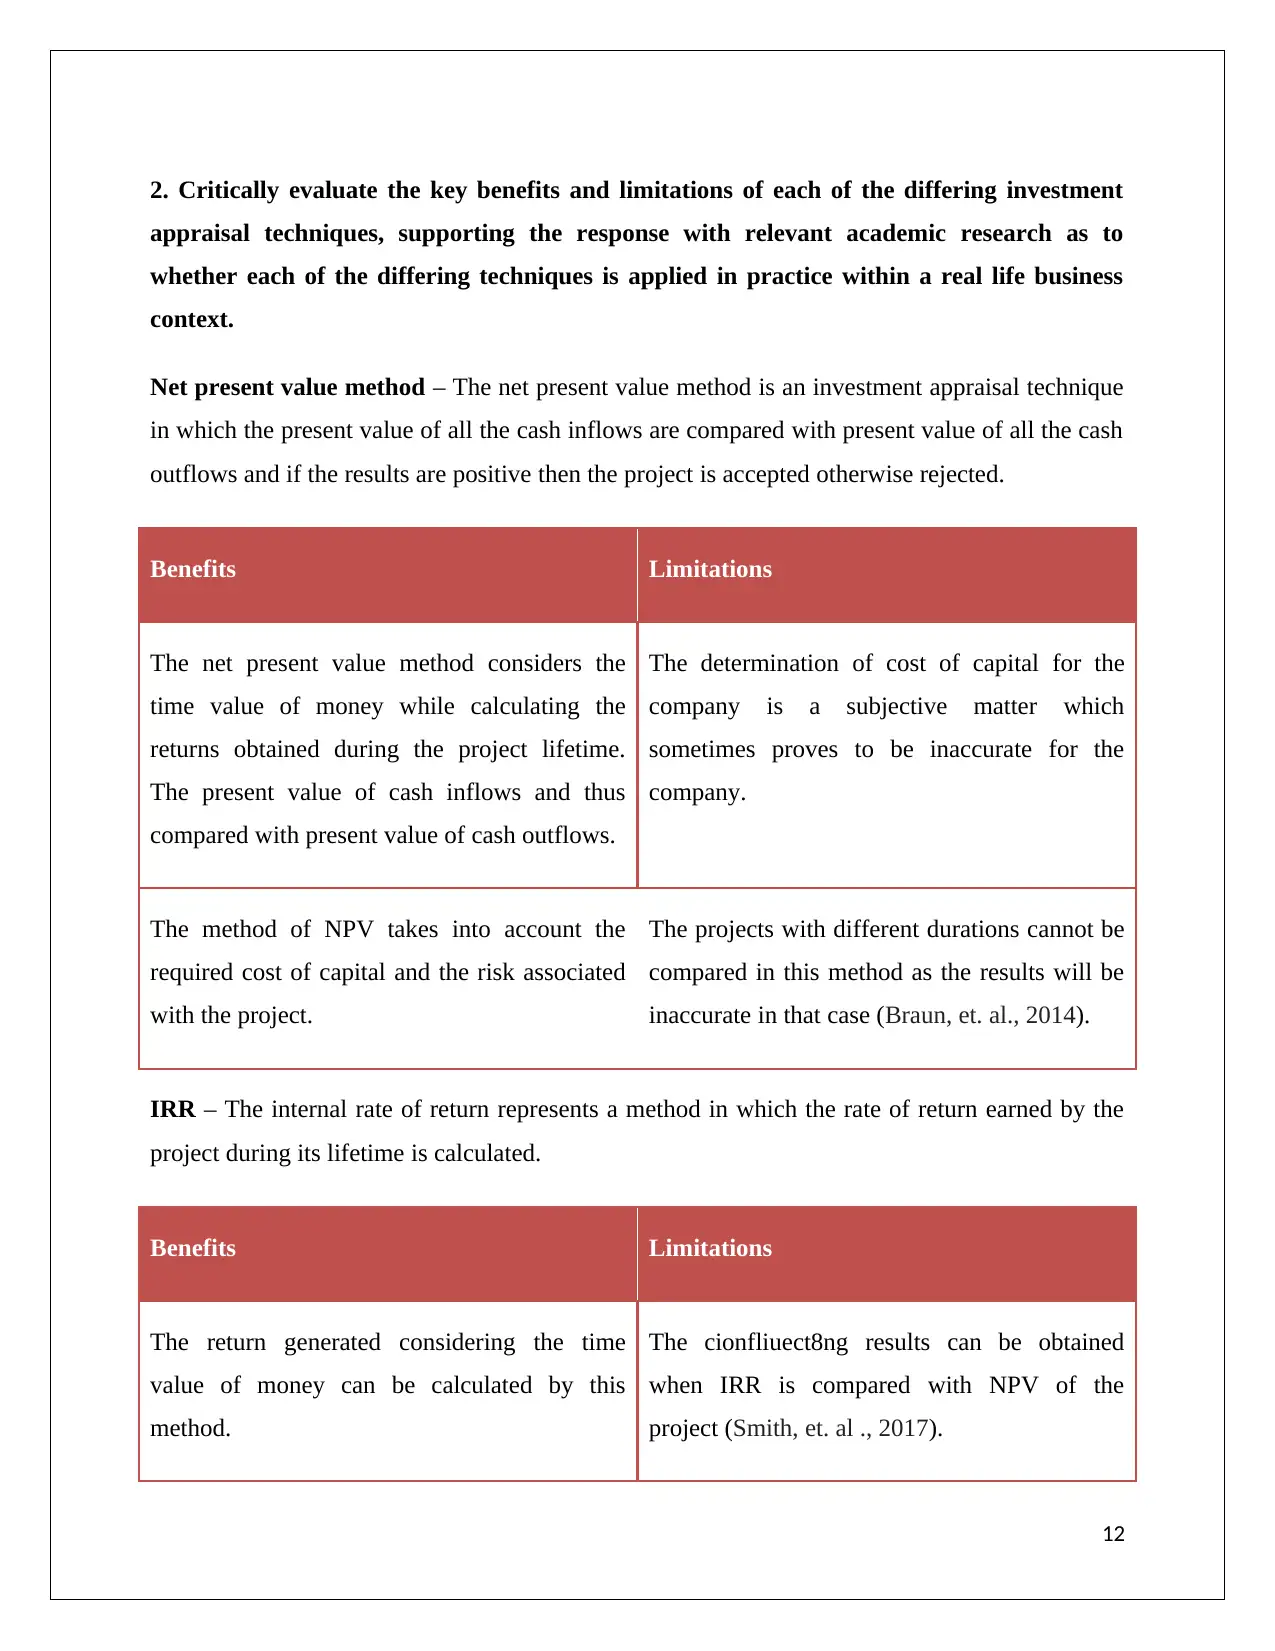
2. Critically evaluate the key benefits and limitations of each of the differing investment
appraisal techniques, supporting the response with relevant academic research as to
whether each of the differing techniques is applied in practice within a real life business
context.
Net present value method – The net present value method is an investment appraisal technique
in which the present value of all the cash inflows are compared with present value of all the cash
outflows and if the results are positive then the project is accepted otherwise rejected.
Benefits Limitations
The net present value method considers the
time value of money while calculating the
returns obtained during the project lifetime.
The present value of cash inflows and thus
compared with present value of cash outflows.
The determination of cost of capital for the
company is a subjective matter which
sometimes proves to be inaccurate for the
company.
The method of NPV takes into account the
required cost of capital and the risk associated
with the project.
The projects with different durations cannot be
compared in this method as the results will be
inaccurate in that case (Braun, et. al., 2014).
IRR – The internal rate of return represents a method in which the rate of return earned by the
project during its lifetime is calculated.
Benefits Limitations
The return generated considering the time
value of money can be calculated by this
method.
The cionfliuect8ng results can be obtained
when IRR is compared with NPV of the
project (Smith, et. al ., 2017).
12
⊘ This is a preview!⊘
Do you want full access?
Subscribe today to unlock all pages.
Trusted by 1+ million students worldwide
1 out of 16
Related Documents


Your All-in-One AI-Powered Toolkit for Academic Success.
+13062052269
info@desklib.com
Available 24*7 on WhatsApp / Email
![[object Object]](/_next/static/media/star-bottom.7253800d.svg)
Unlock your academic potential
Copyright © 2020–2026 A2Z Services. All Rights Reserved. Developed and managed by ZUCOL.