Financial Performance Analysis and Investment Recommendation Report

Verified

Added on  2020/12/10

|15
|2793
|322
Report
AI Summary
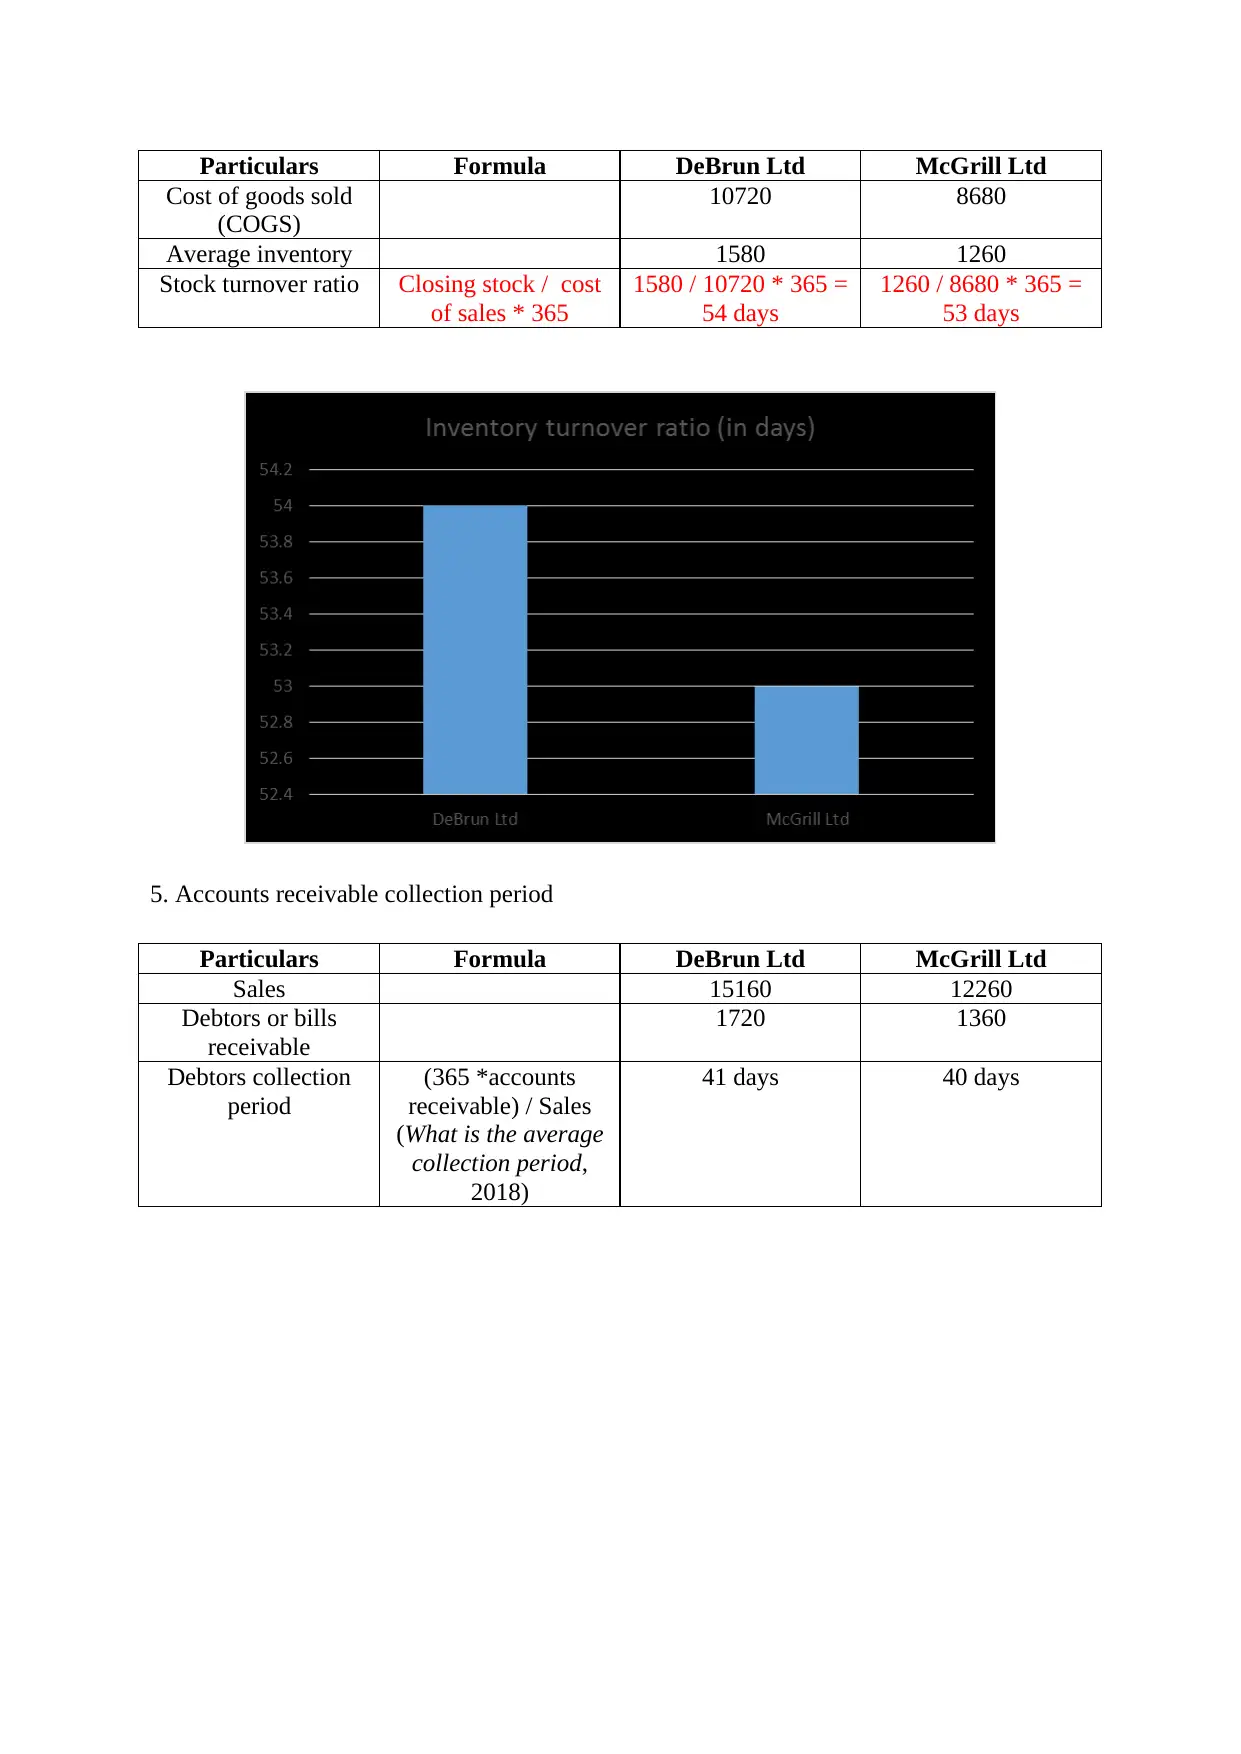
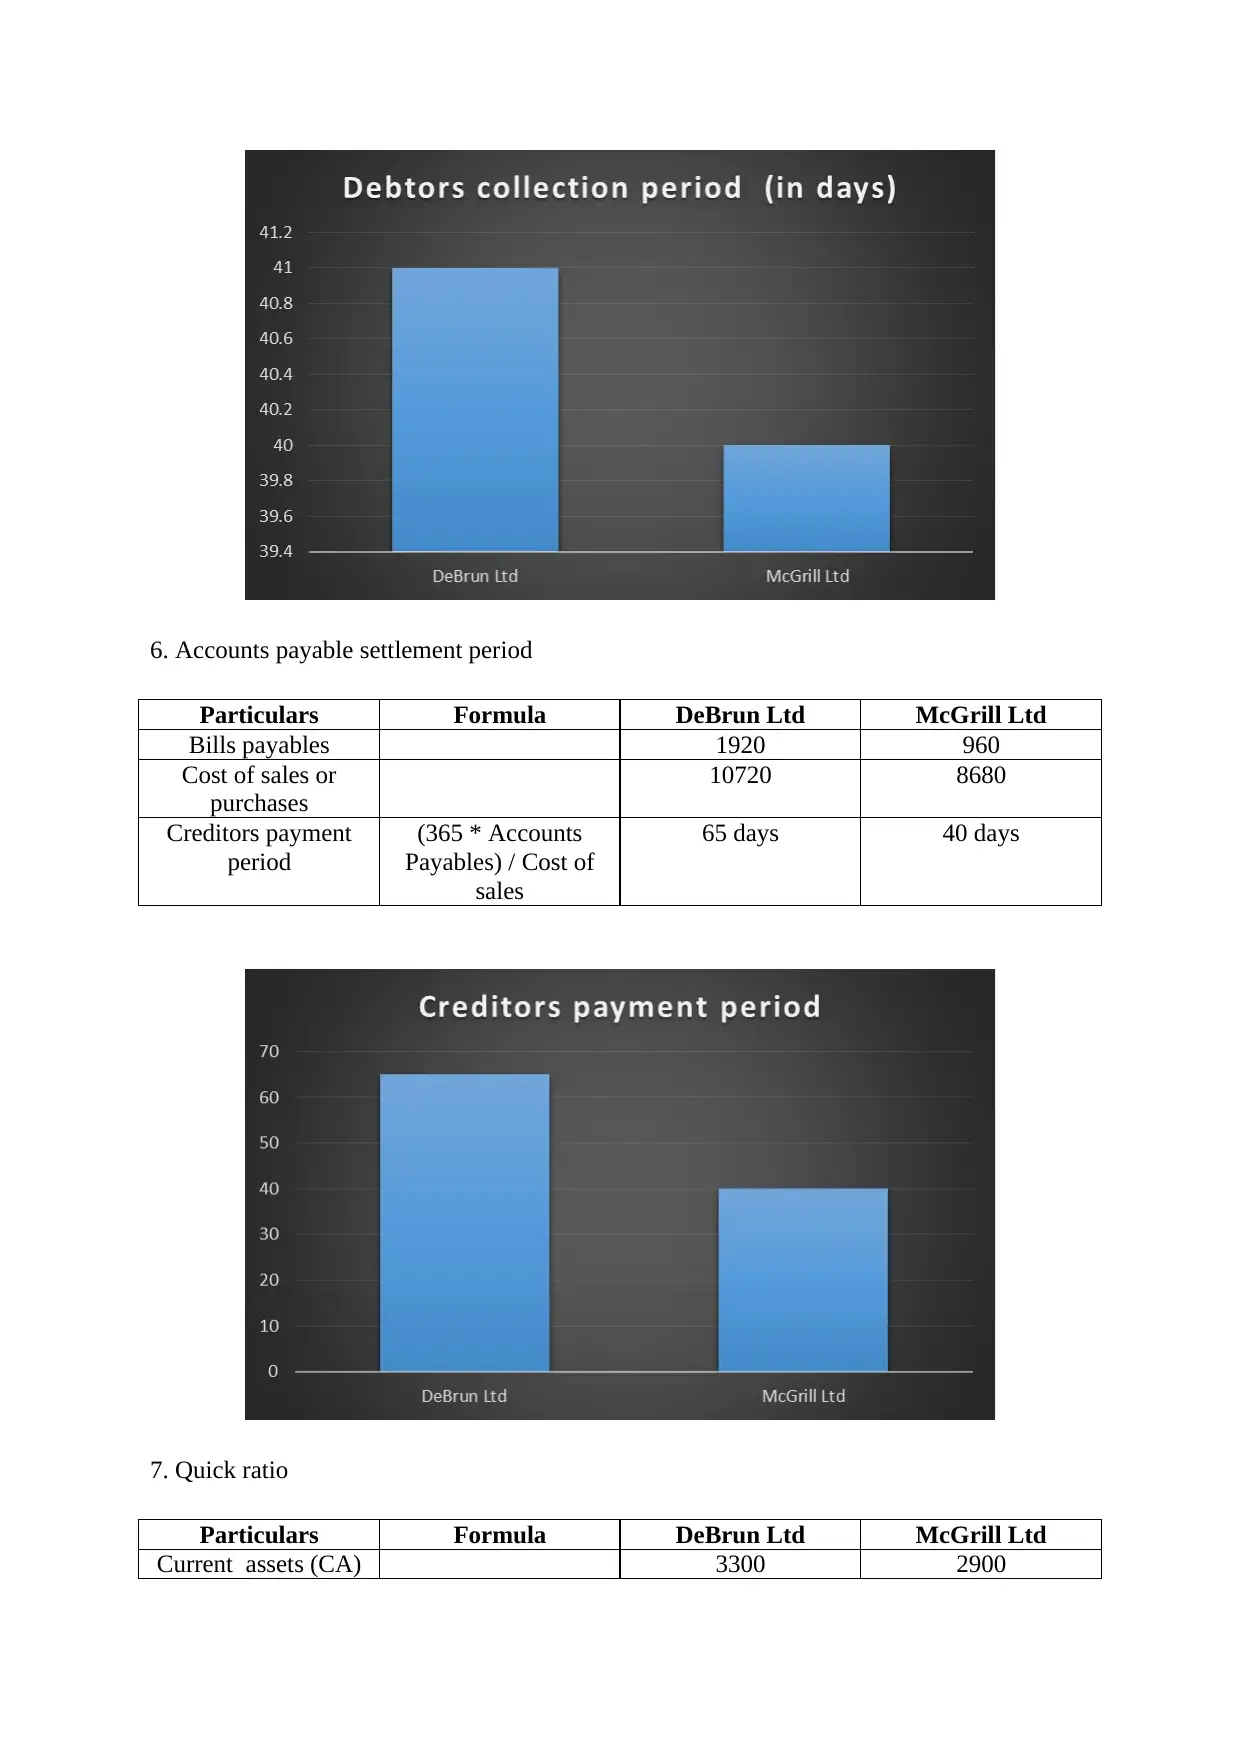
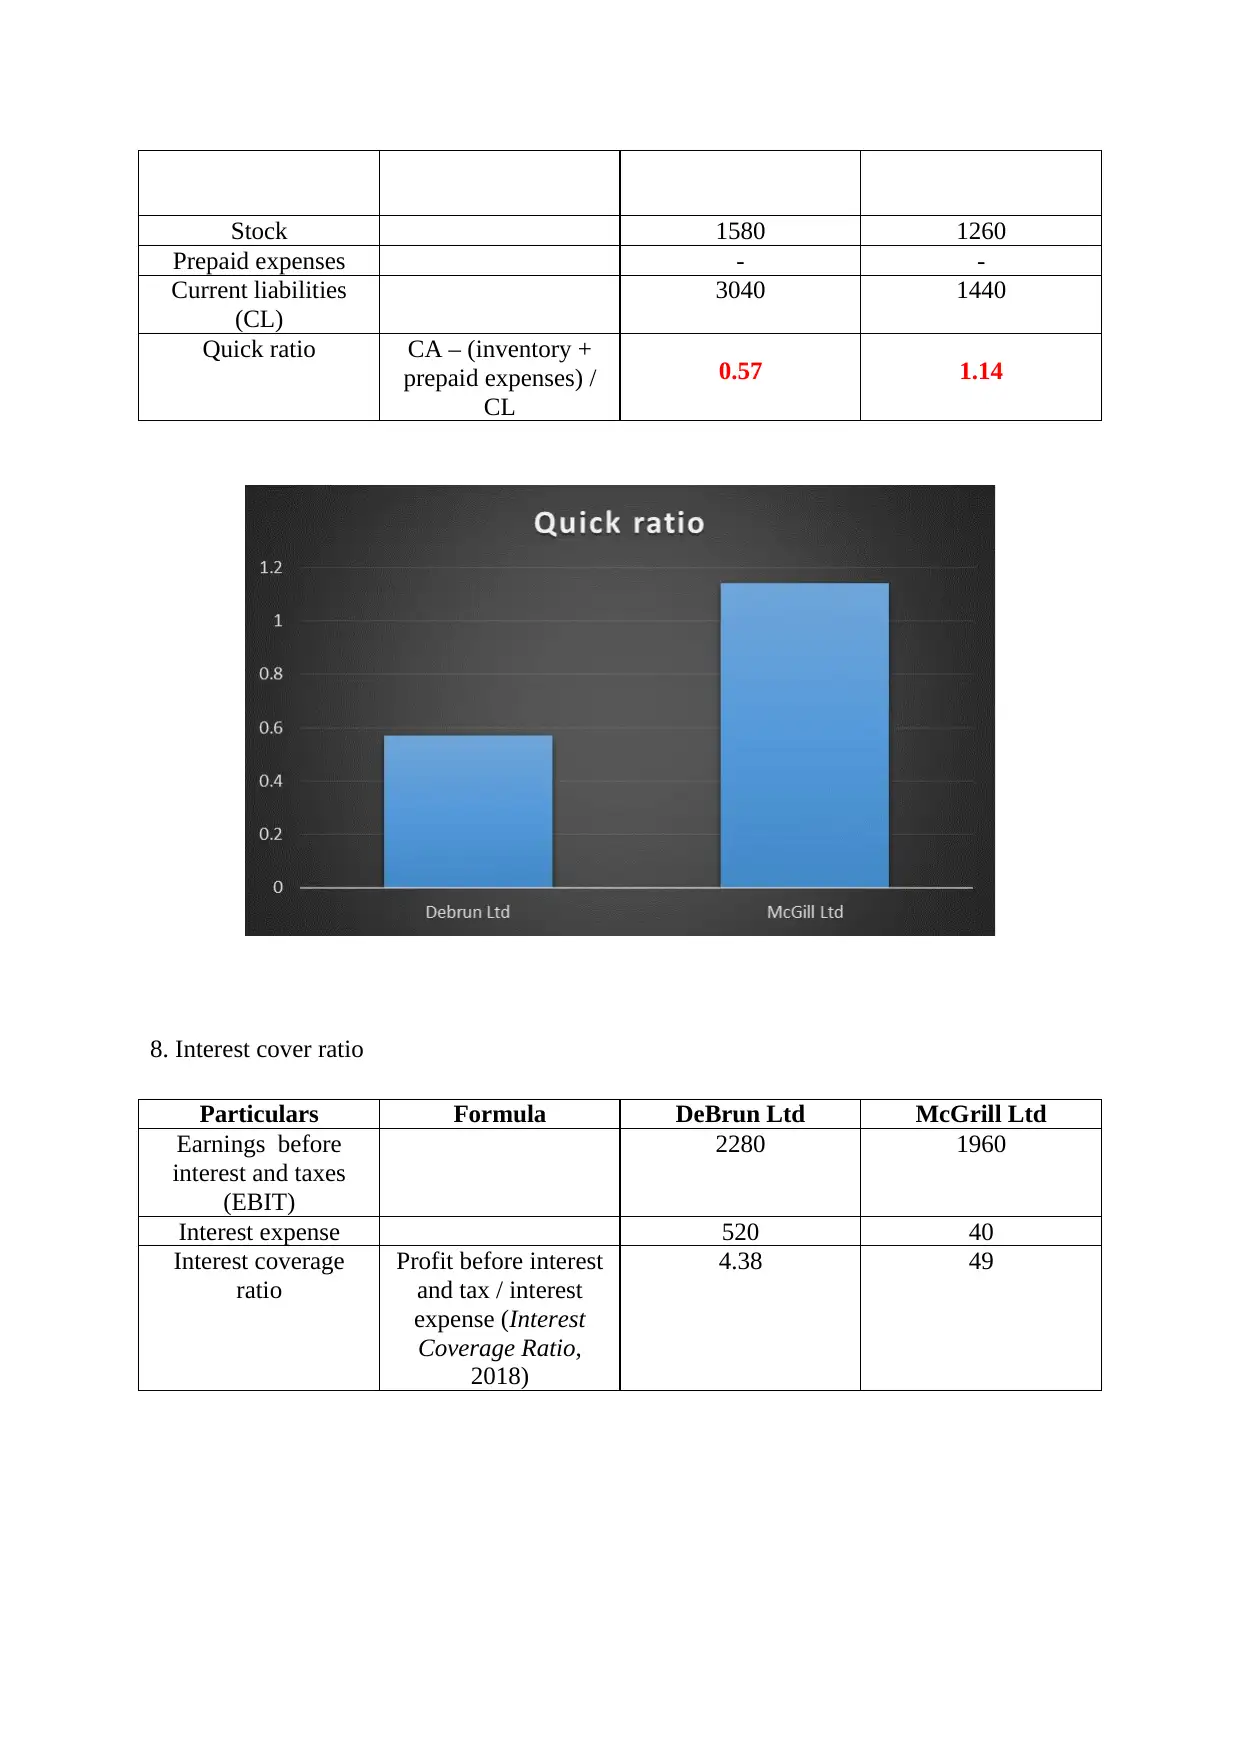
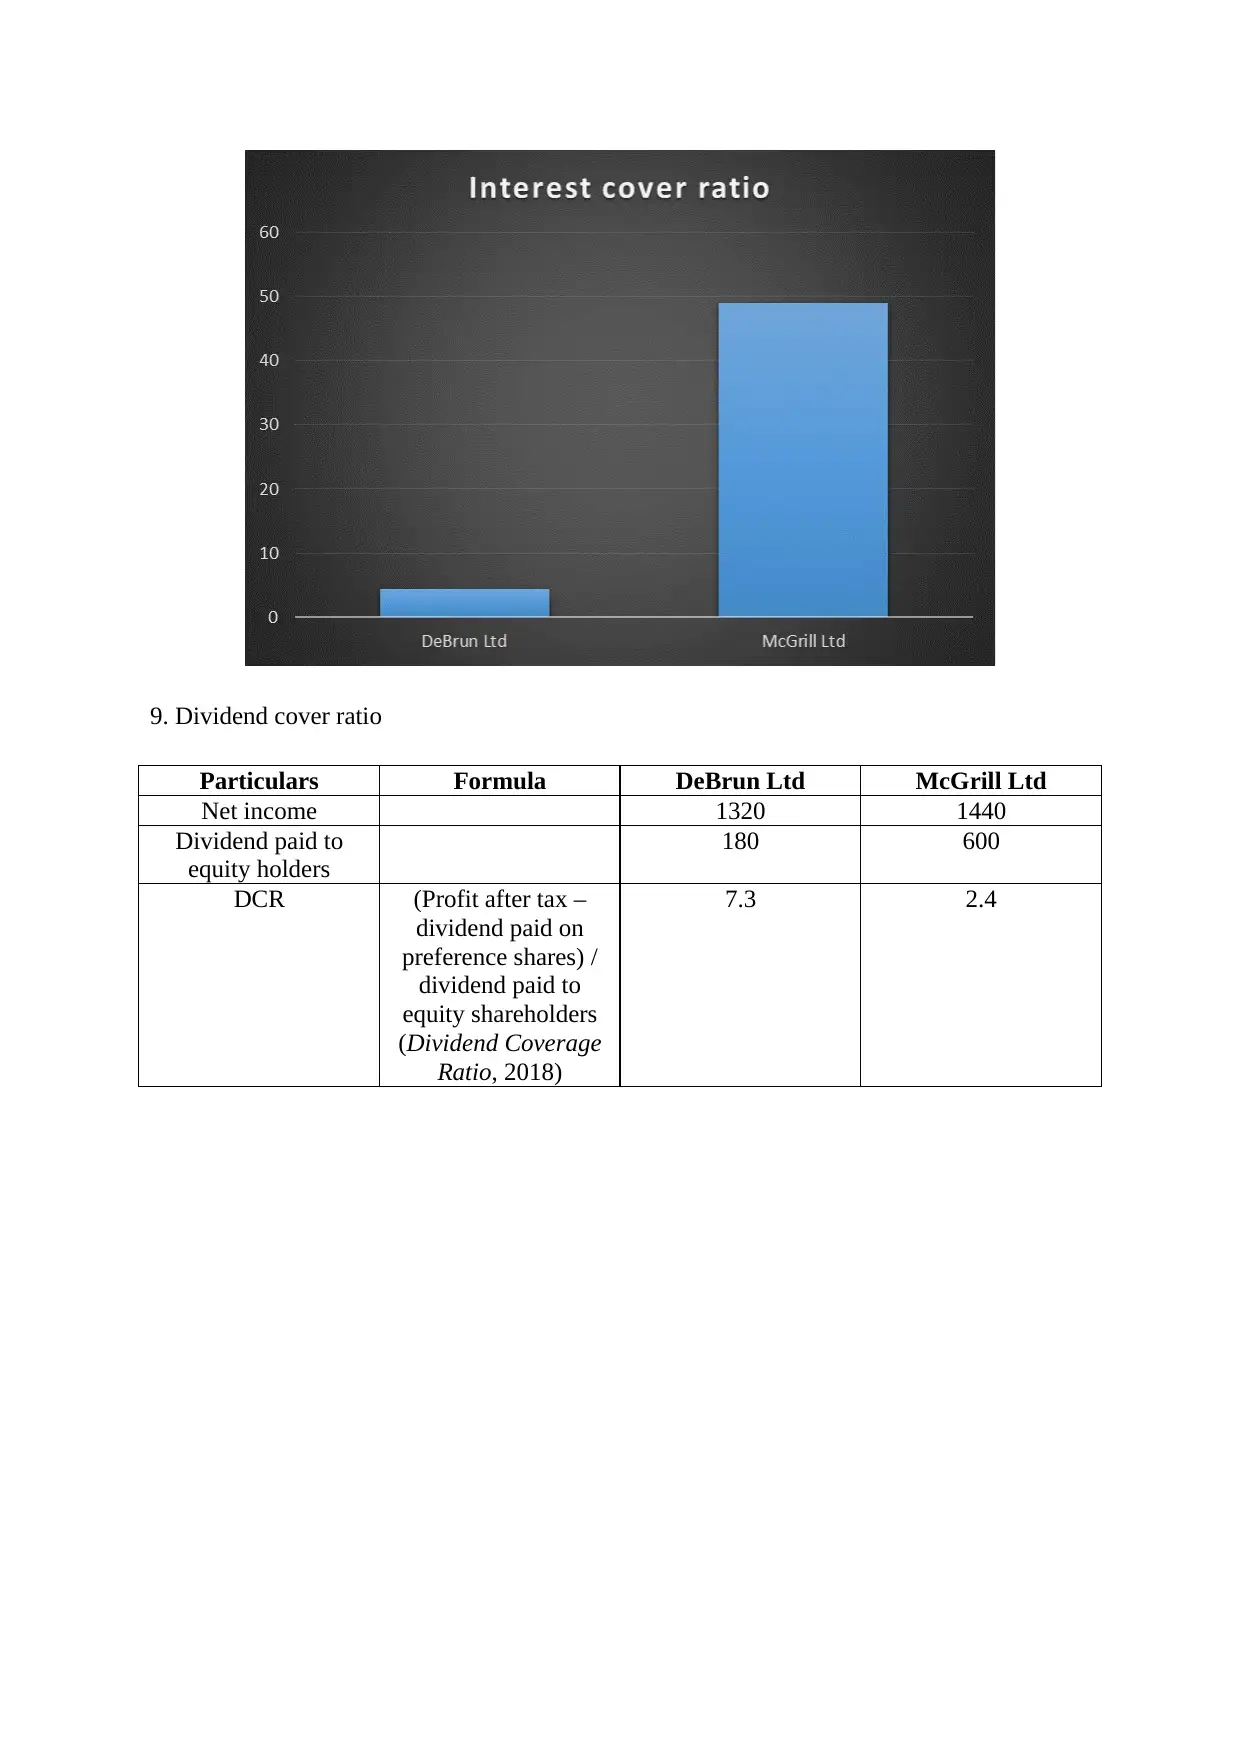
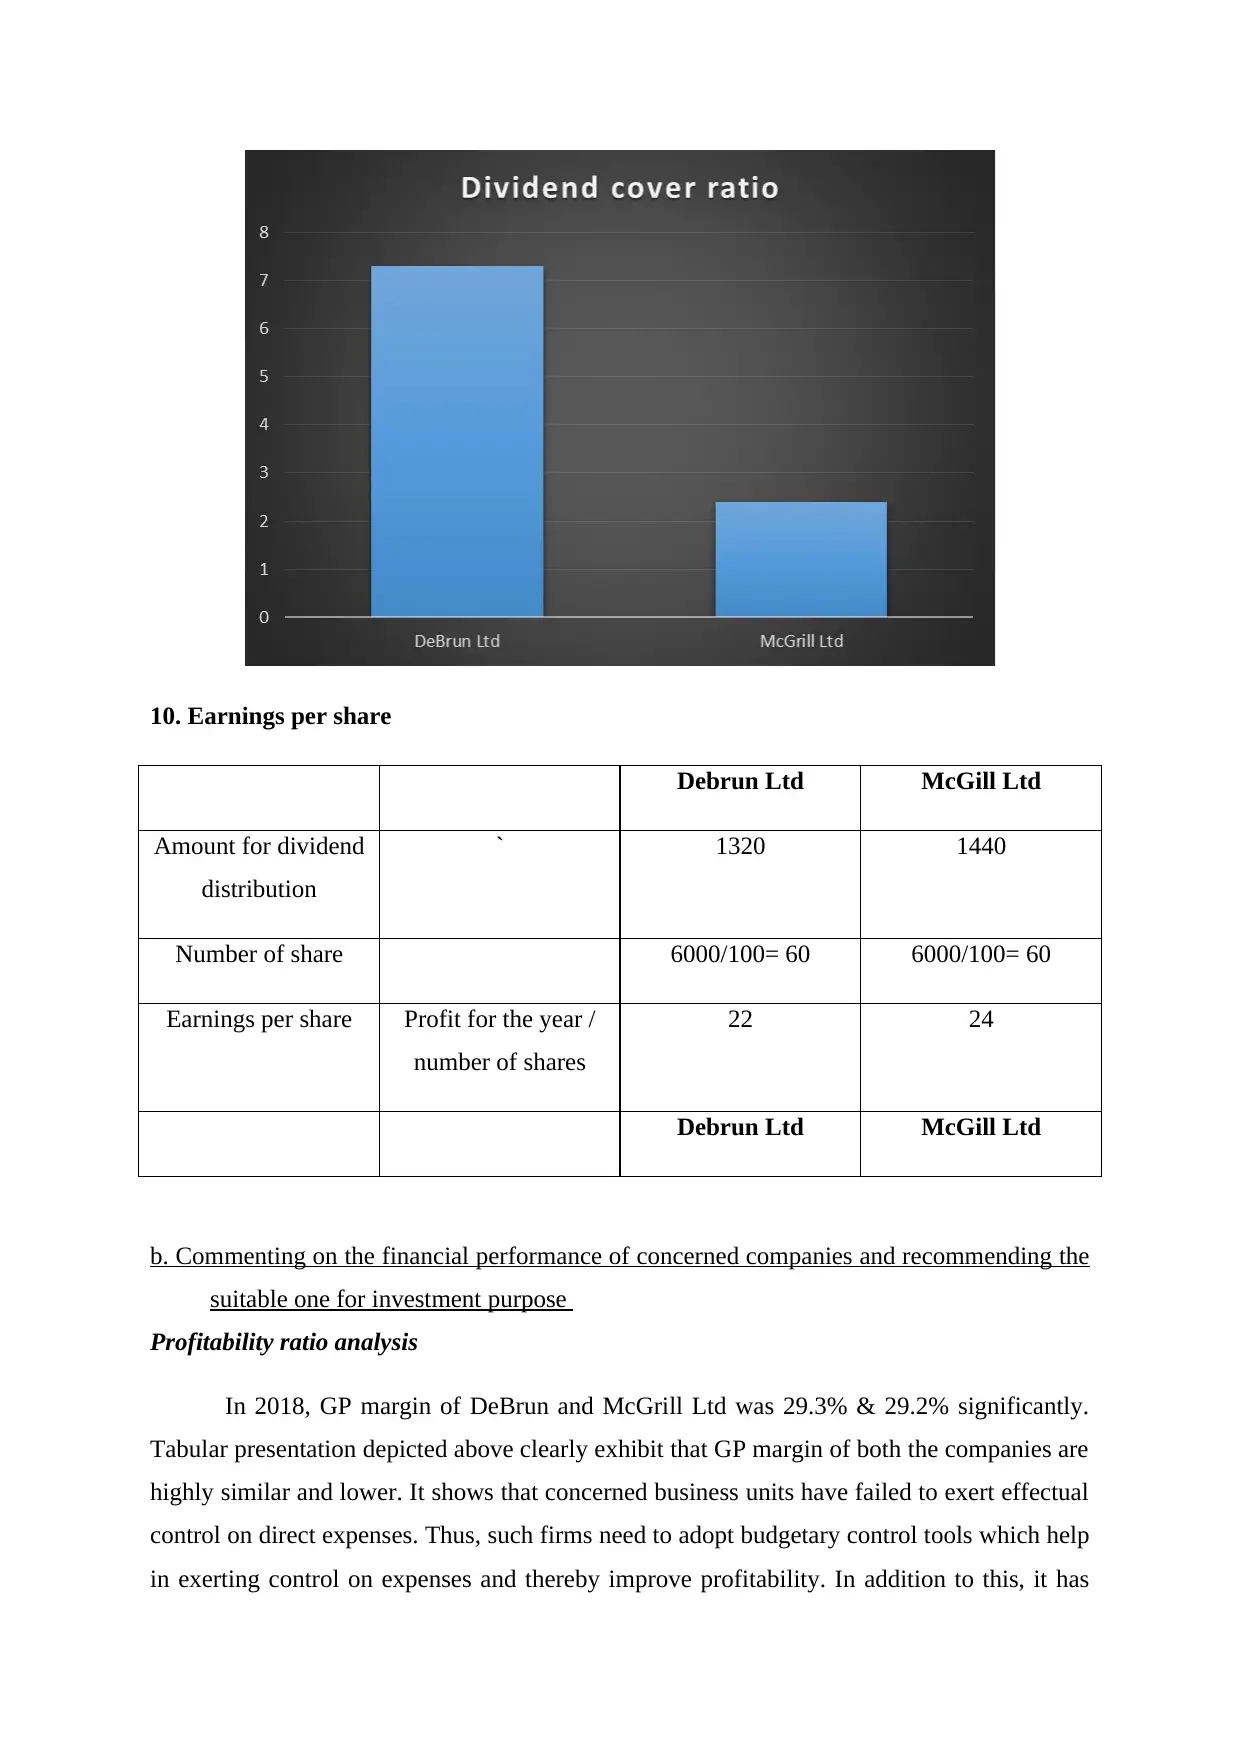
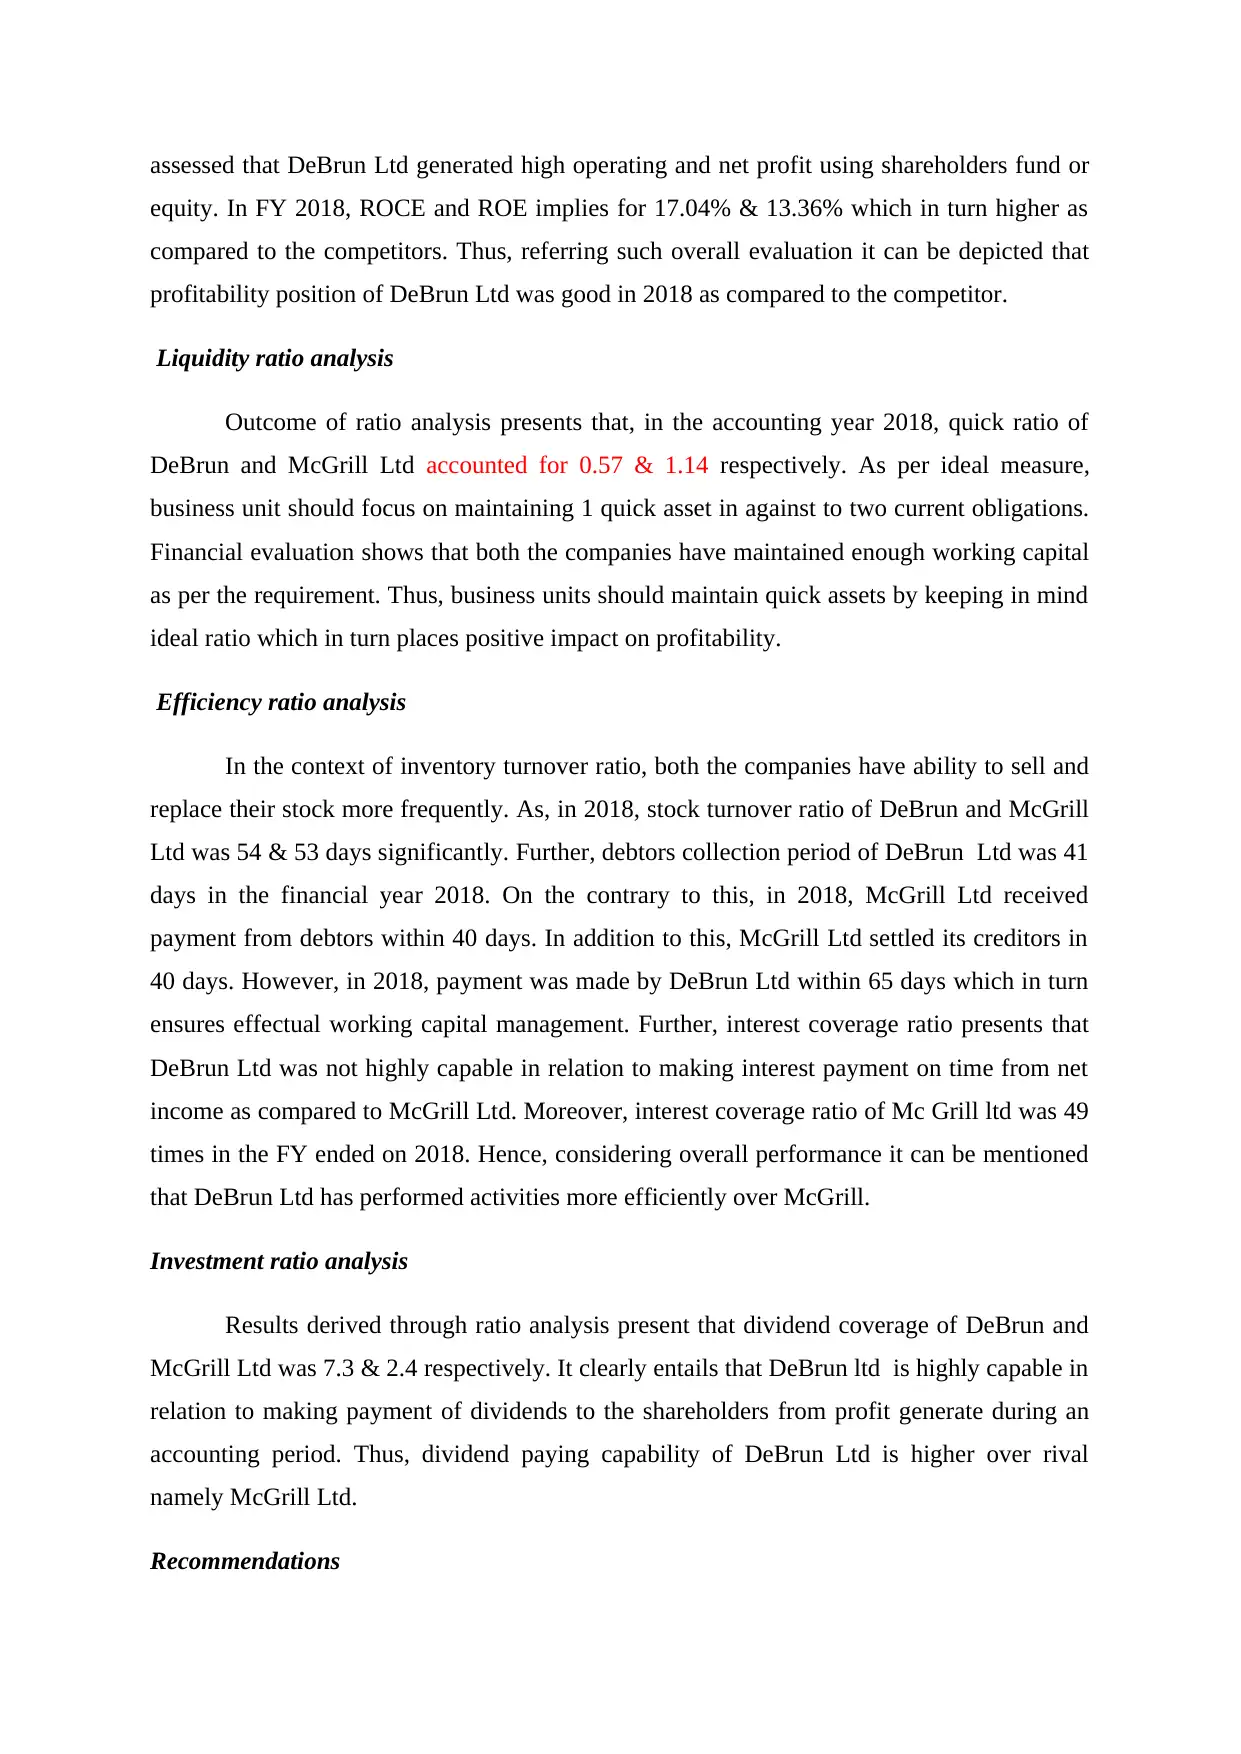
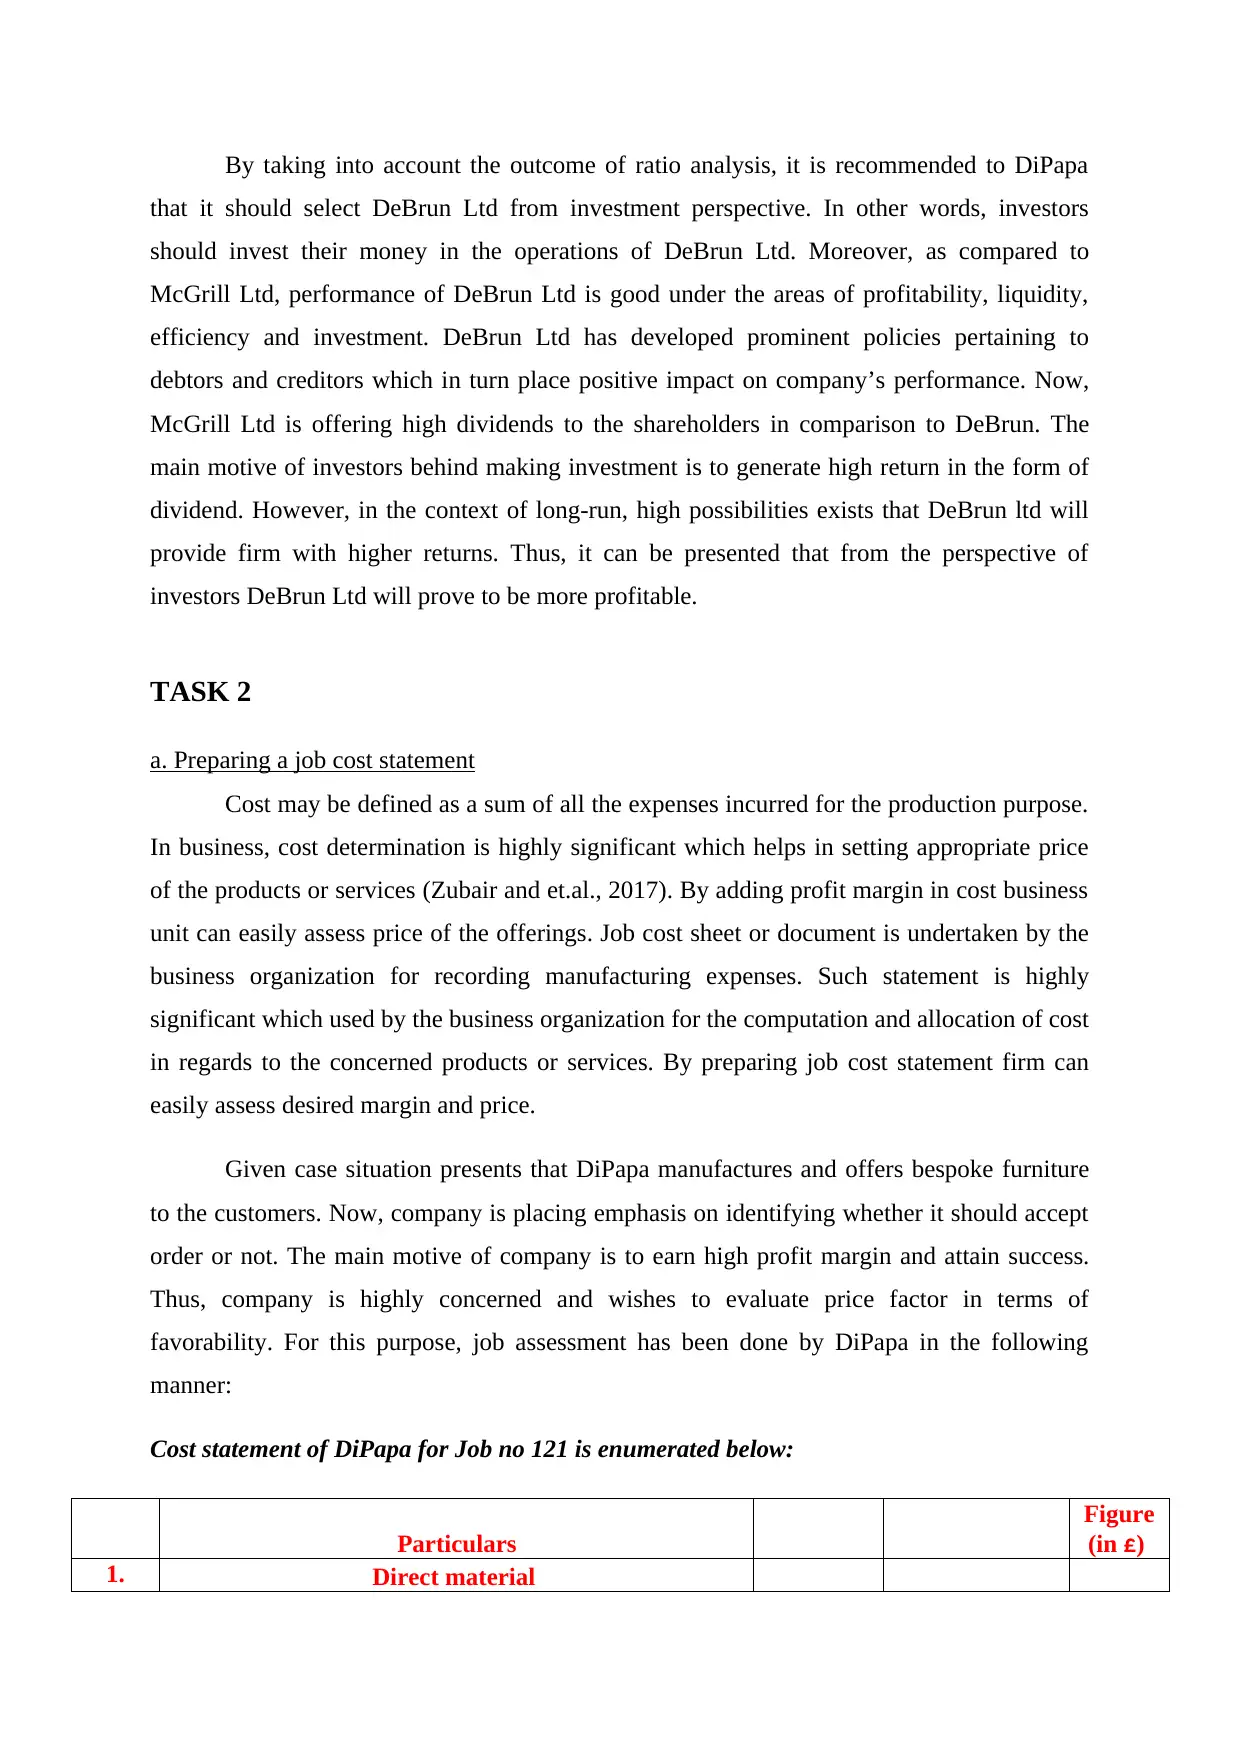
This report presents a comprehensive financial analysis of DeBrun and McGrill Ltd, evaluating their performance through various financial ratios, including profitability, liquidity, efficiency, and investment metrics. The analysis covers the financial year 2018, comparing the two companies across different aspects such as gross profit margin, return on capital employed, return on equity, inventory turnover, and dividend coverage. Based on the ratio analysis, the report recommends DeBrun Ltd as a more suitable investment option, highlighting its stronger performance in key areas. Additionally, the report includes a job cost statement prepared for DiPapa, a bespoke furniture manufacturer, to determine the cost of a specific job and aid in pricing decisions. The job cost statement details direct materials, direct labor, direct expenses, and factory overheads to calculate the total production cost, enabling DiPapa to assess the profitability of accepting a particular order.
tabler-icon-diamond-filled.svg

Contribute Materials

Your contribution can guide someone’s learning journey. Share your documents today.
Document Page
Managing Financial Resources
tabler-icon-diamond-filled.svg

Secure Best Marks with AI Grader

Need help grading? Try our AI Grader for instant feedback on your assignments.
Document Page
TABLE OF CONTENTS
INTRODUCTION .....................................................................................................................3
TASK 1......................................................................................................................................3
a. Analyzing financial performance of DeBrun and McGrill Ltd using ratio analysis
technique ..............................................................................................................................3
b. Commenting on the financial performance of concerned companies and recommending
the suitable one for investment purpose ................................................................................6
TASK 2......................................................................................................................................8
a. Preparing a job cost statement............................................................................................8
b. Advising finance managers regarding the acceptance or rejection of proposal ................9
CONCLUSION..........................................................................................................................9
REFERENCES.........................................................................................................................11
Document Page
INTRODUCTION
In the context of business unit, financial resource management is highly significant
for the attainment of organizational goals & objectives. It is the accountability of finance
manager to review monetary performance of the firm over the years and thereby take
strategic decisions for further improvement. In business, effectual financial management
facilitates optimum utilization of monetary resources and thereby helps in getting the desired
level of outcome. This project report is based on the case situation of DeBrun and McGrill
Ltd which in turn provide deeper insight about their financial performance via ratio analysis.
Report will highlight the firm in which investors should employ their money for the purpose
of getting high returns. It also depicts how cost assessment helps in setting suitable prices of
products or services.
TASK 1
a. Analyzing financial performance of DeBrun and McGrill Ltd using ratio analysis technique
Ratio analysis may be served as the most effectual tools which emphasizes on the
evaluation of quantitative information contained in financial statements. Such technique helps
in evaluating company’s performance from varied perspectives such as profitability, liquidity,
solvency, efficiency and investment (Keshavarz-Ghorabaee and et.al., 2018). By doing ratio
analysis business units can assess the extent to which their monetary position is sound. Along
with this, such tool also offers opportunity to the firm in relation to assessing its own position
over the rival firm. Considering the outcome of ratios business units can develop competent
strategic as well as policy framework. In this way, ratio analysis helps company in getting
success and gaining competitive edge.
Ratio analysis of DeBrun and McGrill Ltd for the year ended on 31st March 2018 is
enumerated below:
1. Gross profit or ratio
Particulars Formula DeBrun Ltd McGrill Ltd
Gross profit 4440 3580
Net sales or revenue 15160 12260
GP ratio GP / Net sales *
100
29.3% 29.2%
Document Page
2. Return on capital employed
Particulars Formula Debrun Ltd McGill Ltd
Operating profit 2280 1960
Total Assets 16420 11380
Current Liability 3040 1440
Capital employed
Total Assets – Current
Liability 13380 9940
Return on capital
employed
Net operating
profit/(Equity + non-
current liabilities) 17.04% 19.72%
tabler-icon-diamond-filled.svg

Secure Best Marks with AI Grader

Need help grading? Try our AI Grader for instant feedback on your assignments.
Document Page
3. Return on equity
Particulars Formula DeBrun Ltd McGrill Ltd
Net profit (NP) 1320 1440
Shareholders’ equity 9880 9440
ROE Profit after tax /
Shareholders’ equity
* 100 (Return on
equity, 2018)
13.36% 15.25%
4. Inventory turnover ratio (in days)
Document Page
Particulars Formula DeBrun Ltd McGrill Ltd
Cost of goods sold
(COGS)
10720 8680
Average inventory 1580 1260
Stock turnover ratio Closing stock / cost
of sales * 365
1580 / 10720 * 365 =
54 days
1260 / 8680 * 365 =
53 days
5. Accounts receivable collection period
Particulars Formula DeBrun Ltd McGrill Ltd
Sales 15160 12260
Debtors or bills
receivable
1720 1360
Debtors collection
period
(365 *accounts
receivable) / Sales
(What is the average
collection period,
2018)
41 days 40 days
Document Page
6. Accounts payable settlement period
Particulars Formula DeBrun Ltd McGrill Ltd
Bills payables 1920 960
Cost of sales or
purchases
10720 8680
Creditors payment
period
(365 * Accounts
Payables) / Cost of
sales
65 days 40 days
7. Quick ratio
Particulars Formula DeBrun Ltd McGrill Ltd
Current assets (CA) 3300 2900
tabler-icon-diamond-filled.svg

Paraphrase This Document

Need a fresh take? Get an instant paraphrase of this document with our AI Paraphraser
Document Page
Stock 1580 1260
Prepaid expenses - -
Current liabilities
(CL)
3040 1440
Quick ratio CA – (inventory +
prepaid expenses) /
CL
0.57 1.14
8. Interest cover ratio
Particulars Formula DeBrun Ltd McGrill Ltd
Earnings before
interest and taxes
(EBIT)
2280 1960
Interest expense 520 40
Interest coverage
ratio
Profit before interest
and tax / interest
expense (Interest
Coverage Ratio,
2018)
4.38 49
Document Page
9. Dividend cover ratio
Particulars Formula DeBrun Ltd McGrill Ltd
Net income 1320 1440
Dividend paid to
equity holders
180 600
DCR (Profit after tax –
dividend paid on
preference shares) /
dividend paid to
equity shareholders
(Dividend Coverage
Ratio, 2018)
7.3 2.4
Document Page
10. Earnings per share
Debrun Ltd McGill Ltd
Amount for dividend
distribution
` 1320 1440
Number of share 6000/100= 60 6000/100= 60
Earnings per share Profit for the year /
number of shares
22 24
Debrun Ltd McGill Ltd
b. Commenting on the financial performance of concerned companies and recommending the
suitable one for investment purpose
Profitability ratio analysis
In 2018, GP margin of DeBrun and McGrill Ltd was 29.3% & 29.2% significantly.
Tabular presentation depicted above clearly exhibit that GP margin of both the companies are
highly similar and lower. It shows that concerned business units have failed to exert effectual
control on direct expenses. Thus, such firms need to adopt budgetary control tools which help
in exerting control on expenses and thereby improve profitability. In addition to this, it has
tabler-icon-diamond-filled.svg

Secure Best Marks with AI Grader

Need help grading? Try our AI Grader for instant feedback on your assignments.
Document Page
assessed that DeBrun Ltd generated high operating and net profit using shareholders fund or
equity. In FY 2018, ROCE and ROE implies for 17.04% & 13.36% which in turn higher as
compared to the competitors. Thus, referring such overall evaluation it can be depicted that
profitability position of DeBrun Ltd was good in 2018 as compared to the competitor.
Liquidity ratio analysis
Outcome of ratio analysis presents that, in the accounting year 2018, quick ratio of
DeBrun and McGrill Ltd accounted for 0.57 & 1.14 respectively. As per ideal measure,
business unit should focus on maintaining 1 quick asset in against to two current obligations.
Financial evaluation shows that both the companies have maintained enough working capital
as per the requirement. Thus, business units should maintain quick assets by keeping in mind
ideal ratio which in turn places positive impact on profitability.
Efficiency ratio analysis
In the context of inventory turnover ratio, both the companies have ability to sell and
replace their stock more frequently. As, in 2018, stock turnover ratio of DeBrun and McGrill
Ltd was 54 & 53 days significantly. Further, debtors collection period of DeBrun Ltd was 41
days in the financial year 2018. On the contrary to this, in 2018, McGrill Ltd received
payment from debtors within 40 days. In addition to this, McGrill Ltd settled its creditors in
40 days. However, in 2018, payment was made by DeBrun Ltd within 65 days which in turn
ensures effectual working capital management. Further, interest coverage ratio presents that
DeBrun Ltd was not highly capable in relation to making interest payment on time from net
income as compared to McGrill Ltd. Moreover, interest coverage ratio of Mc Grill ltd was 49
times in the FY ended on 2018. Hence, considering overall performance it can be mentioned
that DeBrun Ltd has performed activities more efficiently over McGrill.
Investment ratio analysis
Results derived through ratio analysis present that dividend coverage of DeBrun and
McGrill Ltd was 7.3 & 2.4 respectively. It clearly entails that DeBrun ltd is highly capable in
relation to making payment of dividends to the shareholders from profit generate during an
accounting period. Thus, dividend paying capability of DeBrun Ltd is higher over rival
namely McGrill Ltd.
Recommendations
Document Page
By taking into account the outcome of ratio analysis, it is recommended to DiPapa
that it should select DeBrun Ltd from investment perspective. In other words, investors
should invest their money in the operations of DeBrun Ltd. Moreover, as compared to
McGrill Ltd, performance of DeBrun Ltd is good under the areas of profitability, liquidity,
efficiency and investment. DeBrun Ltd has developed prominent policies pertaining to
debtors and creditors which in turn place positive impact on company’s performance. Now,
McGrill Ltd is offering high dividends to the shareholders in comparison to DeBrun. The
main motive of investors behind making investment is to generate high return in the form of
dividend. However, in the context of long-run, high possibilities exists that DeBrun ltd will
provide firm with higher returns. Thus, it can be presented that from the perspective of
investors DeBrun Ltd will prove to be more profitable.
TASK 2
a. Preparing a job cost statement
Cost may be defined as a sum of all the expenses incurred for the production purpose.
In business, cost determination is highly significant which helps in setting appropriate price
of the products or services (Zubair and et.al., 2017). By adding profit margin in cost business
unit can easily assess price of the offerings. Job cost sheet or document is undertaken by the
business organization for recording manufacturing expenses. Such statement is highly
significant which used by the business organization for the computation and allocation of cost
in regards to the concerned products or services. By preparing job cost statement firm can
easily assess desired margin and price.
Given case situation presents that DiPapa manufactures and offers bespoke furniture
to the customers. Now, company is placing emphasis on identifying whether it should accept
order or not. The main motive of company is to earn high profit margin and attain success.
Thus, company is highly concerned and wishes to evaluate price factor in terms of
favorability. For this purpose, job assessment has been done by DiPapa in the following
manner:
Cost statement of DiPapa for Job no 121 is enumerated below:
Particulars
Figure
(in £)
1. Direct material
Document Page
Wood 80 meters 4.30 per metre 344
Fabric
27 SQ
metre
7.50 per SQ
metre 202.5
Stuffing 25 kg 6 per Kg 150
Total material cost 696.5
2. Direct labour
Manufacturing 95 hours 6.5 per hour 617.5
Finishing 45 hours 5.5 per hour 247.5
Total direct labour cost 865
3. Direct expenses / overhead
Hire of Specialised equipment 8 weeks 75 per week 600
Prime cost (Direct material + direct labour + direct
expenditure) 2162
Add: Factory overhead (20% of direct labour cost) 173
Total production cost (material + labour + specialised
equipment cost + factory overhead) 2335
Non-production expenditure
5. Administration overhead (15% of production cost) 350
6. Selling and distribution overhead (12.5% of prime
cost ) 270
Total cost (material + labour + equipment +factory
overhead + S&D expenses + administration overhead) 2955
Profit margin 12.50%
Price
[cost + (cost * profit margin) 3324
b. Advising finance managers regarding the acceptance or rejection of proposal
Job cost statement shows that DiPapa should charge £3324 from per customer for
attaining 12.50% profit margin. By charging such price business unit will get £369 profit
margin respectively. Cited case presents that, customer is quoting a proposal with £3399.99
significantly. Hence, it can be entailed that assessed price is lower than the quoted price level.
Thus, focus should accept proposal which in turn enables to get high profit margin over the
expectation. Hence, finance manager of DiPapa Ltd is advised to accept the proposal with a
quote of £3399.99 significantly.
tabler-icon-diamond-filled.svg

Paraphrase This Document

Need a fresh take? Get an instant paraphrase of this document with our AI Paraphraser
Document Page
CONCLUSION
By summing up this report, it has been concluded that ratio analysis tool helps in
summarizing financial statements prominently. It can be seen in the report that profitability
position of DeBrun Ltd is good in comparison to McGrill Ltd. Besides this, it can be inferred
that both the business units have maintained high quick assets for meeting financial
obligations. Hence, both the companies should focus on maintaining quick ratio in line with
ideal framework. This in turn helps firm in maximizing profitability and thereby contributes
in overall growth. Further, it has been articulated that focus should be placed by the investors
on investing money in DeBrun Ltd over the rival firm. It can be summarized from the report
manager of DiPapa should accept then order at the price quote of £3,399.99 respectively.
Document Page
REFERENCES
Books and Journals
Keshavarz-Ghorabaee, M. and et.al., 2018. An Extended Step-Wise Weight Assessment
Ratio Analysis with Symmetric Interval Type-2 Fuzzy Sets for Determining the Subjective
Weights of Criteria in Multi-Criteria Decision-Making Problems. Symmetry. 10(4). p.91.
Zubair, M. I. and et.al., 2017. Performance and cost assessment of solar driven humidification
dehumidification desalination system. Energy Conversion and Management. 132. pp.28-
39.
Online
Dividend Coverage Ratio. 2018. [Online]. Available through: < https://accounting-
simplified.com/financial/ratio-analysis/dividend-coverage.html>.
Interest Coverage Ratio. 2018. [Online]. Available through: <
https://www.myaccountingcourse.com/financial-ratios/interest-coverage-ratio>.
Return on Capital Employed. 2018. [Online]. Available through:
<https://www.myaccountingcourse.com/financial-ratios/return-on-capital-employed>.
Return on equity. 2018. [Online]. Available through:
<https://www.myaccountingcourse.com/financial-ratios/return-on-equity>.
What is the average collection period? 2018. [Online]. Available through: <
https://www.accountingcoach.com/blog/average-collection-period>.
chevron_up_icon
1 out of 15
circle_padding
hide_on_mobile
zoom_out_icon
logo.png

Your All-in-One AI-Powered Toolkit for Academic Success.

Available 24*7 on WhatsApp / Email

[object Object]