Financial Performance Analysis of Marks & Spencer: A Report
VerifiedAdded on 2019/12/03
|28
|4886
|442
Report
AI Summary
This report provides a detailed financial analysis of Marks & Spencer's performance from 2010 to 2012, employing various financial ratios to assess profitability, liquidity, performance, and efficiency. The analysis includes the calculation and evaluation of gross profit margin, net profit margin, operating profit margin, current ratio, quick ratio, return on assets, return on capital employed, return on equity, earnings per share, accounts receivable turnover, average collection period, asset turnover ratio, and inventory turnover ratio. The report critically evaluates the trends and implications of these ratios, offering insights into the company's financial health and providing recommendations for improvement. The second part of the report explores investment appraisal techniques, comparing and contrasting two project proposals and discussing their advantages and disadvantages.
FINANCIAL MANAGEMENT
Paraphrase This Document
Need a fresh take? Get an instant paraphrase of this document with our AI Paraphraser
Table of Contents
INTRODUCTION...........................................................................................................................1
PART 1............................................................................................................................................1
1.1 Calculation of profitability, liquidity, performance and efficiency ratios for the past three
years of Marks & Spencer...........................................................................................................1
Ratios for Marks and Spencer......................................................................................................5
1.2 Critical evaluations of the ratios calculated for the last three years and advise to the
company.......................................................................................................................................6
1.3 Summarized Report...............................................................................................................9
PART 2..........................................................................................................................................11
2.1 Appraisal of two projects.....................................................................................................11
2.2 Other appraisal techniques...................................................................................................14
2.3 Advantages and disadvantages of the investment appraisal methods.................................15
2.4 Summarized Report.........................................................................................................18
REFERENCES..............................................................................................................................19
Table 1Ratios for Marks & Spencer................................................................................................5
Table 2 Report of ratios...................................................................................................................9
Table 3 PV of project 1..................................................................................................................11
Table 4 PV of project 2..................................................................................................................11
Table 5 PV of project 1 at 11%.....................................................................................................13
Table 6 PV of project 2 at 9%.......................................................................................................13
⊘ This is a preview!⊘
Do you want full access?
Subscribe today to unlock all pages.
Trusted by 1+ million students worldwide
INTRODUCTION
Evaluation of the financial data of a company can be termed as financial management. It
helps to analyze that whether a company is gaining profits or incurring losses. The concept is
used by companies to analyze the implementation of resources in an appropriate manner. It also
provides a framework to the business units in order to make decision making. With the help of
financial data available, it is easier for companies as well as investors to evaluate the
performance of a firm in monetary terms. There are various tools of financial management which
are used and employed by companies to assess the efficiency of their operations. The most
widely used among them are ratio analysis and investment appraisal or capital budgeting
techniques (Financial Management - Meaning, Objectives and Functions, 2013).
In part 1 of this project, performance of a retail company will be analyzed. The company
taken is Marks & Spencer. The performance is judged with the help of ratios for three financial
years. The data is compared to judge the progress of the company. In the second part of the
project, two project proposals will be analyzed and decision will be made on them by making use
of capital budgeting or investment appraisal methods.
PART 1
In this section, a company is taken particularly from the retail sector which is among the
top 100 companies being traded on FTSE- 100 index on London Stock Exchange. The annual
reports of the company are evaluated for the last three years. The financial ratios of the company
are analyzed. The company taken in this report is Marks & Spencer.
1.1. Calculation of profitability, liquidity, performance and efficiency ratios for the past three
years of Marks & Spencer Profitability ratios – These ratios are used to show the profitability or profit earned by a
company during an operating year. Following are the profitability ratio-
Gross profit margin
G ross profit margin= gross profit
net sales
Gross profit margin is the ratio of gross profit or income to that of sales. The
amount of sales that is left over after taking the cost of goods sold is determined
by this ratio (Financial ratios, 2010).
1
Paraphrase This Document
Need a fresh take? Get an instant paraphrase of this document with our AI Paraphraser
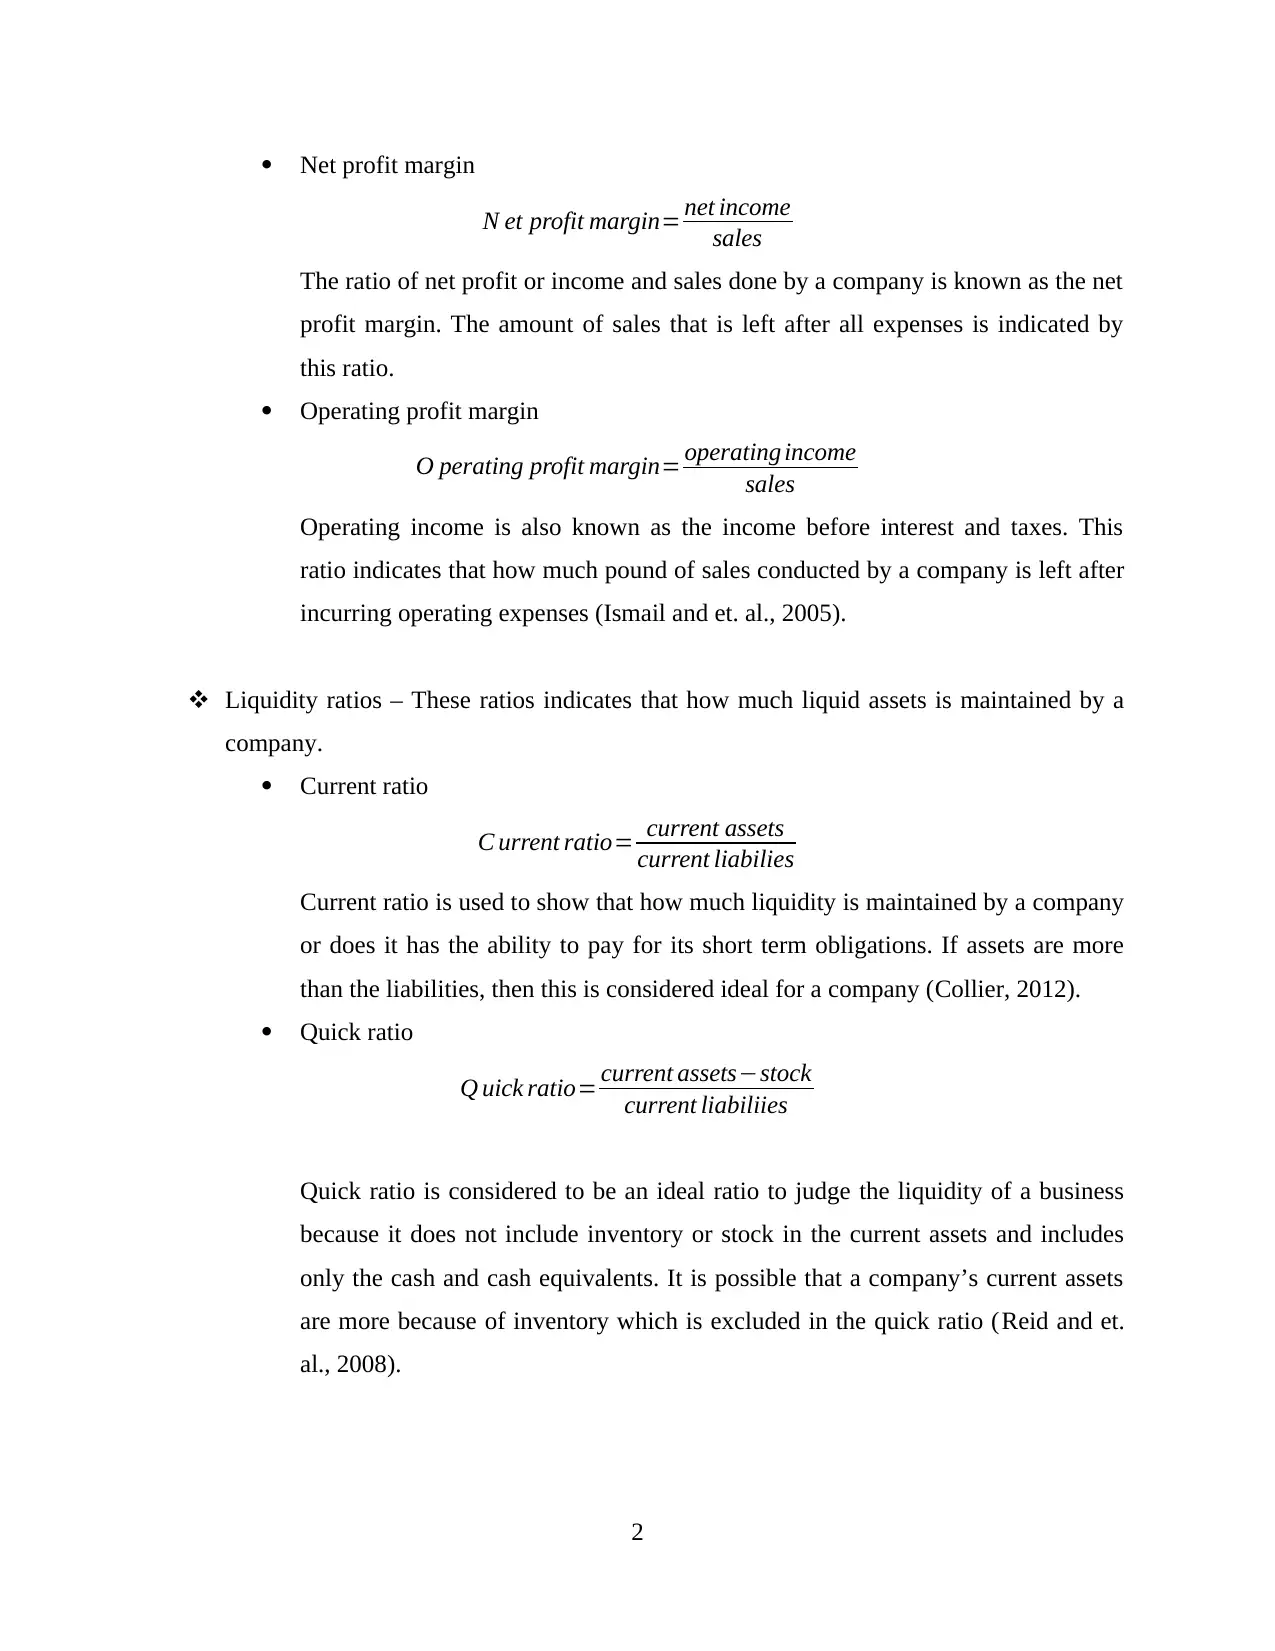
Net profit margin
N et profit margin= net income
sales
The ratio of net profit or income and sales done by a company is known as the net
profit margin. The amount of sales that is left after all expenses is indicated by
this ratio.
Operating profit margin
O perating profit margin= operating income
sales
Operating income is also known as the income before interest and taxes. This
ratio indicates that how much pound of sales conducted by a company is left after
incurring operating expenses (Ismail and et. al., 2005).
Liquidity ratios – These ratios indicates that how much liquid assets is maintained by a
company.
Current ratio
C urrent ratio= current assets
current liabilies
Current ratio is used to show that how much liquidity is maintained by a company
or does it has the ability to pay for its short term obligations. If assets are more
than the liabilities, then this is considered ideal for a company (Collier, 2012).
Quick ratio
Q uick ratio= current assets−stock
current liabiliies
Quick ratio is considered to be an ideal ratio to judge the liquidity of a business
because it does not include inventory or stock in the current assets and includes
only the cash and cash equivalents. It is possible that a company’s current assets
are more because of inventory which is excluded in the quick ratio (Reid and et.
al., 2008).
2
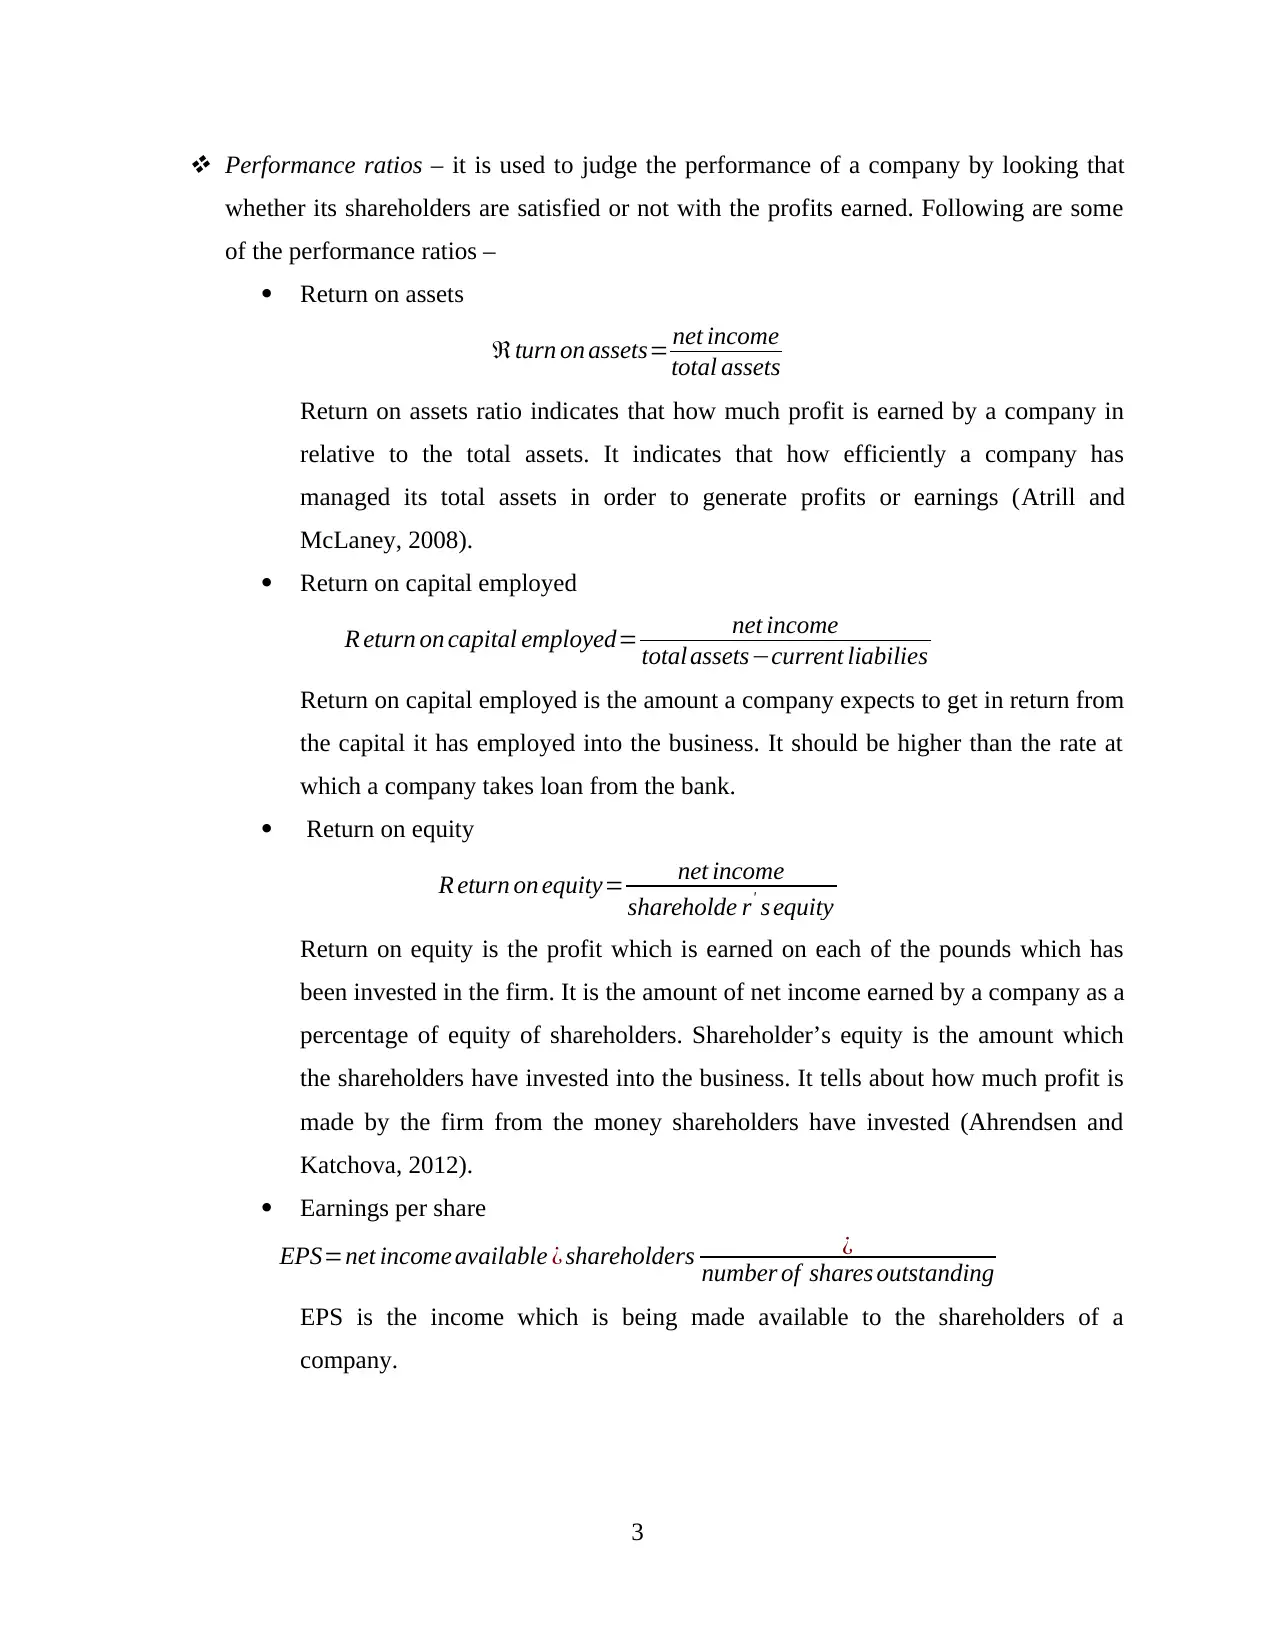
Performance ratios – it is used to judge the performance of a company by looking that
whether its shareholders are satisfied or not with the profits earned. Following are some
of the performance ratios –
Return on assets
ℜturn on assets= net income
total assets
Return on assets ratio indicates that how much profit is earned by a company in
relative to the total assets. It indicates that how efficiently a company has
managed its total assets in order to generate profits or earnings (Atrill and
McLaney, 2008).
Return on capital employed
R eturn on capital employed= net income
total assets−current liabilies
Return on capital employed is the amount a company expects to get in return from
the capital it has employed into the business. It should be higher than the rate at
which a company takes loan from the bank.
Return on equity
R eturn on equity= net income
shareholde r' s equity
Return on equity is the profit which is earned on each of the pounds which has
been invested in the firm. It is the amount of net income earned by a company as a
percentage of equity of shareholders. Shareholder’s equity is the amount which
the shareholders have invested into the business. It tells about how much profit is
made by the firm from the money shareholders have invested (Ahrendsen and
Katchova, 2012).
Earnings per share
EPS=net income available ¿ shareholders ¿
number of shares outstanding
EPS is the income which is being made available to the shareholders of a
company.
3
⊘ This is a preview!⊘
Do you want full access?
Subscribe today to unlock all pages.
Trusted by 1+ million students worldwide
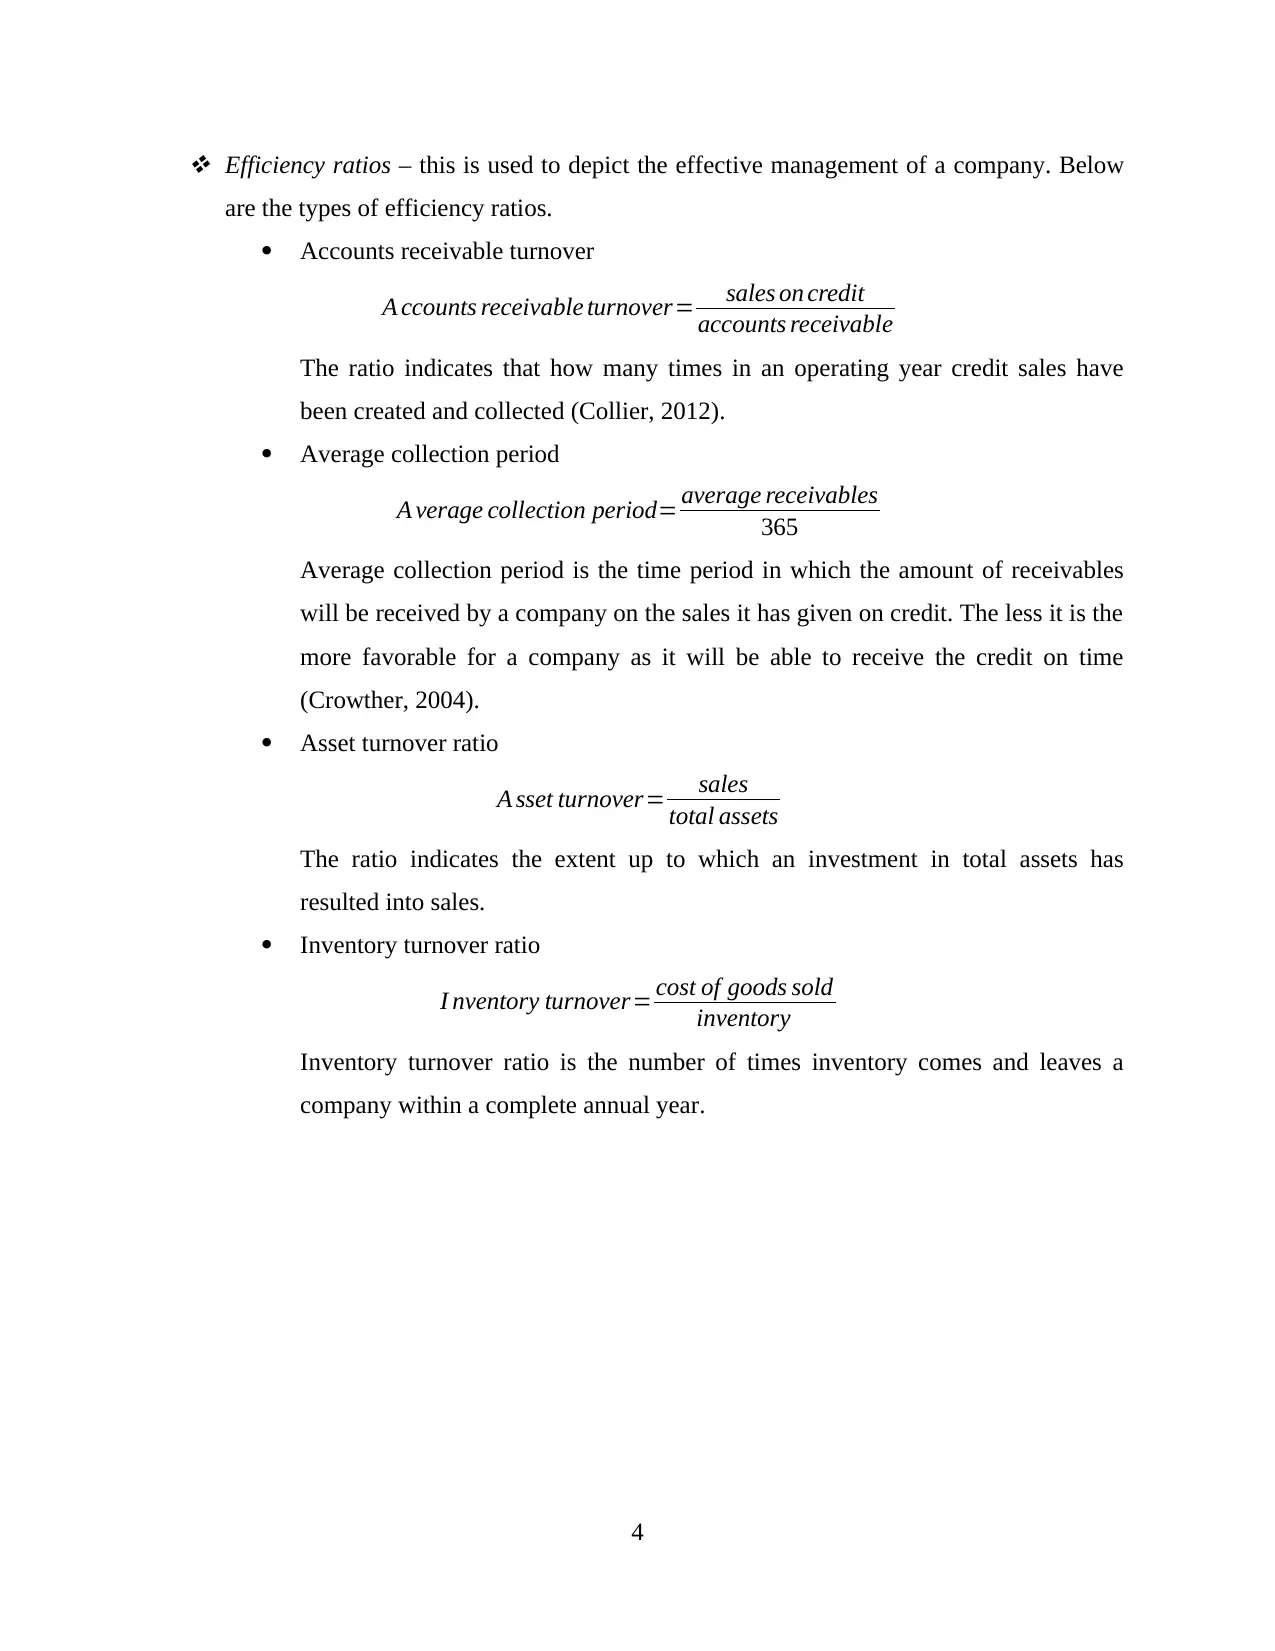
Efficiency ratios – this is used to depict the effective management of a company. Below
are the types of efficiency ratios.
Accounts receivable turnover
A ccounts receivable turnover= sales on credit
accounts receivable
The ratio indicates that how many times in an operating year credit sales have
been created and collected (Collier, 2012).
Average collection period
A verage collection period= average receivables
365
Average collection period is the time period in which the amount of receivables
will be received by a company on the sales it has given on credit. The less it is the
more favorable for a company as it will be able to receive the credit on time
(Crowther, 2004).
Asset turnover ratio
A sset turnover= sales
total assets
The ratio indicates the extent up to which an investment in total assets has
resulted into sales.
Inventory turnover ratio
I nventory turnover= cost of goods sold
inventory
Inventory turnover ratio is the number of times inventory comes and leaves a
company within a complete annual year.
4
Paraphrase This Document
Need a fresh take? Get an instant paraphrase of this document with our AI Paraphraser
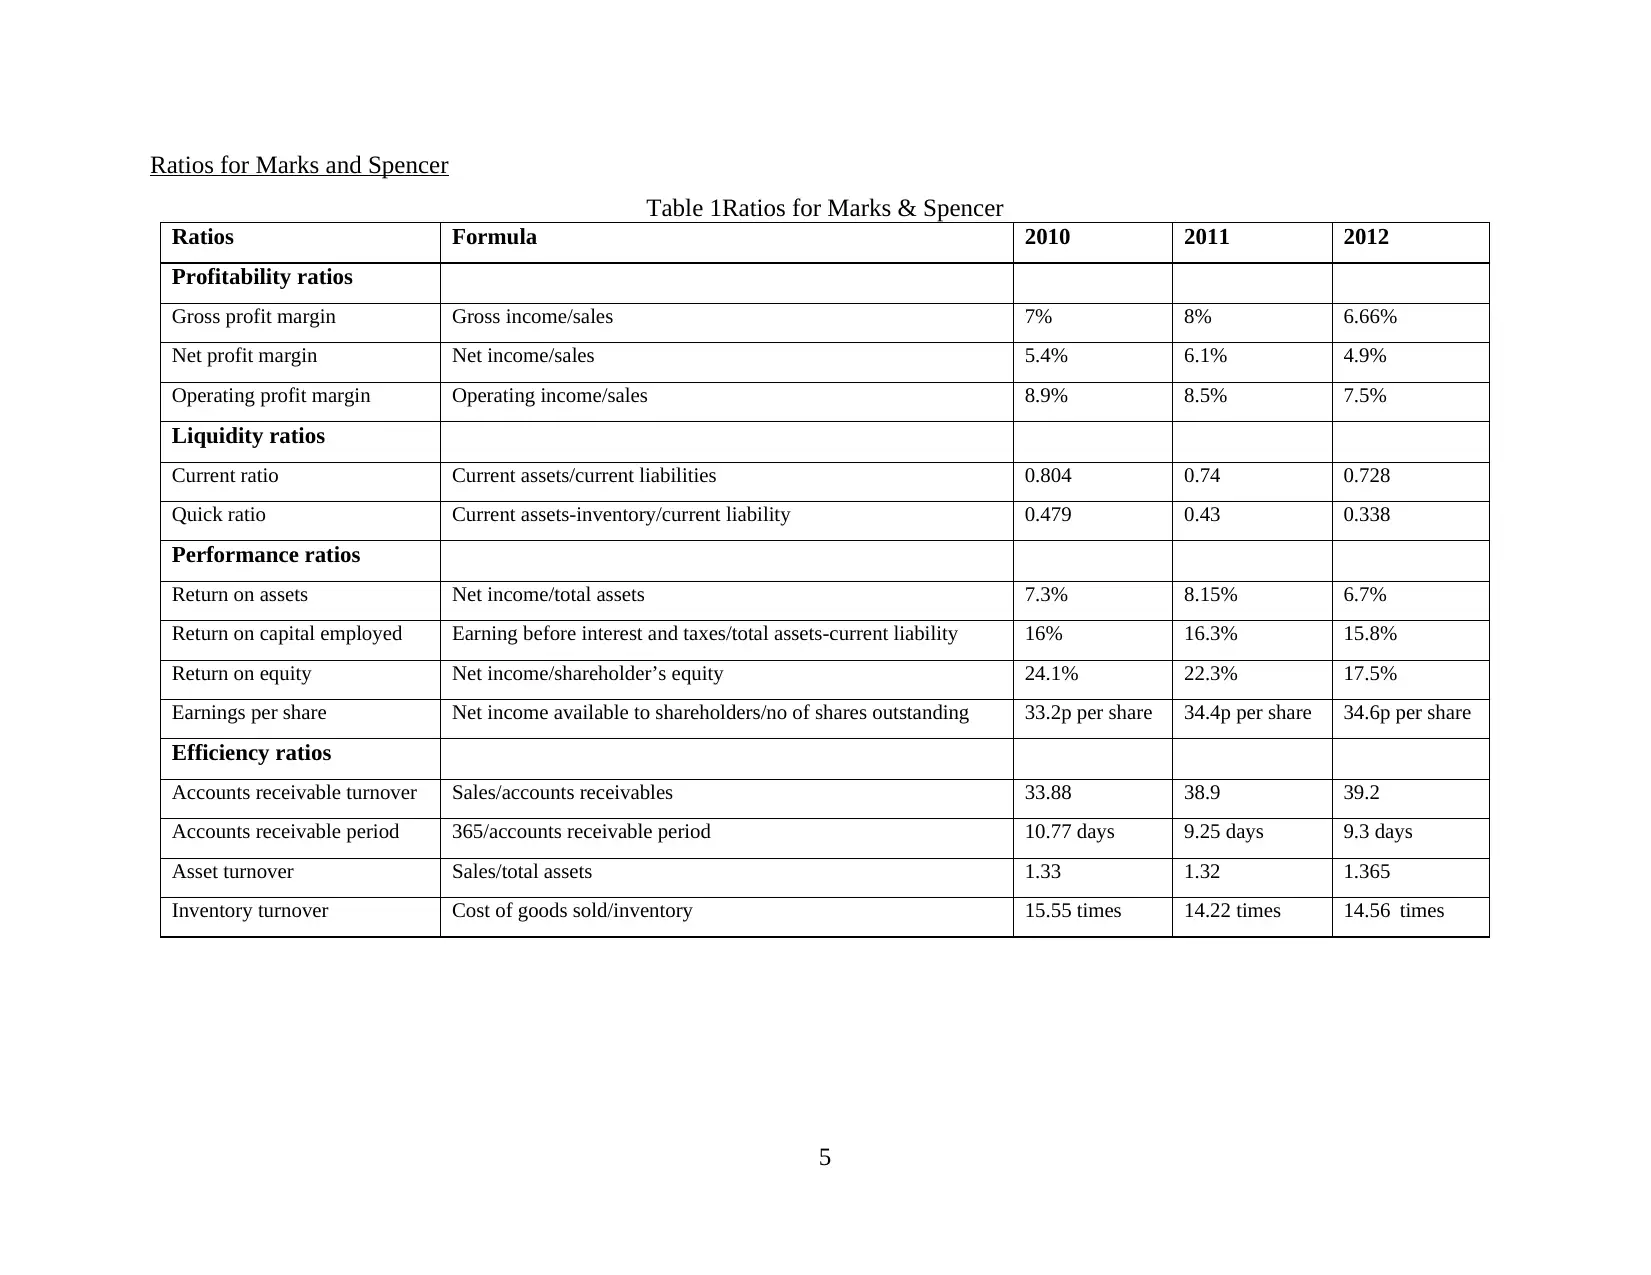
Ratios for Marks and Spencer
Table 1Ratios for Marks & Spencer
Ratios Formula 2010 2011 2012
Profitability ratios
Gross profit margin Gross income/sales 7% 8% 6.66%
Net profit margin Net income/sales 5.4% 6.1% 4.9%
Operating profit margin Operating income/sales 8.9% 8.5% 7.5%
Liquidity ratios
Current ratio Current assets/current liabilities 0.804 0.74 0.728
Quick ratio Current assets-inventory/current liability 0.479 0.43 0.338
Performance ratios
Return on assets Net income/total assets 7.3% 8.15% 6.7%
Return on capital employed Earning before interest and taxes/total assets-current liability 16% 16.3% 15.8%
Return on equity Net income/shareholder’s equity 24.1% 22.3% 17.5%
Earnings per share Net income available to shareholders/no of shares outstanding 33.2p per share 34.4p per share 34.6p per share
Efficiency ratios
Accounts receivable turnover Sales/accounts receivables 33.88 38.9 39.2
Accounts receivable period 365/accounts receivable period 10.77 days 9.25 days 9.3 days
Asset turnover Sales/total assets 1.33 1.32 1.365
Inventory turnover Cost of goods sold/inventory 15.55 times 14.22 times 14.56 times
5
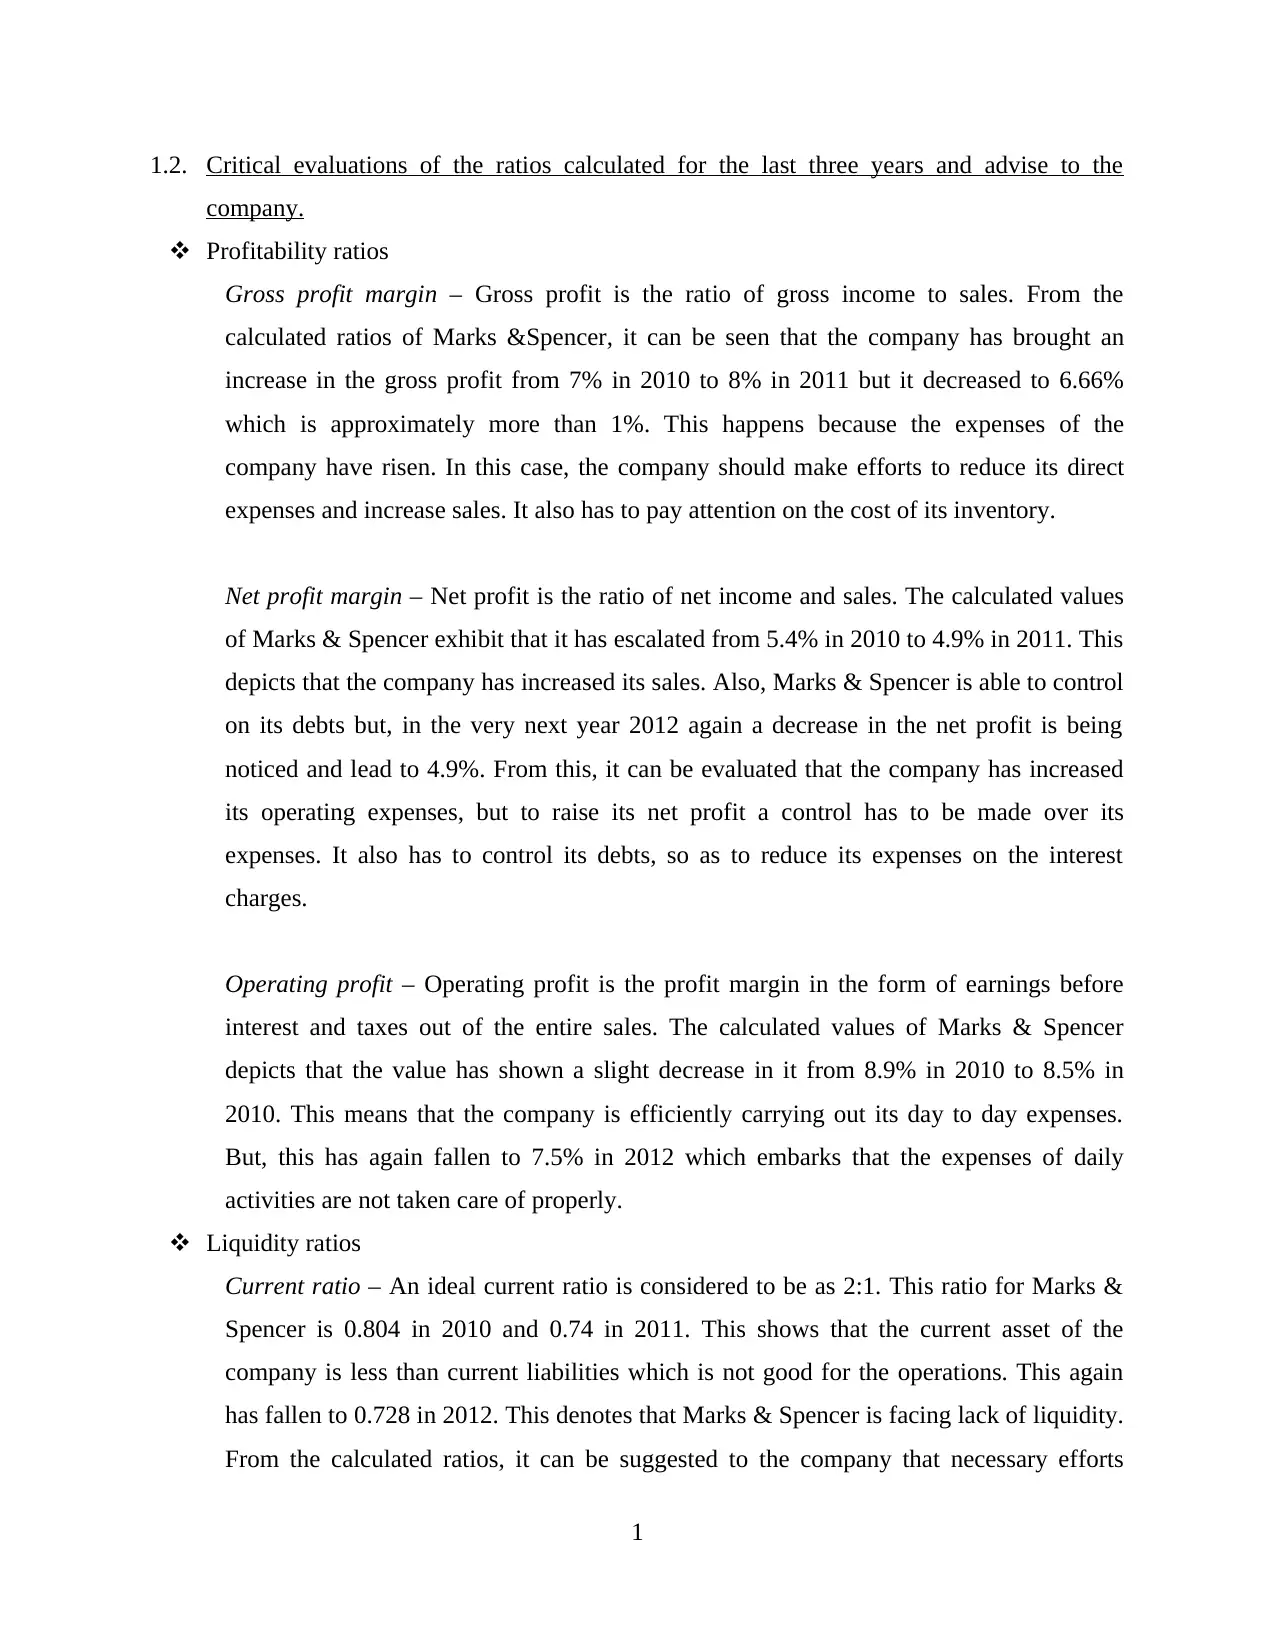
1.2. Critical evaluations of the ratios calculated for the last three years and advise to the
company.
Profitability ratios
Gross profit margin – Gross profit is the ratio of gross income to sales. From the
calculated ratios of Marks &Spencer, it can be seen that the company has brought an
increase in the gross profit from 7% in 2010 to 8% in 2011 but it decreased to 6.66%
which is approximately more than 1%. This happens because the expenses of the
company have risen. In this case, the company should make efforts to reduce its direct
expenses and increase sales. It also has to pay attention on the cost of its inventory.
Net profit margin – Net profit is the ratio of net income and sales. The calculated values
of Marks & Spencer exhibit that it has escalated from 5.4% in 2010 to 4.9% in 2011. This
depicts that the company has increased its sales. Also, Marks & Spencer is able to control
on its debts but, in the very next year 2012 again a decrease in the net profit is being
noticed and lead to 4.9%. From this, it can be evaluated that the company has increased
its operating expenses, but to raise its net profit a control has to be made over its
expenses. It also has to control its debts, so as to reduce its expenses on the interest
charges.
Operating profit – Operating profit is the profit margin in the form of earnings before
interest and taxes out of the entire sales. The calculated values of Marks & Spencer
depicts that the value has shown a slight decrease in it from 8.9% in 2010 to 8.5% in
2010. This means that the company is efficiently carrying out its day to day expenses.
But, this has again fallen to 7.5% in 2012 which embarks that the expenses of daily
activities are not taken care of properly.
Liquidity ratios
Current ratio – An ideal current ratio is considered to be as 2:1. This ratio for Marks &
Spencer is 0.804 in 2010 and 0.74 in 2011. This shows that the current asset of the
company is less than current liabilities which is not good for the operations. This again
has fallen to 0.728 in 2012. This denotes that Marks & Spencer is facing lack of liquidity.
From the calculated ratios, it can be suggested to the company that necessary efforts
1
⊘ This is a preview!⊘
Do you want full access?
Subscribe today to unlock all pages.
Trusted by 1+ million students worldwide
should be made to increase its current assets so that it has sufficient liquidity whenever
required.
Quick ratio - This ratio is considered to be a true indicator of liquidity maintained by a
company. An ideal quick ratio is 1:1. For Marks & Spencer, it is 0.479 and 0.43 in year
2010 and 2011 respectively. Then in the next year, it has fallen down to 0.33. This
denotes that not much part of inventory is included in the current assets of Marks &
Spencer, but on the other side the ratio also shows that cash and cash equivalents of the
company are quite low and current liability exceed them. Efforts have to be made by the
company to increase its liquid assets in order to raise its quick ratio.
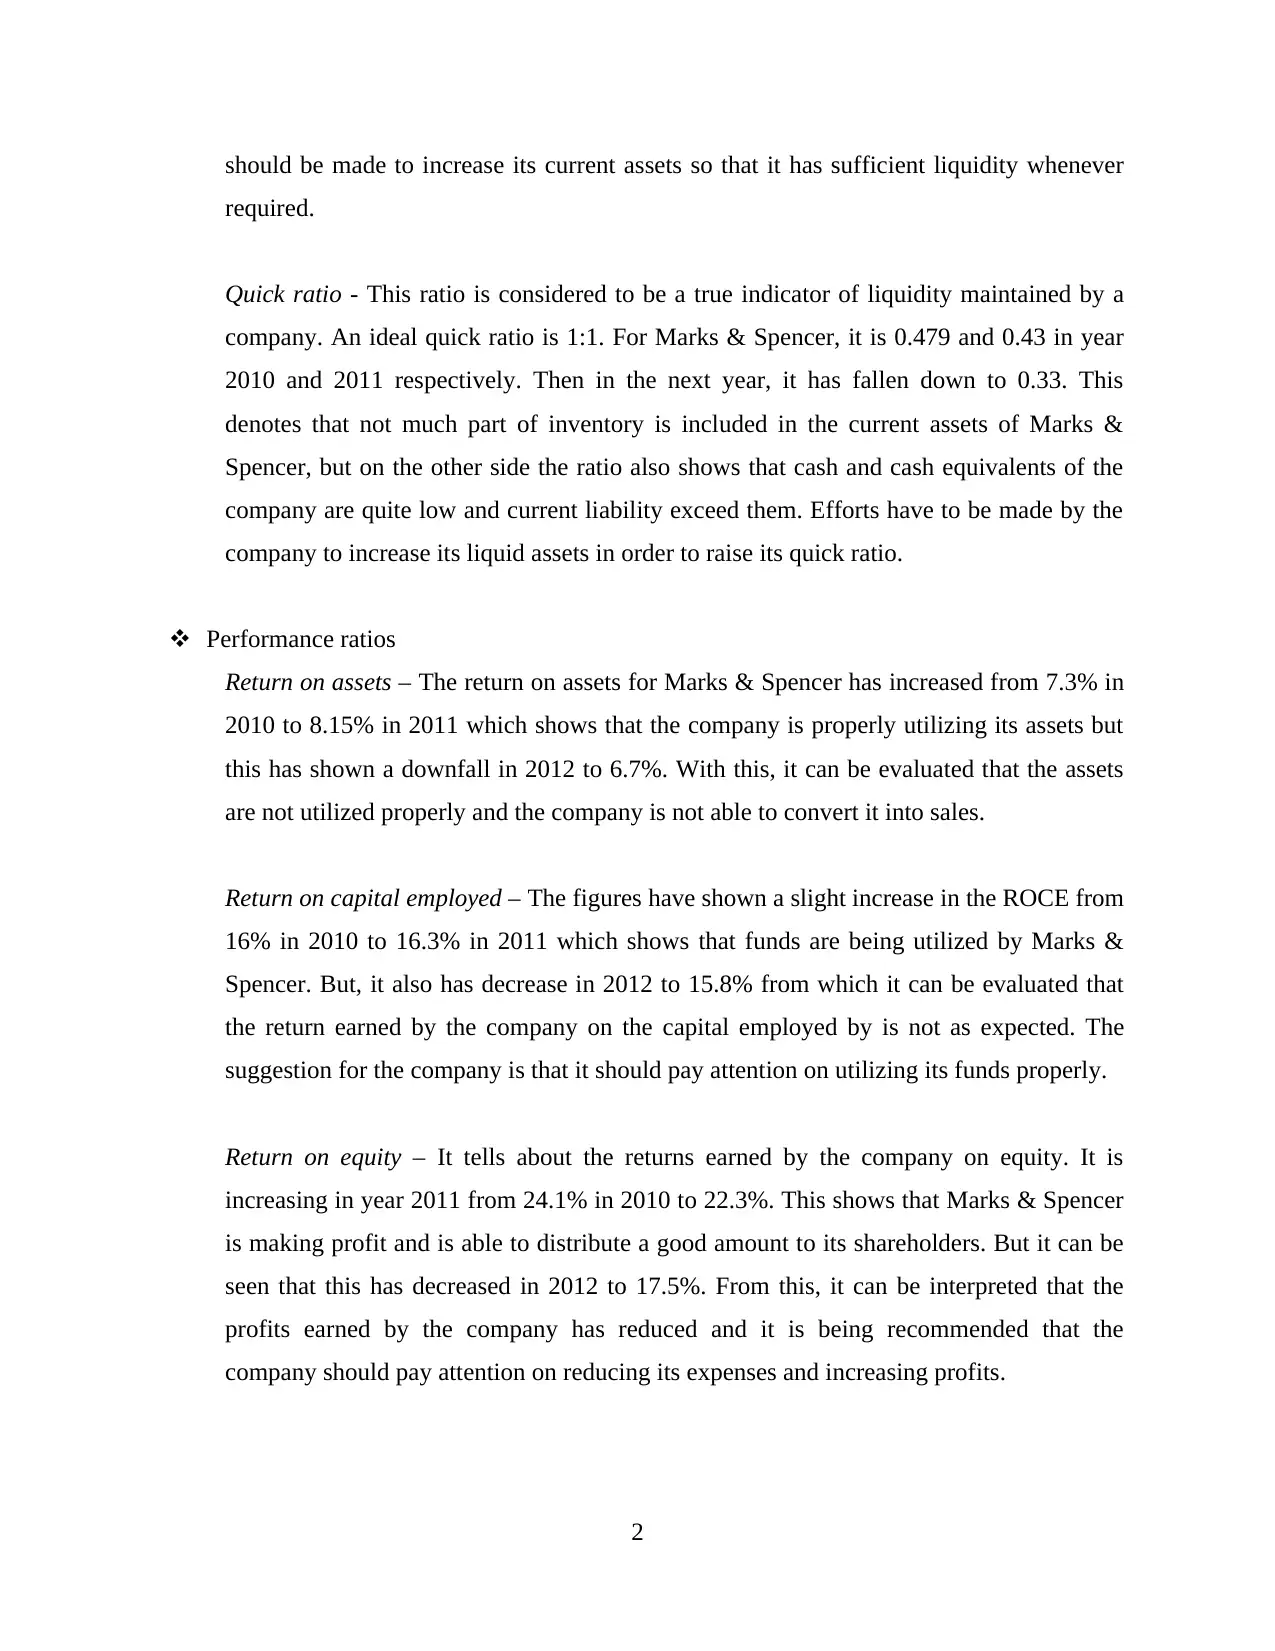
Performance ratios
Return on assets – The return on assets for Marks & Spencer has increased from 7.3% in
2010 to 8.15% in 2011 which shows that the company is properly utilizing its assets but
this has shown a downfall in 2012 to 6.7%. With this, it can be evaluated that the assets
are not utilized properly and the company is not able to convert it into sales.
Return on capital employed – The figures have shown a slight increase in the ROCE from
16% in 2010 to 16.3% in 2011 which shows that funds are being utilized by Marks &
Spencer. But, it also has decrease in 2012 to 15.8% from which it can be evaluated that
the return earned by the company on the capital employed by is not as expected. The
suggestion for the company is that it should pay attention on utilizing its funds properly.
Return on equity – It tells about the returns earned by the company on equity. It is
increasing in year 2011 from 24.1% in 2010 to 22.3%. This shows that Marks & Spencer
is making profit and is able to distribute a good amount to its shareholders. But it can be
seen that this has decreased in 2012 to 17.5%. From this, it can be interpreted that the
profits earned by the company has reduced and it is being recommended that the
company should pay attention on reducing its expenses and increasing profits.
2
required.
Quick ratio - This ratio is considered to be a true indicator of liquidity maintained by a
company. An ideal quick ratio is 1:1. For Marks & Spencer, it is 0.479 and 0.43 in year
2010 and 2011 respectively. Then in the next year, it has fallen down to 0.33. This
denotes that not much part of inventory is included in the current assets of Marks &
Spencer, but on the other side the ratio also shows that cash and cash equivalents of the
company are quite low and current liability exceed them. Efforts have to be made by the
company to increase its liquid assets in order to raise its quick ratio.
Performance ratios
Return on assets – The return on assets for Marks & Spencer has increased from 7.3% in
2010 to 8.15% in 2011 which shows that the company is properly utilizing its assets but
this has shown a downfall in 2012 to 6.7%. With this, it can be evaluated that the assets
are not utilized properly and the company is not able to convert it into sales.
Return on capital employed – The figures have shown a slight increase in the ROCE from
16% in 2010 to 16.3% in 2011 which shows that funds are being utilized by Marks &
Spencer. But, it also has decrease in 2012 to 15.8% from which it can be evaluated that
the return earned by the company on the capital employed by is not as expected. The
suggestion for the company is that it should pay attention on utilizing its funds properly.
Return on equity – It tells about the returns earned by the company on equity. It is
increasing in year 2011 from 24.1% in 2010 to 22.3%. This shows that Marks & Spencer
is making profit and is able to distribute a good amount to its shareholders. But it can be
seen that this has decreased in 2012 to 17.5%. From this, it can be interpreted that the
profits earned by the company has reduced and it is being recommended that the
company should pay attention on reducing its expenses and increasing profits.
2
Paraphrase This Document
Need a fresh take? Get an instant paraphrase of this document with our AI Paraphraser
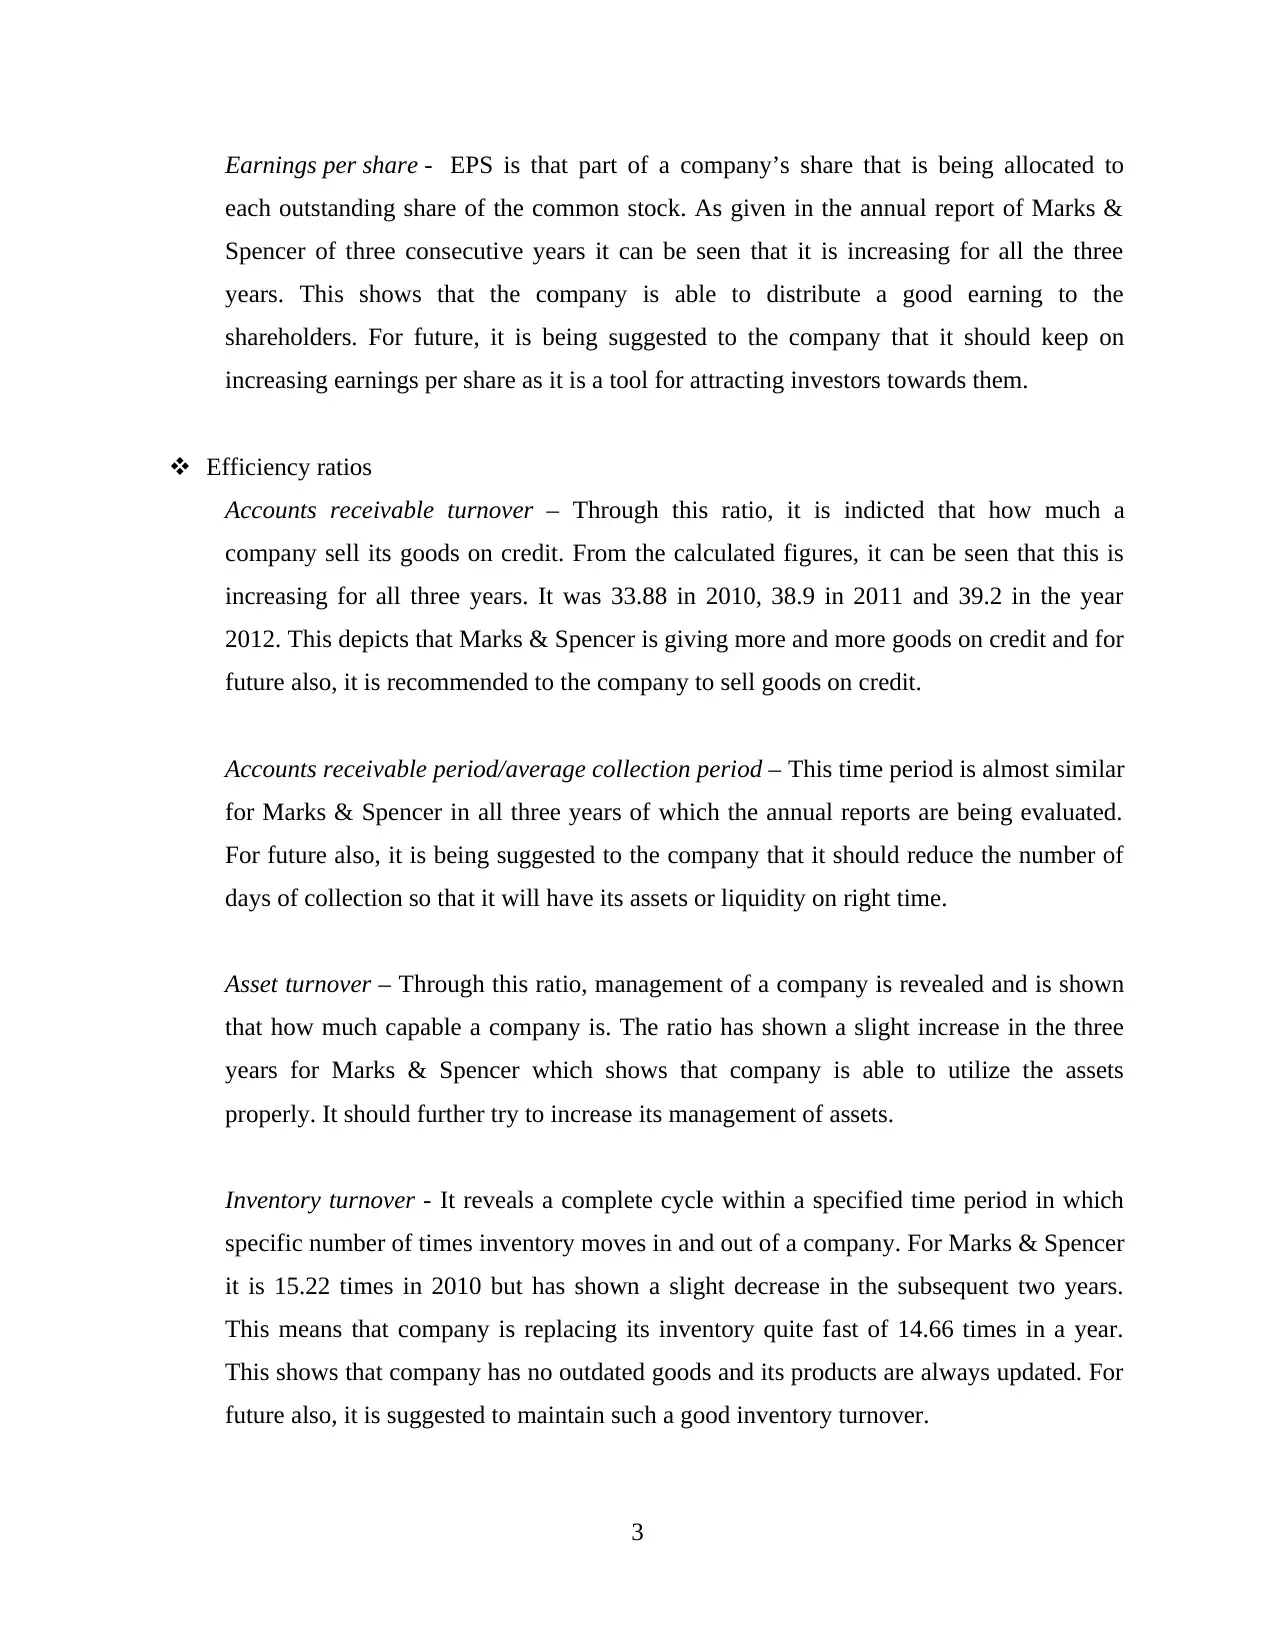
Earnings per share - EPS is that part of a company’s share that is being allocated to
each outstanding share of the common stock. As given in the annual report of Marks &
Spencer of three consecutive years it can be seen that it is increasing for all the three
years. This shows that the company is able to distribute a good earning to the
shareholders. For future, it is being suggested to the company that it should keep on
increasing earnings per share as it is a tool for attracting investors towards them.
Efficiency ratios
Accounts receivable turnover – Through this ratio, it is indicted that how much a
company sell its goods on credit. From the calculated figures, it can be seen that this is
increasing for all three years. It was 33.88 in 2010, 38.9 in 2011 and 39.2 in the year
2012. This depicts that Marks & Spencer is giving more and more goods on credit and for
future also, it is recommended to the company to sell goods on credit.
Accounts receivable period/average collection period – This time period is almost similar
for Marks & Spencer in all three years of which the annual reports are being evaluated.
For future also, it is being suggested to the company that it should reduce the number of
days of collection so that it will have its assets or liquidity on right time.
Asset turnover – Through this ratio, management of a company is revealed and is shown
that how much capable a company is. The ratio has shown a slight increase in the three
years for Marks & Spencer which shows that company is able to utilize the assets
properly. It should further try to increase its management of assets.
Inventory turnover - It reveals a complete cycle within a specified time period in which
specific number of times inventory moves in and out of a company. For Marks & Spencer
it is 15.22 times in 2010 but has shown a slight decrease in the subsequent two years.
This means that company is replacing its inventory quite fast of 14.66 times in a year.
This shows that company has no outdated goods and its products are always updated. For
future also, it is suggested to maintain such a good inventory turnover.
3
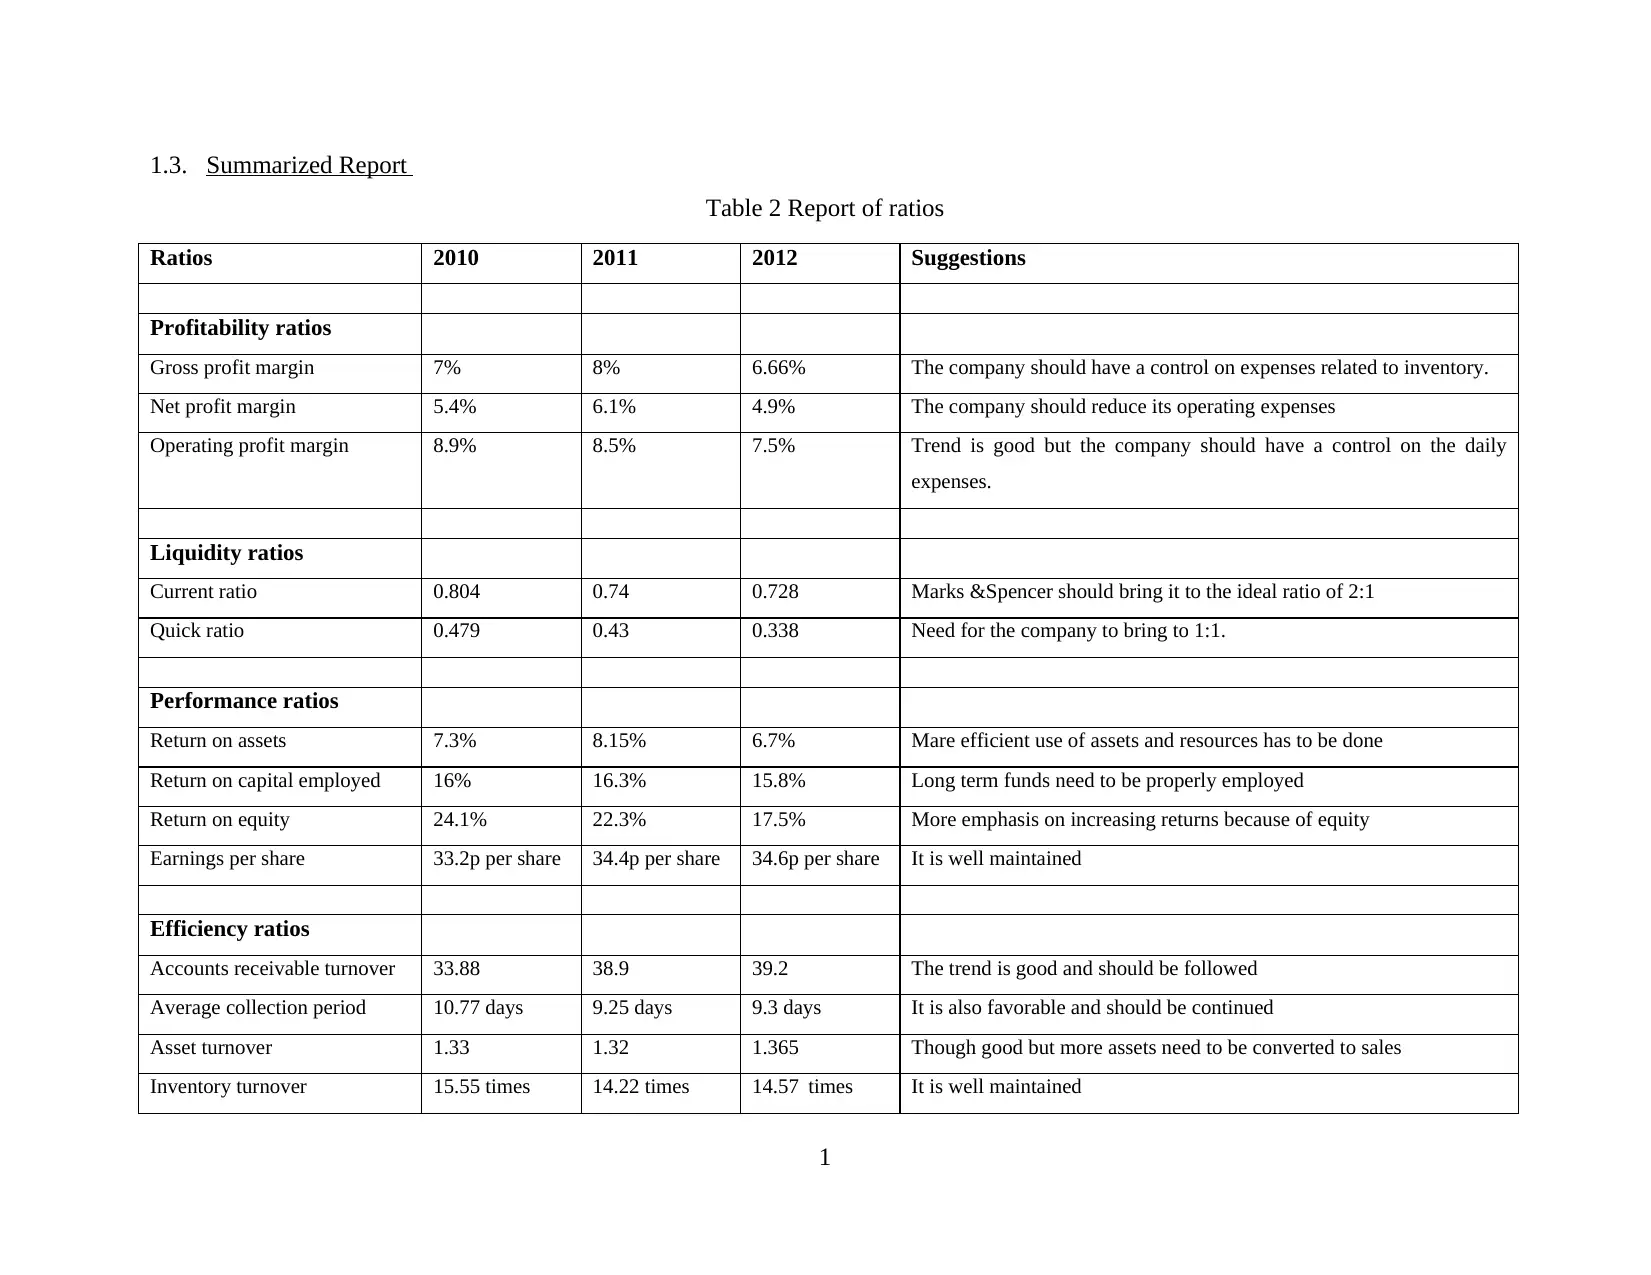
1.3. Summarized Report
Table 2 Report of ratios
Ratios 2010 2011 2012 Suggestions
Profitability ratios
Gross profit margin 7% 8% 6.66% The company should have a control on expenses related to inventory.
Net profit margin 5.4% 6.1% 4.9% The company should reduce its operating expenses
Operating profit margin 8.9% 8.5% 7.5% Trend is good but the company should have a control on the daily
expenses.
Liquidity ratios
Current ratio 0.804 0.74 0.728 Marks &Spencer should bring it to the ideal ratio of 2:1
Quick ratio 0.479 0.43 0.338 Need for the company to bring to 1:1.
Performance ratios
Return on assets 7.3% 8.15% 6.7% Mare efficient use of assets and resources has to be done
Return on capital employed 16% 16.3% 15.8% Long term funds need to be properly employed
Return on equity 24.1% 22.3% 17.5% More emphasis on increasing returns because of equity
Earnings per share 33.2p per share 34.4p per share 34.6p per share It is well maintained
Efficiency ratios
Accounts receivable turnover 33.88 38.9 39.2 The trend is good and should be followed
Average collection period 10.77 days 9.25 days 9.3 days It is also favorable and should be continued
Asset turnover 1.33 1.32 1.365 Though good but more assets need to be converted to sales
Inventory turnover 15.55 times 14.22 times 14.57 times It is well maintained
1
⊘ This is a preview!⊘
Do you want full access?
Subscribe today to unlock all pages.
Trusted by 1+ million students worldwide
1 out of 28
Related Documents


Your All-in-One AI-Powered Toolkit for Academic Success.
+13062052269
info@desklib.com
Available 24*7 on WhatsApp / Email
![[object Object]](/_next/static/media/star-bottom.7253800d.svg)
Unlock your academic potential
Copyright © 2020–2026 A2Z Services. All Rights Reserved. Developed and managed by ZUCOL.