Comparative Financial Analysis: McDonald's and Wendy's (2016 & 2017)
VerifiedAdded on 2022/09/07
|12
|2534
|21
Report
AI Summary
This report presents a detailed financial analysis comparing the performance of McDonald's and Wendy's for the years 2016 and 2017. It begins with an introduction to both companies, followed by a comprehensive ratio analysis. The ratio analysis covers key areas including liquidity, profitability, efficiency, solvency, and market value ratios. The liquidity section assesses the companies' ability to meet short-term obligations, while profitability examines net profit margins, return on equity, and operating profit margins. Efficiency ratios evaluate how effectively the companies manage their assets and inventory. Solvency ratios analyze debt levels and financial leverage. Market value ratios provide insights into the companies' market positions. The report concludes with recommendations for improvement and an overall assessment of each company's financial health, highlighting areas where McDonald's and Wendy's can enhance their performance and make strategic financial decisions. The analysis is supported by data extracted from the companies' annual reports.
Running Head: FINANCIAL ANALYSIS
FINANCIAL ANALYSIS
FINANCIAL ANALYSIS
Paraphrase This Document
Need a fresh take? Get an instant paraphrase of this document with our AI Paraphraser
Running Head: FINANCIAL ANALYSIS
Table of Contents
Introduction......................................................................................................................................3
Ratio Analysis..................................................................................................................................3
Liquidity..........................................................................................................................................4
Profitability......................................................................................................................................4
Efficiency.........................................................................................................................................6
Solvency..........................................................................................................................................7
Market Value ratios.........................................................................................................................7
Recommendations and Conclusion..................................................................................................8
References......................................................................................................................................10
Running Head: FINANCIAL ANALYSIS
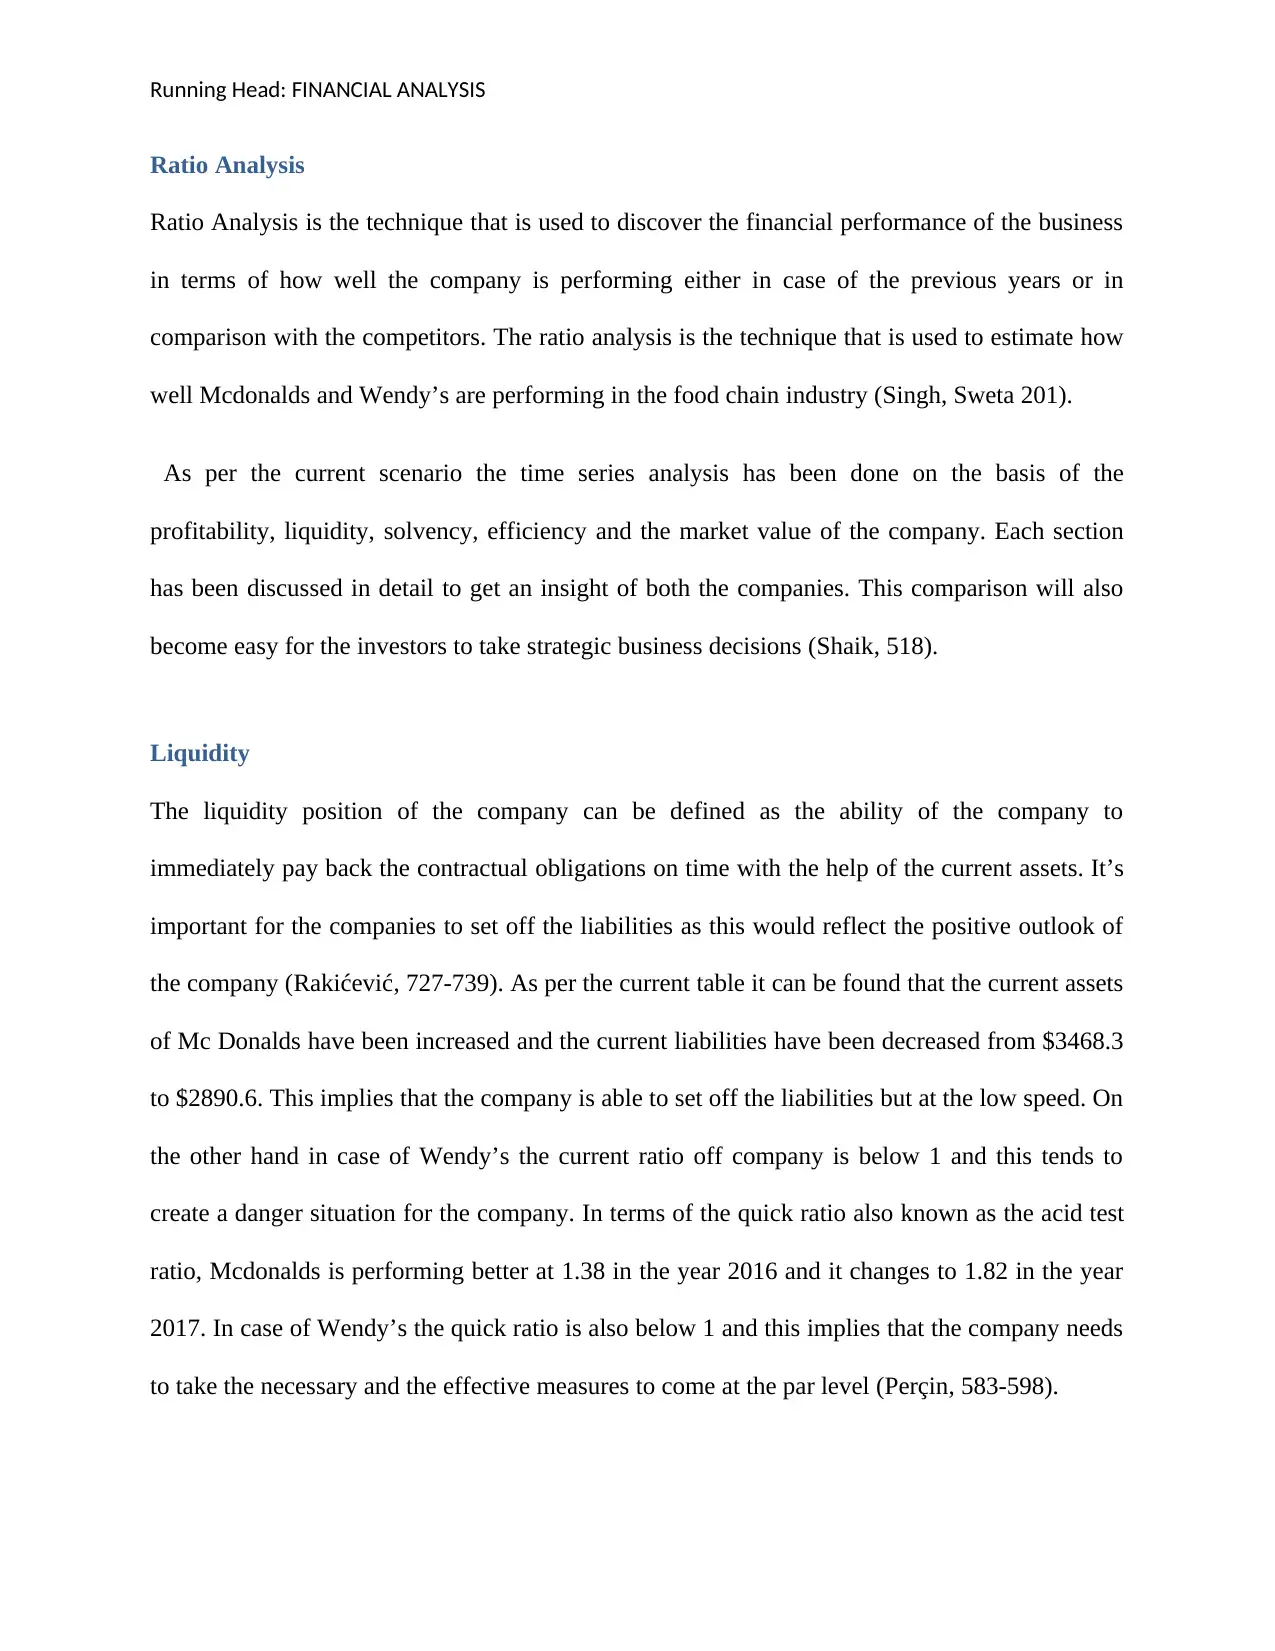
Introduction
McDonald's is am American based company which came into existence in the year 1940. This
major fast food chain was opened by Richard and Maurice McDonald, in San Bernardino,
California, United States. Earlier this fast food chain was operating as hamburger outlet and
thereafter it got changed into the franchise. The logo of the company defines the picture of
Golden Arches which was evolved in the year 1953, at Phoenix, which can be found in Arizona.
As per the current scenario, the currently the company is having the income of $5192.3 for the
financial year 2017. With the team of 235000 employees, the company has performed so well
and covered the world wide scenario (Yahoo Is Now Part of Verizon Media).
Dave Thomas is behind the introduction of Wendy's as an American international fast food
restaurant chain. Came after McD in the year 1969 in November, in Columbus, Ohio, the
company also transferred its headquarters to Dublin, Ohio, on January 29, 2006. This company
became the third largest food chain in terms of hamburger and approximately has touched 6711
locations. Notwithstanding the new proprietorship, Wendy's home office stayed in Dublin.
Beforehand, Wendy's had dismissed in excess of two buyout offers from Triarc. Following the
merger, Triarc got known as Wendy's/Arby's Group, and later as The Wendy's Company
(S1.Q4cdn.Com, 2019).
In this report a detailed analysis of the financial performance of both the companies have been
undertaken in detail.
⊘ This is a preview!⊘
Do you want full access?
Subscribe today to unlock all pages.
Trusted by 1+ million students worldwide
Running Head: FINANCIAL ANALYSIS
Ratio Analysis
Ratio Analysis is the technique that is used to discover the financial performance of the business
in terms of how well the company is performing either in case of the previous years or in
comparison with the competitors. The ratio analysis is the technique that is used to estimate how
well Mcdonalds and Wendy’s are performing in the food chain industry (Singh, Sweta 201).
As per the current scenario the time series analysis has been done on the basis of the
profitability, liquidity, solvency, efficiency and the market value of the company. Each section
has been discussed in detail to get an insight of both the companies. This comparison will also
become easy for the investors to take strategic business decisions (Shaik, 518).
Liquidity
The liquidity position of the company can be defined as the ability of the company to
immediately pay back the contractual obligations on time with the help of the current assets. It’s
important for the companies to set off the liabilities as this would reflect the positive outlook of
the company (Rakićević, 727-739). As per the current table it can be found that the current assets
of Mc Donalds have been increased and the current liabilities have been decreased from $3468.3
to $2890.6. This implies that the company is able to set off the liabilities but at the low speed. On
the other hand in case of Wendy’s the current ratio off company is below 1 and this tends to
create a danger situation for the company. In terms of the quick ratio also known as the acid test
ratio, Mcdonalds is performing better at 1.38 in the year 2016 and it changes to 1.82 in the year
2017. In case of Wendy’s the quick ratio is also below 1 and this implies that the company needs
to take the necessary and the effective measures to come at the par level (Perçin, 583-598).
Paraphrase This Document
Need a fresh take? Get an instant paraphrase of this document with our AI Paraphraser
Running Head: FINANCIAL ANALYSIS
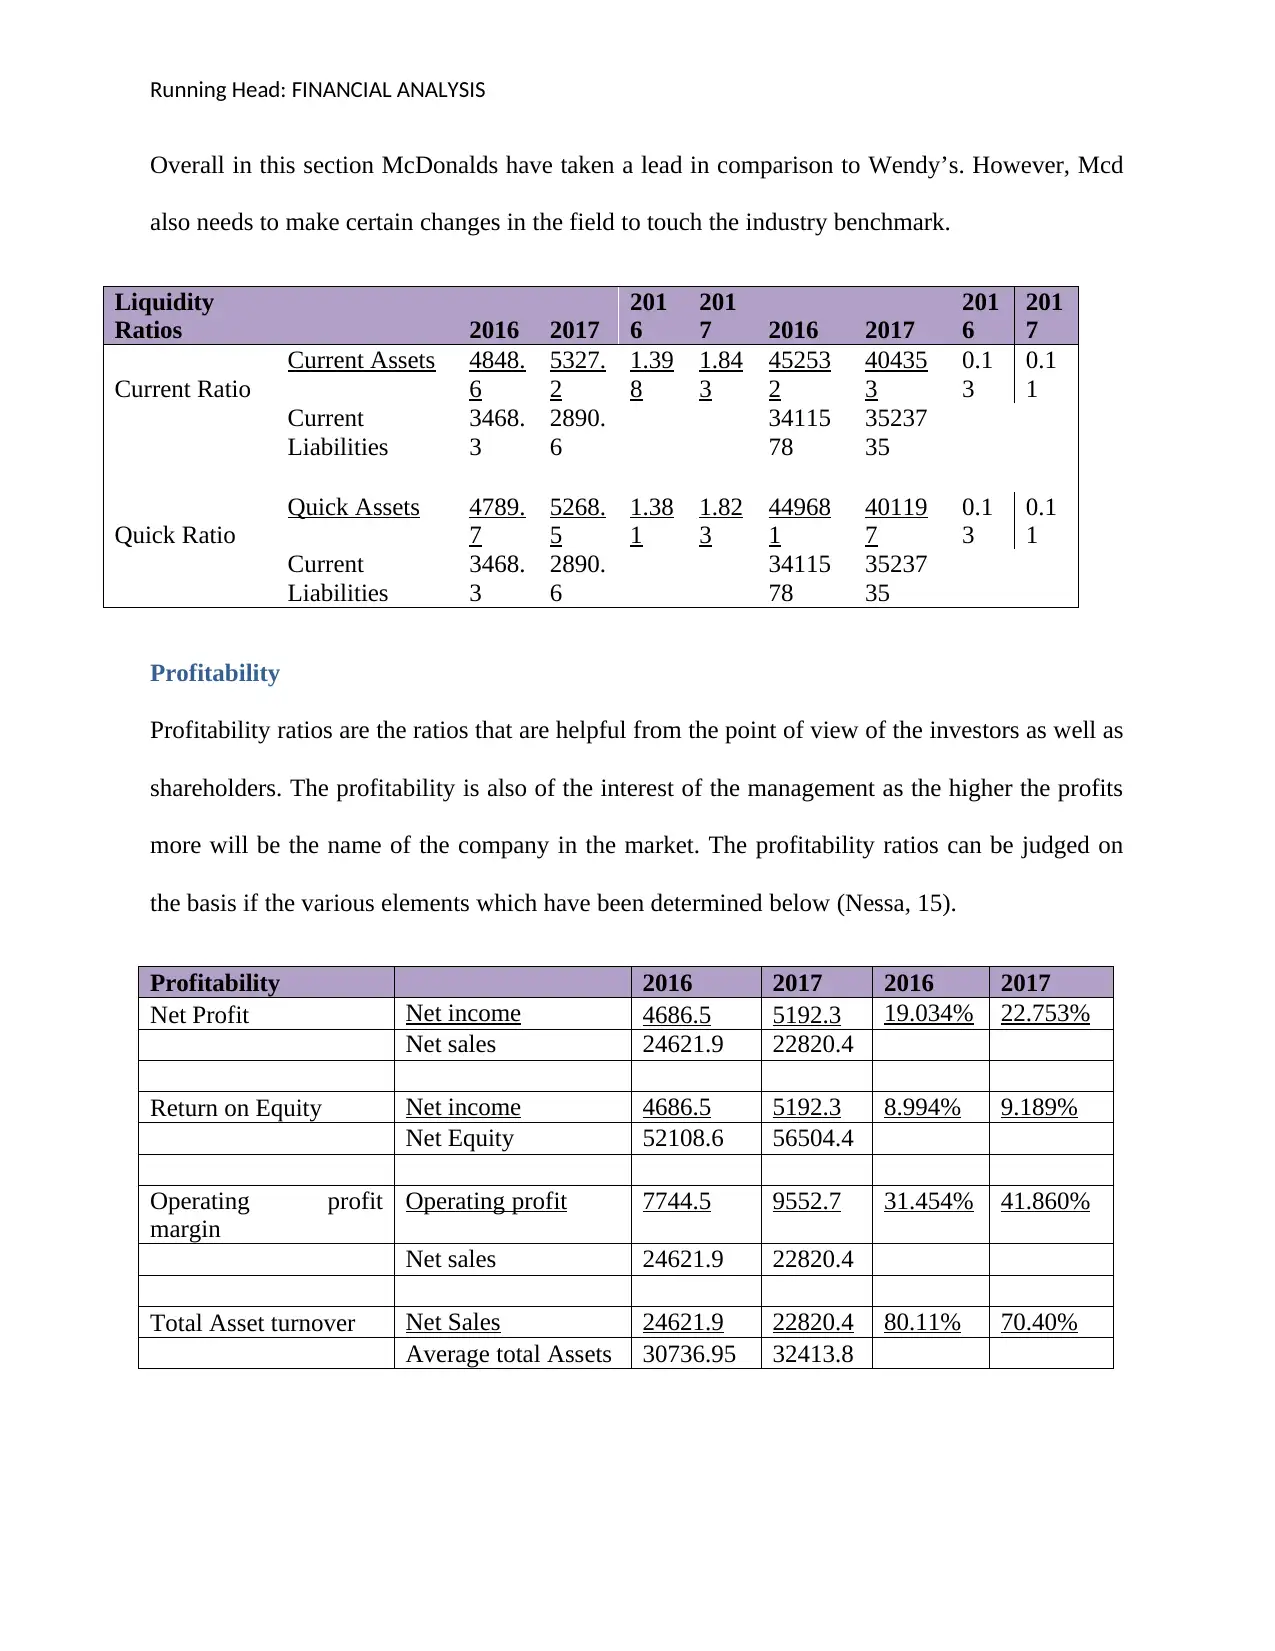
Overall in this section McDonalds have taken a lead in comparison to Wendy’s. However, Mcd
also needs to make certain changes in the field to touch the industry benchmark.
Liquidity
Ratios 2016 2017
201
6
201
7 2016 2017
201
6
201
7
Current Ratio
Current Assets 4848.
6
5327.
2
1.39
8
1.84
3
45253
2
40435
3
0.1
3
0.1
1
Current
Liabilities
3468.
3
2890.
6
34115
78
35237
35
Quick Ratio
Quick Assets 4789.
7
5268.
5
1.38
1
1.82
3
44968
1
40119
7
0.1
3
0.1
1
Current
Liabilities
3468.
3
2890.
6
34115
78
35237
35
Profitability
Profitability ratios are the ratios that are helpful from the point of view of the investors as well as
shareholders. The profitability is also of the interest of the management as the higher the profits
more will be the name of the company in the market. The profitability ratios can be judged on
the basis if the various elements which have been determined below (Nessa, 15).
Profitability 2016 2017 2016 2017
Net Profit Net income 4686.5 5192.3 19.034% 22.753%
Net sales 24621.9 22820.4
Return on Equity Net income 4686.5 5192.3 8.994% 9.189%
Net Equity 52108.6 56504.4
Operating profit
margin
Operating profit 7744.5 9552.7 31.454% 41.860%
Net sales 24621.9 22820.4
Total Asset turnover Net Sales 24621.9 22820.4 80.11% 70.40%
Average total Assets 30736.95 32413.8
Running Head: FINANCIAL ANALYSIS
As per the current position the profitability position in terms of the net profit margin of the
company seems to have increased in comparison to the previous year. The net profit margin in
the year 2016 is 19.03% whereas the same have been increased to 22.75%. Further, the return on
equity is the ratio which seems to have increased in comparison to the previous year from 8.99%
to 9.18% (Lim, 293-298). This means the shareholders can avail the greater market share for the
investments made by them. The operating profit margin is also necessary in order to figure out
the raw profits that have been made by the company over the period of two years. The operating
profit margin of the company have also seen an upwards direction due to decrease in the trading
costs and the other administrative charges. Further it has been increased from 31.455 to 41.86%
and hence, this means that the operating workings of the companies are working in the better
manner and more can be done to maintain the overall consistency for the project (Kaur, 4327-
4348). The total asset turnover ratio is the ratio that is also useful in defining how well the assets
of the companies are put to use by the management in order to generate more sales and the more
revenue for the company. The sales have decreased and the assets keep on increasing, which
showcases the inverse relationship between the sales and the assets. The assets are not used
judiciously and kept idle (S1.Q4cdn.Com, 2019).
Overall in this scenario the profitability of the business of the company has been smooth, but the
reduction in sales can lead to a shortfall in the income of the business in the later years. There are
certain improvement strategies which need to be implemented by the business in order to have a
sound and on-going business (Hadiwidjaja, Dwiyani 106).
⊘ This is a preview!⊘
Do you want full access?
Subscribe today to unlock all pages.
Trusted by 1+ million students worldwide
Running Head: FINANCIAL ANALYSIS
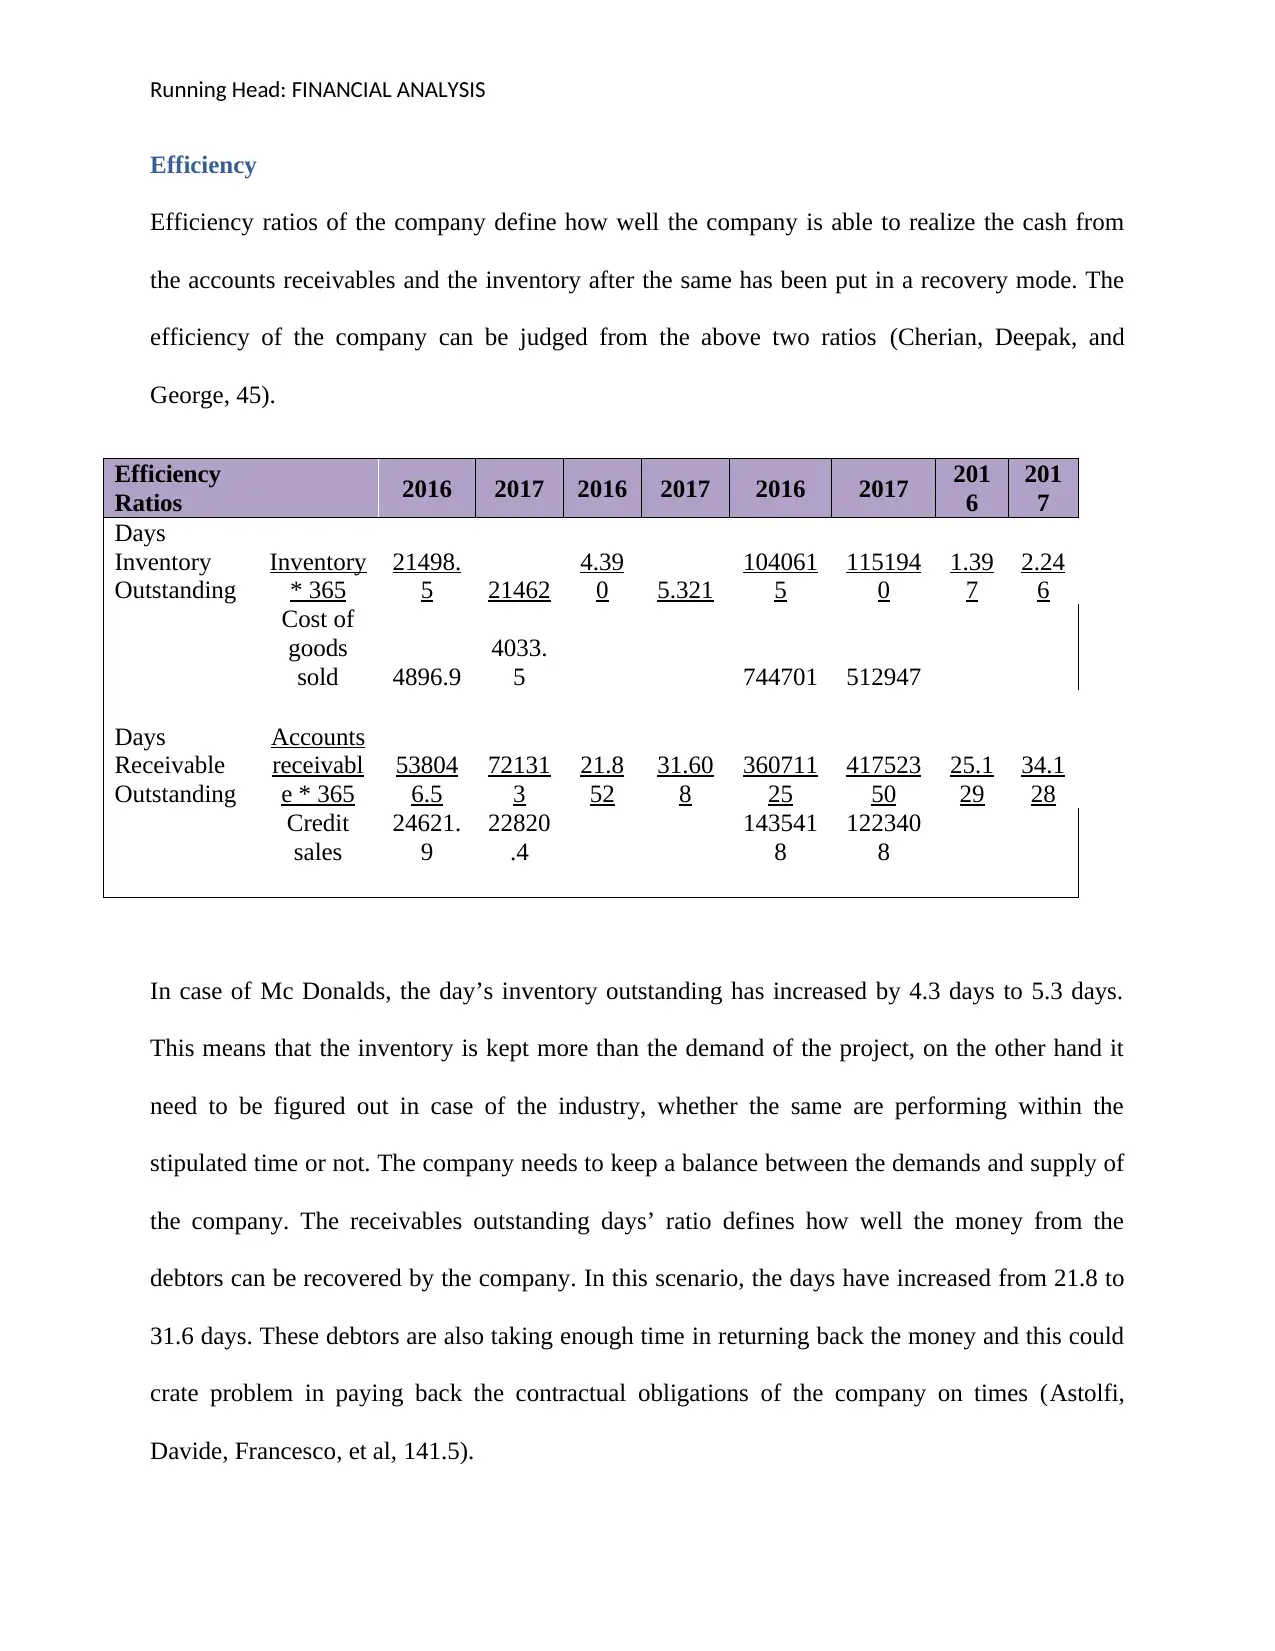
Efficiency
Efficiency ratios of the company define how well the company is able to realize the cash from
the accounts receivables and the inventory after the same has been put in a recovery mode. The
efficiency of the company can be judged from the above two ratios (Cherian, Deepak, and
George, 45).
Efficiency
Ratios 2016 2017 2016 2017 2016 2017 201
6
201
7
Days
Inventory
Outstanding
Inventory
* 365
21498.
5 21462
4.39
0 5.321
104061
5
115194
0
1.39
7
2.24
6
Cost of
goods
sold 4896.9
4033.
5 744701 512947
Days
Receivable
Outstanding
Accounts
receivabl
e * 365
53804
6.5
72131
3
21.8
52
31.60
8
360711
25
417523
50
25.1
29
34.1
28
Credit
sales
24621.
9
22820
.4
143541
8
122340
8
In case of Mc Donalds, the day’s inventory outstanding has increased by 4.3 days to 5.3 days.
This means that the inventory is kept more than the demand of the project, on the other hand it
need to be figured out in case of the industry, whether the same are performing within the
stipulated time or not. The company needs to keep a balance between the demands and supply of
the company. The receivables outstanding days’ ratio defines how well the money from the
debtors can be recovered by the company. In this scenario, the days have increased from 21.8 to
31.6 days. These debtors are also taking enough time in returning back the money and this could
crate problem in paying back the contractual obligations of the company on times (Astolfi,
Davide, Francesco, et al, 141.5).
Efficiency
Efficiency ratios of the company define how well the company is able to realize the cash from
the accounts receivables and the inventory after the same has been put in a recovery mode. The
efficiency of the company can be judged from the above two ratios (Cherian, Deepak, and
George, 45).
Efficiency
Ratios 2016 2017 2016 2017 2016 2017 201
6
201
7
Days
Inventory
Outstanding
Inventory
* 365
21498.
5 21462
4.39
0 5.321
104061
5
115194
0
1.39
7
2.24
6
Cost of
goods
sold 4896.9
4033.
5 744701 512947
Days
Receivable
Outstanding
Accounts
receivabl
e * 365
53804
6.5
72131
3
21.8
52
31.60
8
360711
25
417523
50
25.1
29
34.1
28
Credit
sales
24621.
9
22820
.4
143541
8
122340
8
In case of Mc Donalds, the day’s inventory outstanding has increased by 4.3 days to 5.3 days.
This means that the inventory is kept more than the demand of the project, on the other hand it
need to be figured out in case of the industry, whether the same are performing within the
stipulated time or not. The company needs to keep a balance between the demands and supply of
the company. The receivables outstanding days’ ratio defines how well the money from the
debtors can be recovered by the company. In this scenario, the days have increased from 21.8 to
31.6 days. These debtors are also taking enough time in returning back the money and this could
crate problem in paying back the contractual obligations of the company on times (Astolfi,
Davide, Francesco, et al, 141.5).
Paraphrase This Document
Need a fresh take? Get an instant paraphrase of this document with our AI Paraphraser
Running Head: FINANCIAL ANALYSIS
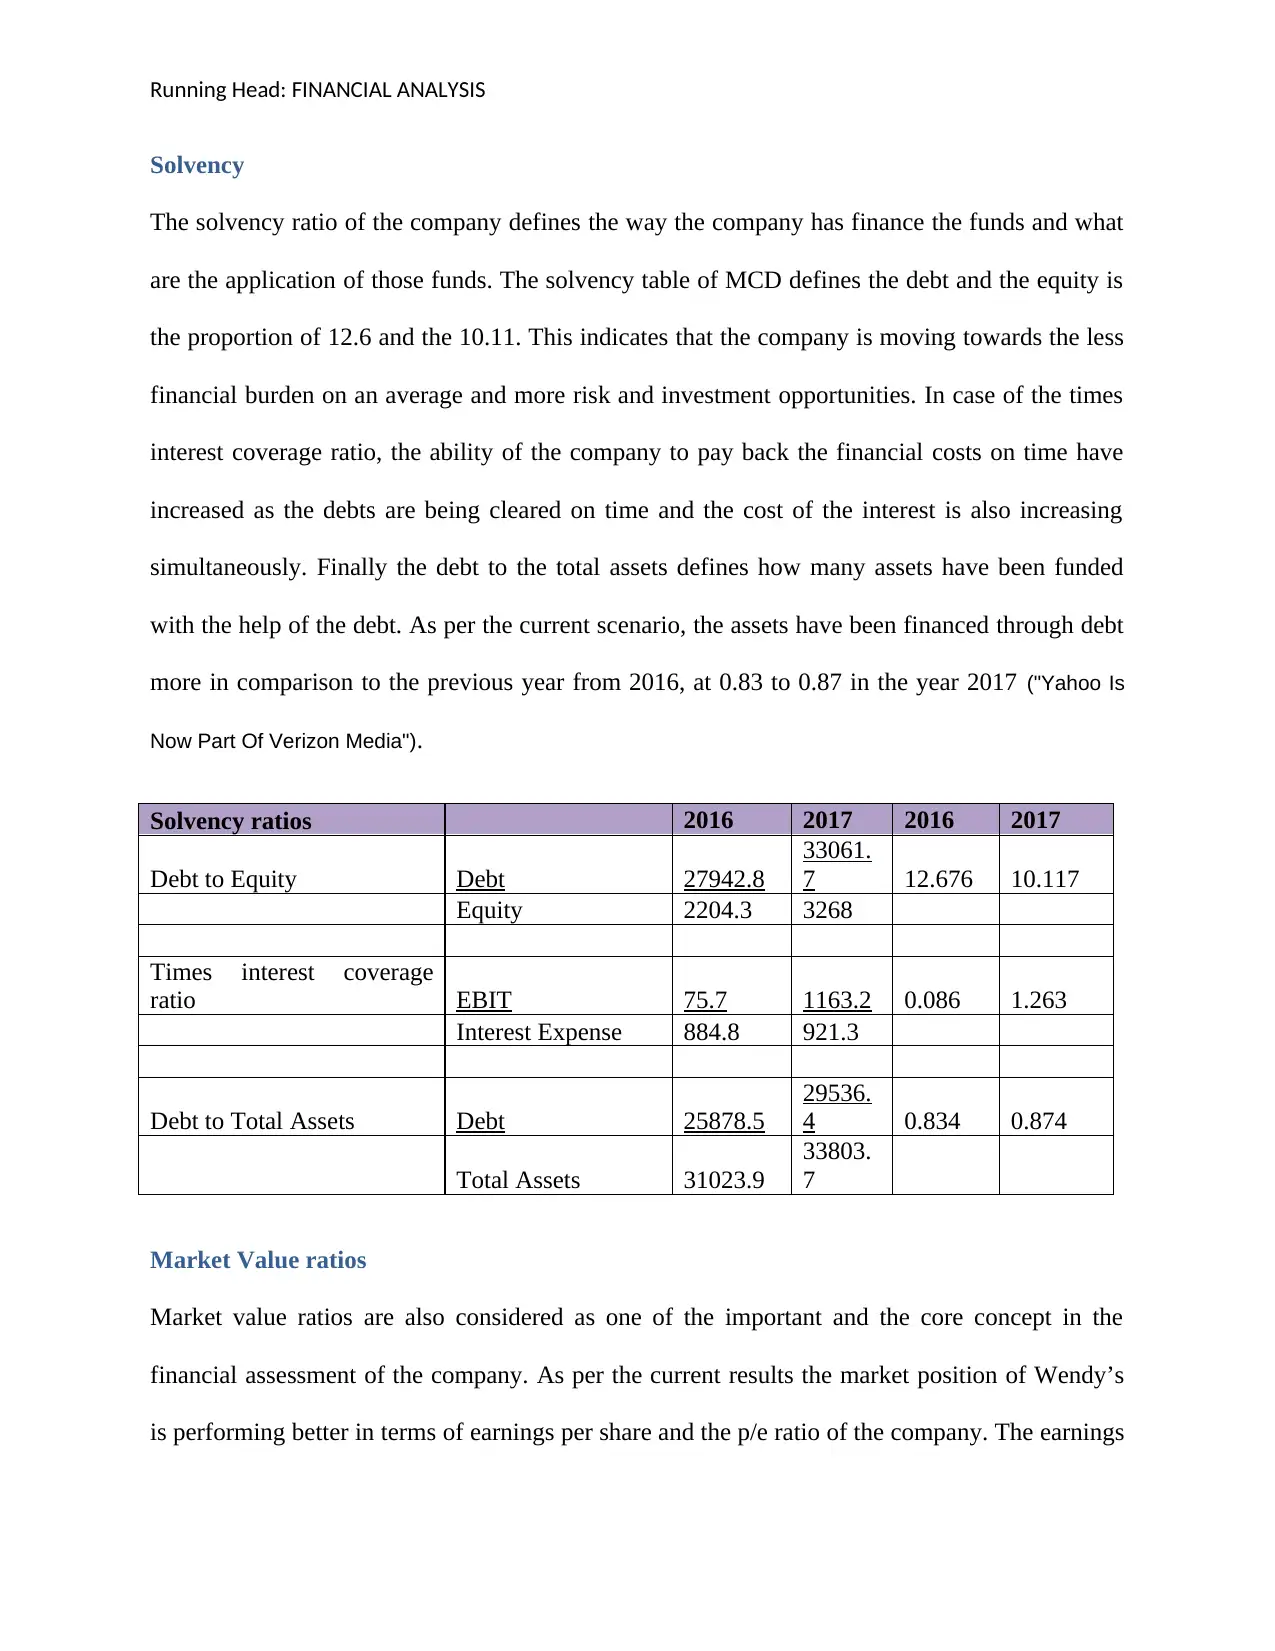
Solvency
The solvency ratio of the company defines the way the company has finance the funds and what
are the application of those funds. The solvency table of MCD defines the debt and the equity is
the proportion of 12.6 and the 10.11. This indicates that the company is moving towards the less
financial burden on an average and more risk and investment opportunities. In case of the times
interest coverage ratio, the ability of the company to pay back the financial costs on time have
increased as the debts are being cleared on time and the cost of the interest is also increasing
simultaneously. Finally the debt to the total assets defines how many assets have been funded
with the help of the debt. As per the current scenario, the assets have been financed through debt
more in comparison to the previous year from 2016, at 0.83 to 0.87 in the year 2017 ("Yahoo Is
Now Part Of Verizon Media").
Solvency ratios 2016 2017 2016 2017
Debt to Equity Debt 27942.8
33061.
7 12.676 10.117
Equity 2204.3 3268
Times interest coverage
ratio EBIT 75.7 1163.2 0.086 1.263
Interest Expense 884.8 921.3
Debt to Total Assets Debt 25878.5
29536.
4 0.834 0.874
Total Assets 31023.9
33803.
7
Market Value ratios
Market value ratios are also considered as one of the important and the core concept in the
financial assessment of the company. As per the current results the market position of Wendy’s
is performing better in terms of earnings per share and the p/e ratio of the company. The earnings
Running Head: FINANCIAL ANALYSIS
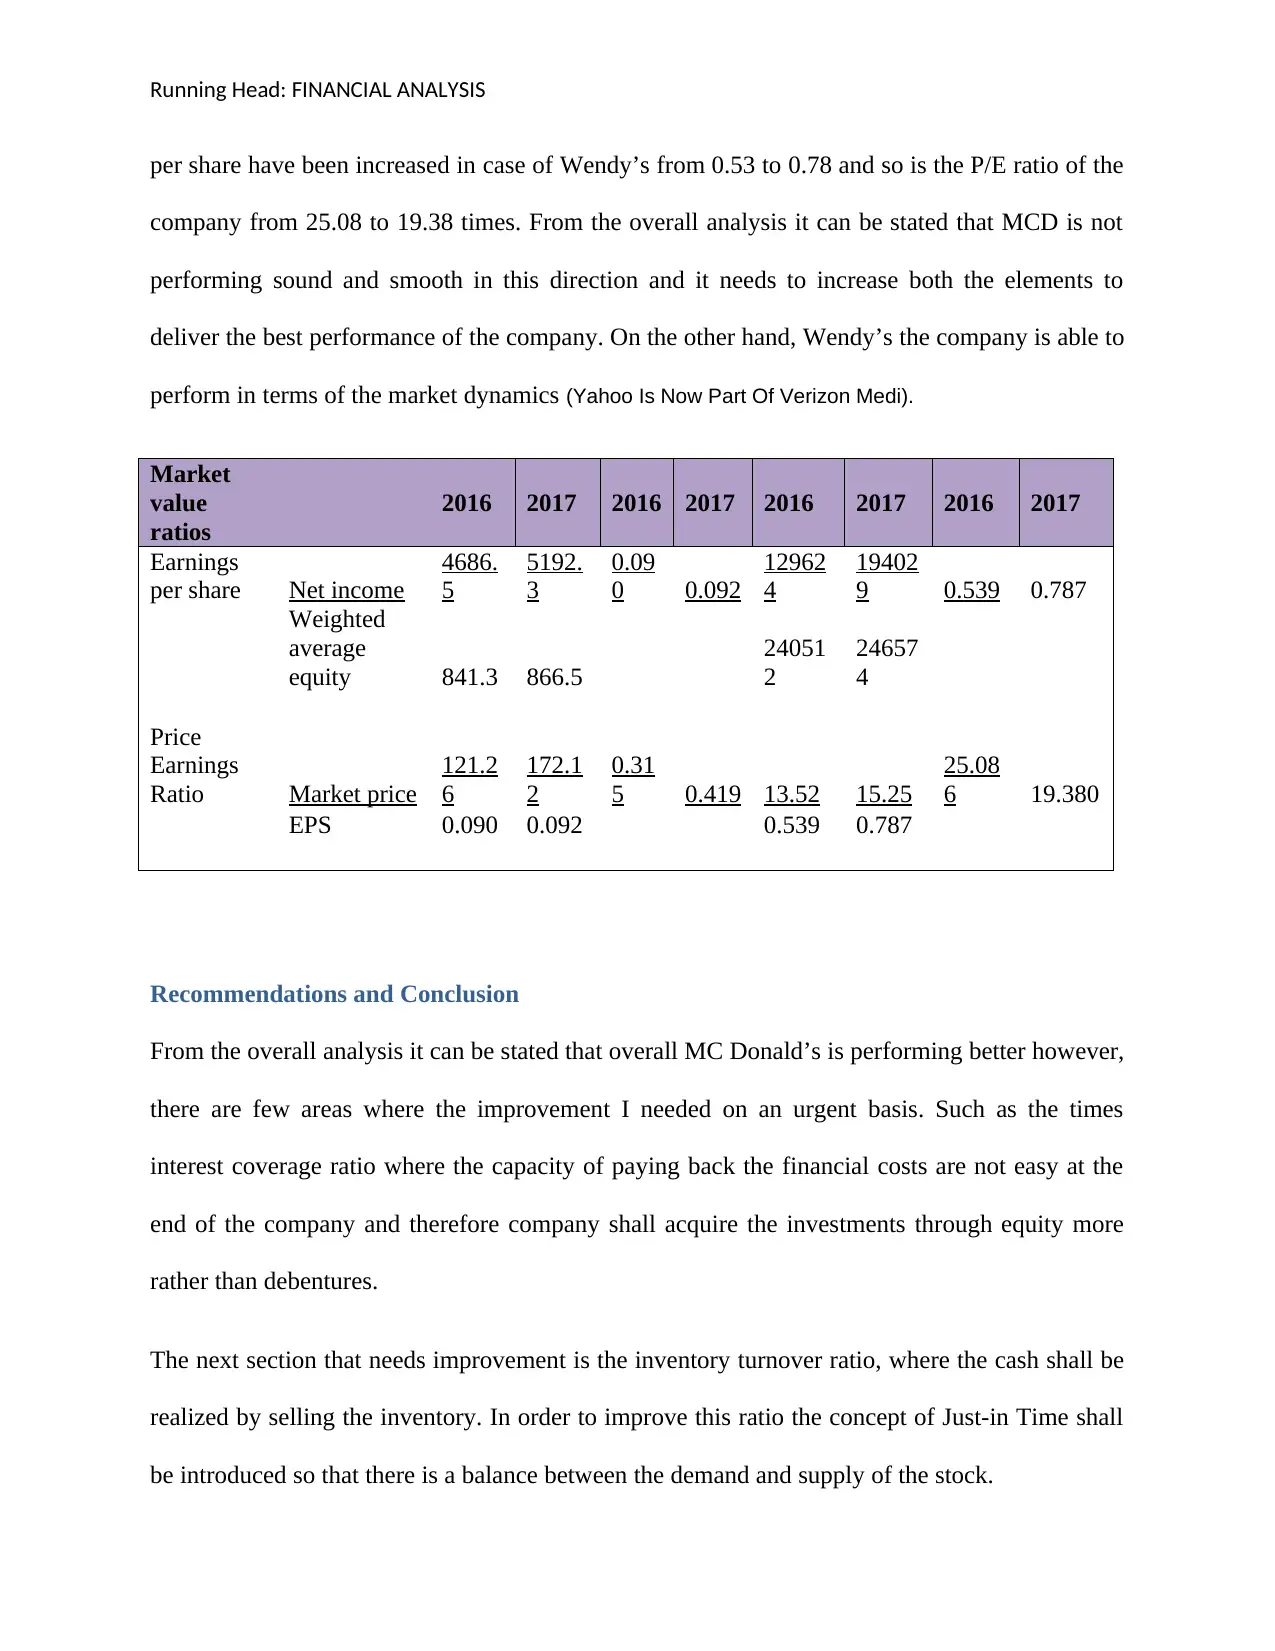
per share have been increased in case of Wendy’s from 0.53 to 0.78 and so is the P/E ratio of the
company from 25.08 to 19.38 times. From the overall analysis it can be stated that MCD is not
performing sound and smooth in this direction and it needs to increase both the elements to
deliver the best performance of the company. On the other hand, Wendy’s the company is able to
perform in terms of the market dynamics (Yahoo Is Now Part Of Verizon Medi).
Market
value
ratios
2016 2017 2016 2017 2016 2017 2016 2017
Earnings
per share Net income
4686.
5
5192.
3
0.09
0 0.092
12962
4
19402
9 0.539 0.787
Weighted
average
equity 841.3 866.5
24051
2
24657
4
Price
Earnings
Ratio Market price
121.2
6
172.1
2
0.31
5 0.419 13.52 15.25
25.08
6 19.380
EPS 0.090 0.092 0.539 0.787
Recommendations and Conclusion
From the overall analysis it can be stated that overall MC Donald’s is performing better however,
there are few areas where the improvement I needed on an urgent basis. Such as the times
interest coverage ratio where the capacity of paying back the financial costs are not easy at the
end of the company and therefore company shall acquire the investments through equity more
rather than debentures.
The next section that needs improvement is the inventory turnover ratio, where the cash shall be
realized by selling the inventory. In order to improve this ratio the concept of Just-in Time shall
be introduced so that there is a balance between the demand and supply of the stock.
⊘ This is a preview!⊘
Do you want full access?
Subscribe today to unlock all pages.
Trusted by 1+ million students worldwide

Running Head: FINANCIAL ANALYSIS
From the overall analysis it can be stated that of these two sections can be improved it can beat
Wendy’s and from the point of view of the investors the right company would be MC Donalds.
From the overall analysis it can be stated that of these two sections can be improved it can beat
Wendy’s and from the point of view of the investors the right company would be MC Donalds.
Paraphrase This Document
Need a fresh take? Get an instant paraphrase of this document with our AI Paraphraser
Running Head: FINANCIAL ANALYSIS
References
"Yahoo Is Now Part Of Verizon Media". Finance.Yahoo.Com, 2019,
https://finance.yahoo.com/quote/MCD/.
"Yahoo Is Now Part Of Verizon Media". Finance.Yahoo.Com, 2019,
https://finance.yahoo.com/quote/WEN/.
"Yahoo Is Now Part Of Verizon Media." Finance.yahoo.com. N.p., 2019. Web. 20 Dec. 2019.
Annualreports.com. N.p., 2019. Web. 20 Dec. 2019.
Astolfi, Davide, Francesco Castellani, and Ludovico Terzi. (2019): "Definition and Interpretation
of Wind Farm Efficiency in Complex Terrain: A Discussion." Journal of Energy Resources
Technology 141.5 055501.
Cherian, Deepak, and George V. Kallarackal (2017). "Analysis of Liquidity and Profitability
Position of a Cattle Feed Manufacturing Firm." Development 4.5
Hadiwidjaja, Rini Dwiyani (2016). "The influence of the bank's performance ratio to profit
growth on banking companies in Indonesia." Review of Integrative Business and Economics
Research 5.1 106.
S1.Q4cdn.Com, 2019,
https://s1.q4cdn.com/202642389/files/doc_financials/annual/2017/Wendys_Bookmarked_Annual_Report_
2017.pdf.
Kaur, Jaspreet, Manpreet Kaur, and Simranjit Singh (2015): "Financial Performance Analysis of
Selected Public Sector Banks: A CAMEL Model Approach." International Journal of Applied
Business and Economic Research 13.6 (2015): 4327-4348.
Running Head: FINANCIAL ANALYSIS
Lim, Ji Young, and Wonjung Noh (2015): "Key components of financial‐analysis education for
clinical nurses." Nursing & health sciences 17.3 (2015): 293-298.
Nessa, Kazi Zannatun (2019). "Financial Performance Analysis of Bangladesh Krishi Bank."
(2019).
Perçin, Selçuk, and Eyad Aldalou (2018): "Financial Performance Evaluation of Turkish Airline
Companies Using Integrated Fuzzy AHP Fuzzy TOPSIS Model." Uluslararası İktisadi ve İdari
İncelemeler Dergisi,(18. EYİ Özel Sayısı) 583-598.
Rakićević, A., et al (2016). "DuPont financial ratio analysis using logical aggregation." Soft
computing applications. Springer, Cham, 727-739.
Shaik, Jakeer Hussain, Grandhi Manjula, and G. Vidya (2018). "Impact of Efficiency Ratio on
Profitability of the 6,433 FDI Companies: A Panel Data Analysis." ICRTEMMS Conference
Proceedings. Vol. 515. No. 518. Swarna Bharathi lnstitute of Science and Technology,.
Singh, Sweta (2017). "Ratio Analysis in Manufacturing Sector-A Study." International Journal
of Innovative Research in Engineering and Management 4
⊘ This is a preview!⊘
Do you want full access?
Subscribe today to unlock all pages.
Trusted by 1+ million students worldwide
1 out of 12
Related Documents


Your All-in-One AI-Powered Toolkit for Academic Success.
+13062052269
info@desklib.com
Available 24*7 on WhatsApp / Email
![[object Object]](/_next/static/media/star-bottom.7253800d.svg)
Unlock your academic potential
Copyright © 2020–2026 A2Z Services. All Rights Reserved. Developed and managed by ZUCOL.