Financial Health Assessment: Mediclinic & NMC for ABC Laboratories
VerifiedAdded on 2023/06/15
|21
|4881
|443
Report
AI Summary
This report presents a comprehensive financial analysis of Mediclinic International and NMC Health, conducted to assess their financial performance and suitability as strategic collaborators for ABC Laboratories. The analysis includes vertical and horizontal assessments of both companies' income statements and balance sheets, revealing trends in revenue, profitability, and asset/liability management. Key financial ratios, such as profitability, liquidity, efficiency, and leverage ratios, are calculated and compared to determine the financial stability and growth potential of each company. The report identifies strengths and weaknesses in their financial positions, discusses potential challenges they face, and ultimately proposes an optimal choice for ABC Laboratories based on the findings. Mediclinic International is identified as the stronger candidate due to its more robust financial health and consistent performance.
Running head: HEALTHCARE MANAGEMENT
Healthcare Management
Name of the Student:
Name of the University:
Authors Note:
Healthcare Management
Name of the Student:
Name of the University:
Authors Note:
Paraphrase This Document
Need a fresh take? Get an instant paraphrase of this document with our AI Paraphraser
HEALTHCARE MANAGEMENT
1
Table of Contents
Introduction:...............................................................................................................................2
1. Examining the reports and making adequate financial assessments:.....................................2
1.1 Vertical Analysis Mediclinic International and NMC Health:............................................2
1.2 Horizontal Analysis Mediclinic International and NMC Health:........................................7
1.3 Financial ratio Analysis Mediclinic International and NMC Health:................................11
2. Discussing the strong points in Mediclinic International and NMC Health financial state:14
3. Discussing potential problems and challenges faced by both the companies:.....................14
4. Assessing financial performance of Mediclinic International and NMC Health:................15
5. Making comparison between the Mediclinic International and NMC Health:....................16
6. Proposing the optimal choice for ABC Laboratories:..........................................................17
Conclusion:..............................................................................................................................18
Reference and Bibliography:....................................................................................................19
HEALTHCARE MANAGEMENT
2
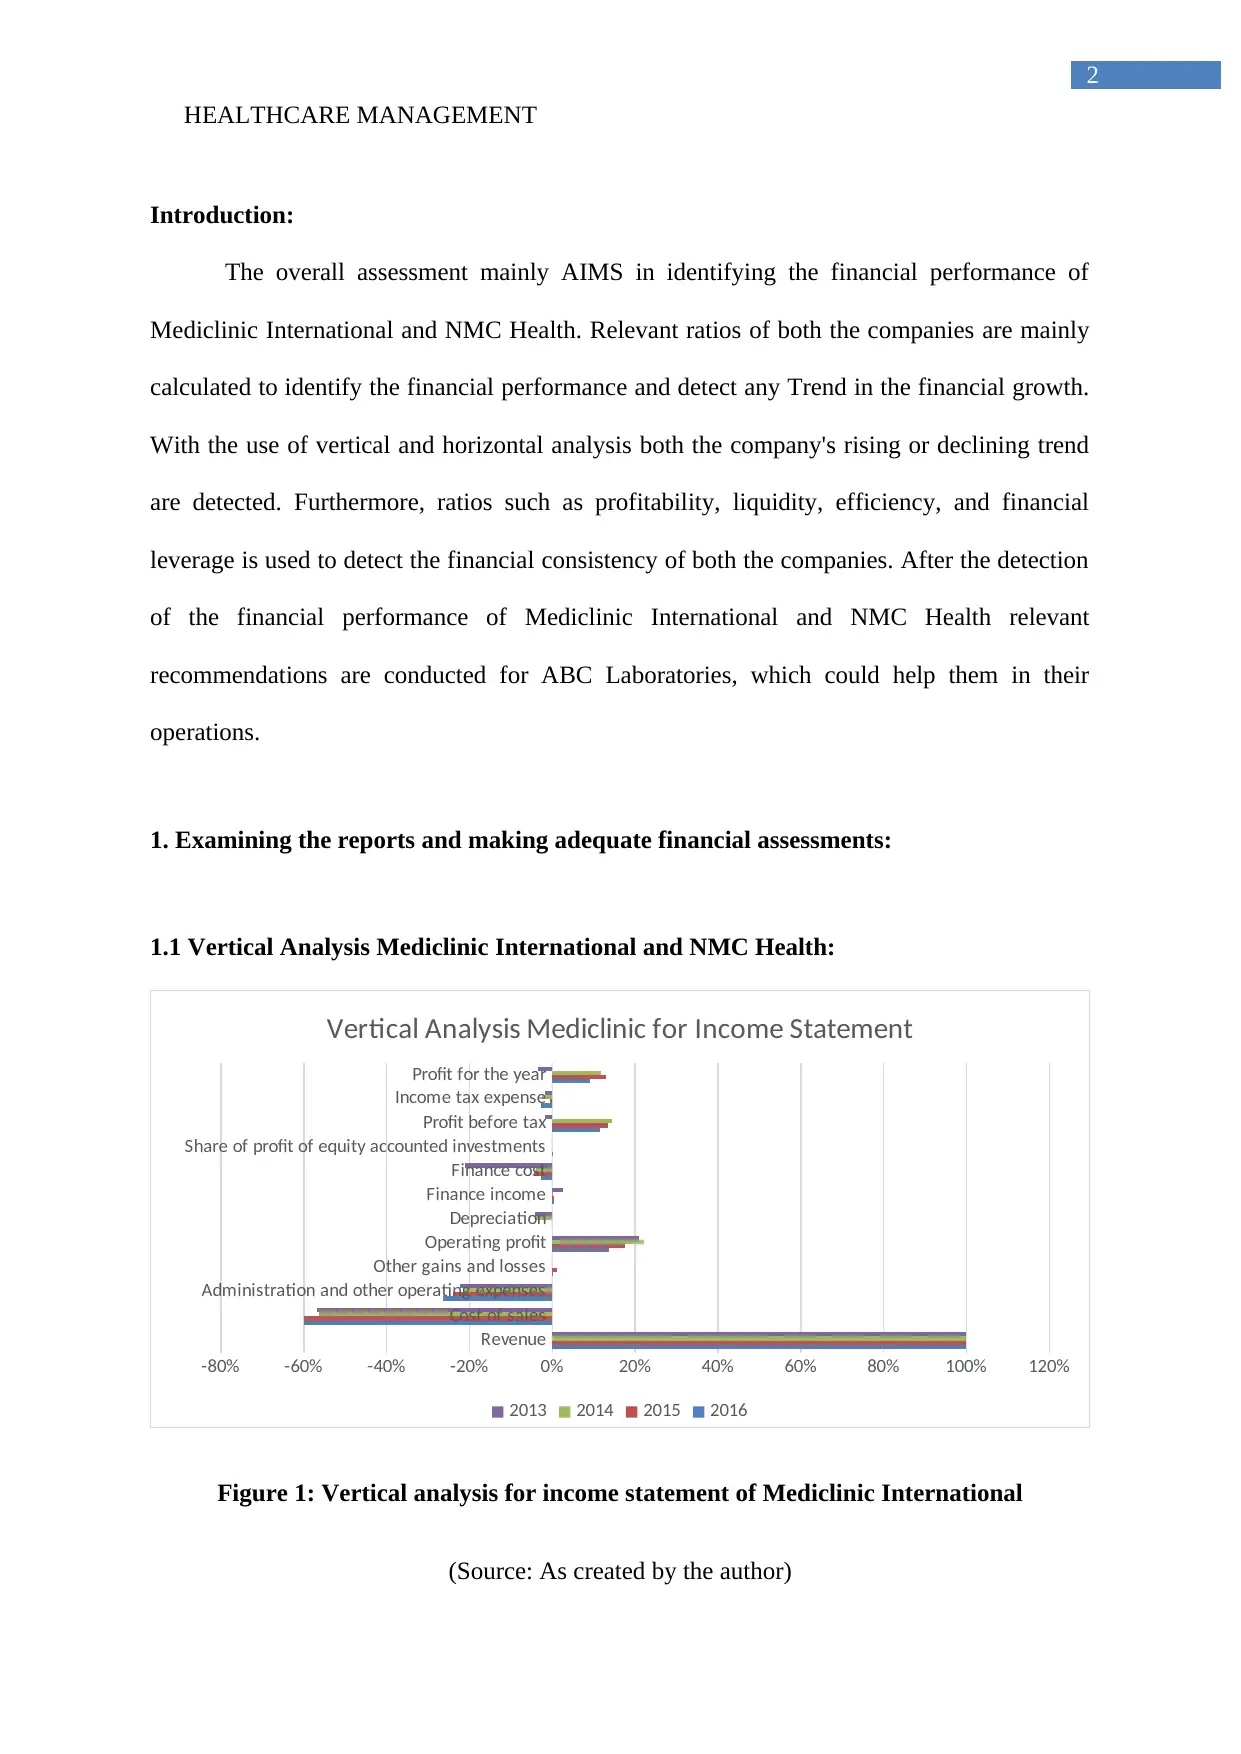
Introduction:
The overall assessment mainly AIMS in identifying the financial performance of
Mediclinic International and NMC Health. Relevant ratios of both the companies are mainly
calculated to identify the financial performance and detect any Trend in the financial growth.
With the use of vertical and horizontal analysis both the company's rising or declining trend
are detected. Furthermore, ratios such as profitability, liquidity, efficiency, and financial
leverage is used to detect the financial consistency of both the companies. After the detection
of the financial performance of Mediclinic International and NMC Health relevant
recommendations are conducted for ABC Laboratories, which could help them in their
operations.
1. Examining the reports and making adequate financial assessments:
1.1 Vertical Analysis Mediclinic International and NMC Health:
Revenue
Cost of sales
Administration and other operating expenses
Other gains and losses
Operating profit
Depreciation
Finance income
Finance cost
Share of profit of equity accounted investments
Profit before tax
Income tax expense
Profit for the year
-80% -60% -40% -20% 0% 20% 40% 60% 80% 100% 120%
Vertical Analysis Mediclinic for Income Statement
2013 2014 2015 2016
Figure 1: Vertical analysis for income statement of Mediclinic International
(Source: As created by the author)
2
Introduction:
The overall assessment mainly AIMS in identifying the financial performance of
Mediclinic International and NMC Health. Relevant ratios of both the companies are mainly
calculated to identify the financial performance and detect any Trend in the financial growth.
With the use of vertical and horizontal analysis both the company's rising or declining trend
are detected. Furthermore, ratios such as profitability, liquidity, efficiency, and financial
leverage is used to detect the financial consistency of both the companies. After the detection
of the financial performance of Mediclinic International and NMC Health relevant
recommendations are conducted for ABC Laboratories, which could help them in their
operations.
1. Examining the reports and making adequate financial assessments:
1.1 Vertical Analysis Mediclinic International and NMC Health:
Revenue
Cost of sales
Administration and other operating expenses
Other gains and losses
Operating profit
Depreciation
Finance income
Finance cost
Share of profit of equity accounted investments
Profit before tax
Income tax expense
Profit for the year
-80% -60% -40% -20% 0% 20% 40% 60% 80% 100% 120%
Vertical Analysis Mediclinic for Income Statement
2013 2014 2015 2016
Figure 1: Vertical analysis for income statement of Mediclinic International
(Source: As created by the author)
⊘ This is a preview!⊘
Do you want full access?
Subscribe today to unlock all pages.
Trusted by 1+ million students worldwide
HEALTHCARE MANAGEMENT
3
Revenue
Gross profit
Other income
Transaction costs
Amortisation
PROFIT FROM OPERATIONS
Finance income
Profit before tax
Profit for the year
-80% -60% -40% -20% 0% 20% 40% 60% 80% 100% 120%
Vertical Analysis NMC Health for Income Statement
2013 2014 2015 2016
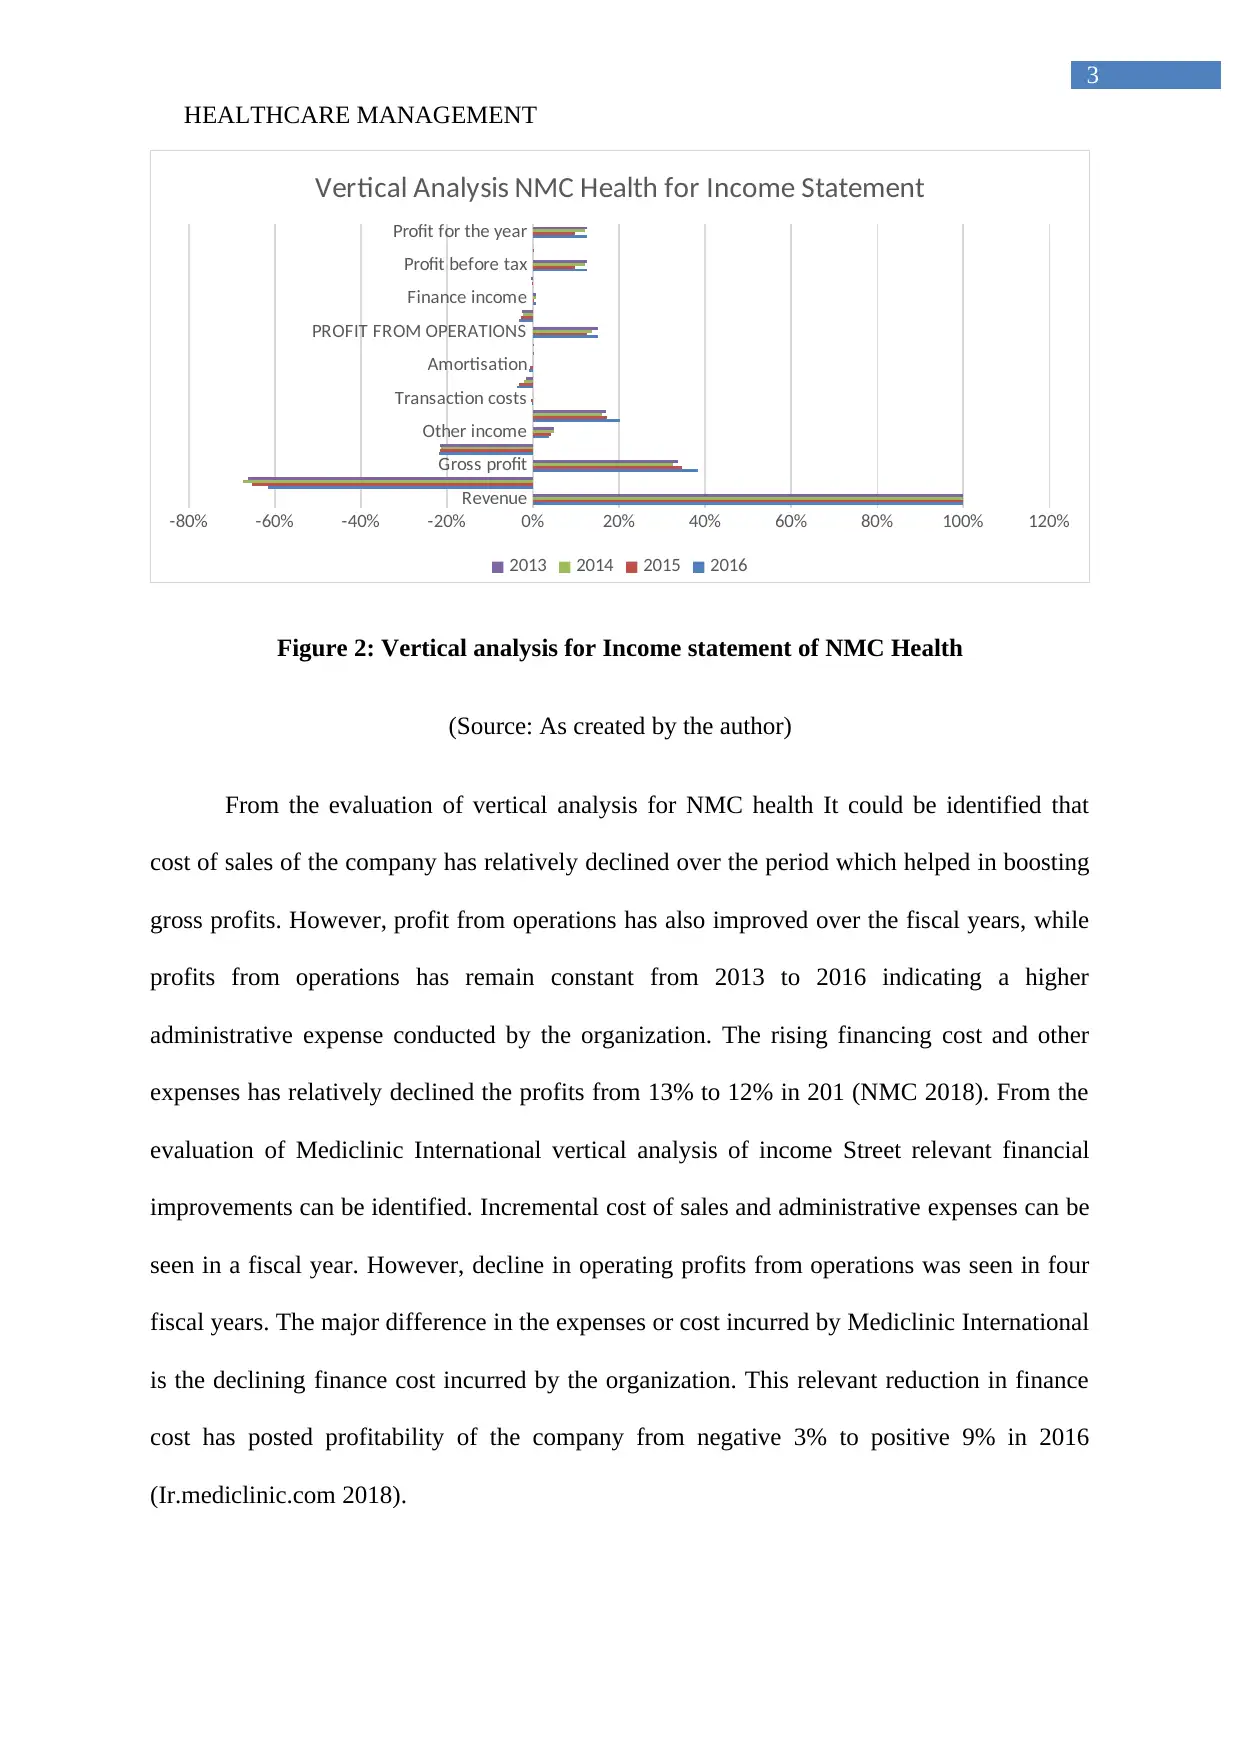
Figure 2: Vertical analysis for Income statement of NMC Health
(Source: As created by the author)
From the evaluation of vertical analysis for NMC health It could be identified that
cost of sales of the company has relatively declined over the period which helped in boosting
gross profits. However, profit from operations has also improved over the fiscal years, while
profits from operations has remain constant from 2013 to 2016 indicating a higher
administrative expense conducted by the organization. The rising financing cost and other
expenses has relatively declined the profits from 13% to 12% in 201 (NMC 2018). From the
evaluation of Mediclinic International vertical analysis of income Street relevant financial
improvements can be identified. Incremental cost of sales and administrative expenses can be
seen in a fiscal year. However, decline in operating profits from operations was seen in four
fiscal years. The major difference in the expenses or cost incurred by Mediclinic International
is the declining finance cost incurred by the organization. This relevant reduction in finance
cost has posted profitability of the company from negative 3% to positive 9% in 2016
(Ir.mediclinic.com 2018).
3
Revenue
Gross profit
Other income
Transaction costs
Amortisation
PROFIT FROM OPERATIONS
Finance income
Profit before tax
Profit for the year
-80% -60% -40% -20% 0% 20% 40% 60% 80% 100% 120%
Vertical Analysis NMC Health for Income Statement
2013 2014 2015 2016
Figure 2: Vertical analysis for Income statement of NMC Health
(Source: As created by the author)
From the evaluation of vertical analysis for NMC health It could be identified that
cost of sales of the company has relatively declined over the period which helped in boosting
gross profits. However, profit from operations has also improved over the fiscal years, while
profits from operations has remain constant from 2013 to 2016 indicating a higher
administrative expense conducted by the organization. The rising financing cost and other
expenses has relatively declined the profits from 13% to 12% in 201 (NMC 2018). From the
evaluation of Mediclinic International vertical analysis of income Street relevant financial
improvements can be identified. Incremental cost of sales and administrative expenses can be
seen in a fiscal year. However, decline in operating profits from operations was seen in four
fiscal years. The major difference in the expenses or cost incurred by Mediclinic International
is the declining finance cost incurred by the organization. This relevant reduction in finance
cost has posted profitability of the company from negative 3% to positive 9% in 2016
(Ir.mediclinic.com 2018).
Paraphrase This Document
Need a fresh take? Get an instant paraphrase of this document with our AI Paraphraser
HEALTHCARE MANAGEMENT
4
Non-current assets
Property, equipment and vehicles
Intangible assets
Equity accounted investments
Other investments and loans
Receivables
Derivative financial instruments
Deferred income tax assets
Current assets
Inventories
Trade and other receivables
Current income tax assets
Derivative financial instruments
Cash and cash equivalents
Total assets
0.00% 20.00% 40.00% 60.00% 80.00% 100.00% 120.00%
Vertical Analysis Mediclinic for Balance Sheet
2013 2014 2015 2016
Share capital
Treasury shares
Other reserves
Non-controlling interests
LIABILITIES
Borrowings
Retirement benefit obligations
Derivative financial instruments
Trade and other payables
Provisions
Derivative financial instruments
Total liabilities
-60.00% -40.00% -20.00% 0.00% 20.00% 40.00% 60.00% 80.00% 100.00% 120.00%
Vertical Analysis Mediclinic for Balance Sheet
2013 2014 2015 2016
Figure 3: Vertical analysis for Balance Sheet statement of Mediclinic International
(Source: As created by the author)
HEALTHCARE MANAGEMENT
5
Non-current assets
Intangible assets
Deferred tax assets
Advances paid for acquisitions
Current assets
Accounts receivable and prepayments
Amounts due from related parties
Bank deposits
Total assets
0.00% 20.00% 40.00% 60.00% 80.00% 100.00% 120.00%
Vertical Analysis NMC Health for Balance Sheet
2013 2014 2015 2016
Share capital
Group restructuring reserve
Option redemption reserves
Equity attributable
Total equity
Non-current liabilities
Employees' end of service benefits
Option redemption payable
Current liabilities
Other payables
Bank overdrafts and other short term borrowings
Employees' end of service benefits
Total liabilities
-20% 0% 20% 40% 60% 80% 100% 120%
Vertical Analysis NMC Health for Balance Sheet
23.72% 9.24% 19.31% 8.37% 4.05% 8.15% 5.95% 20.71%
Figure 4: Vertical analysis for Balance Sheet statement of NMC Health
(Source: As created by the author)
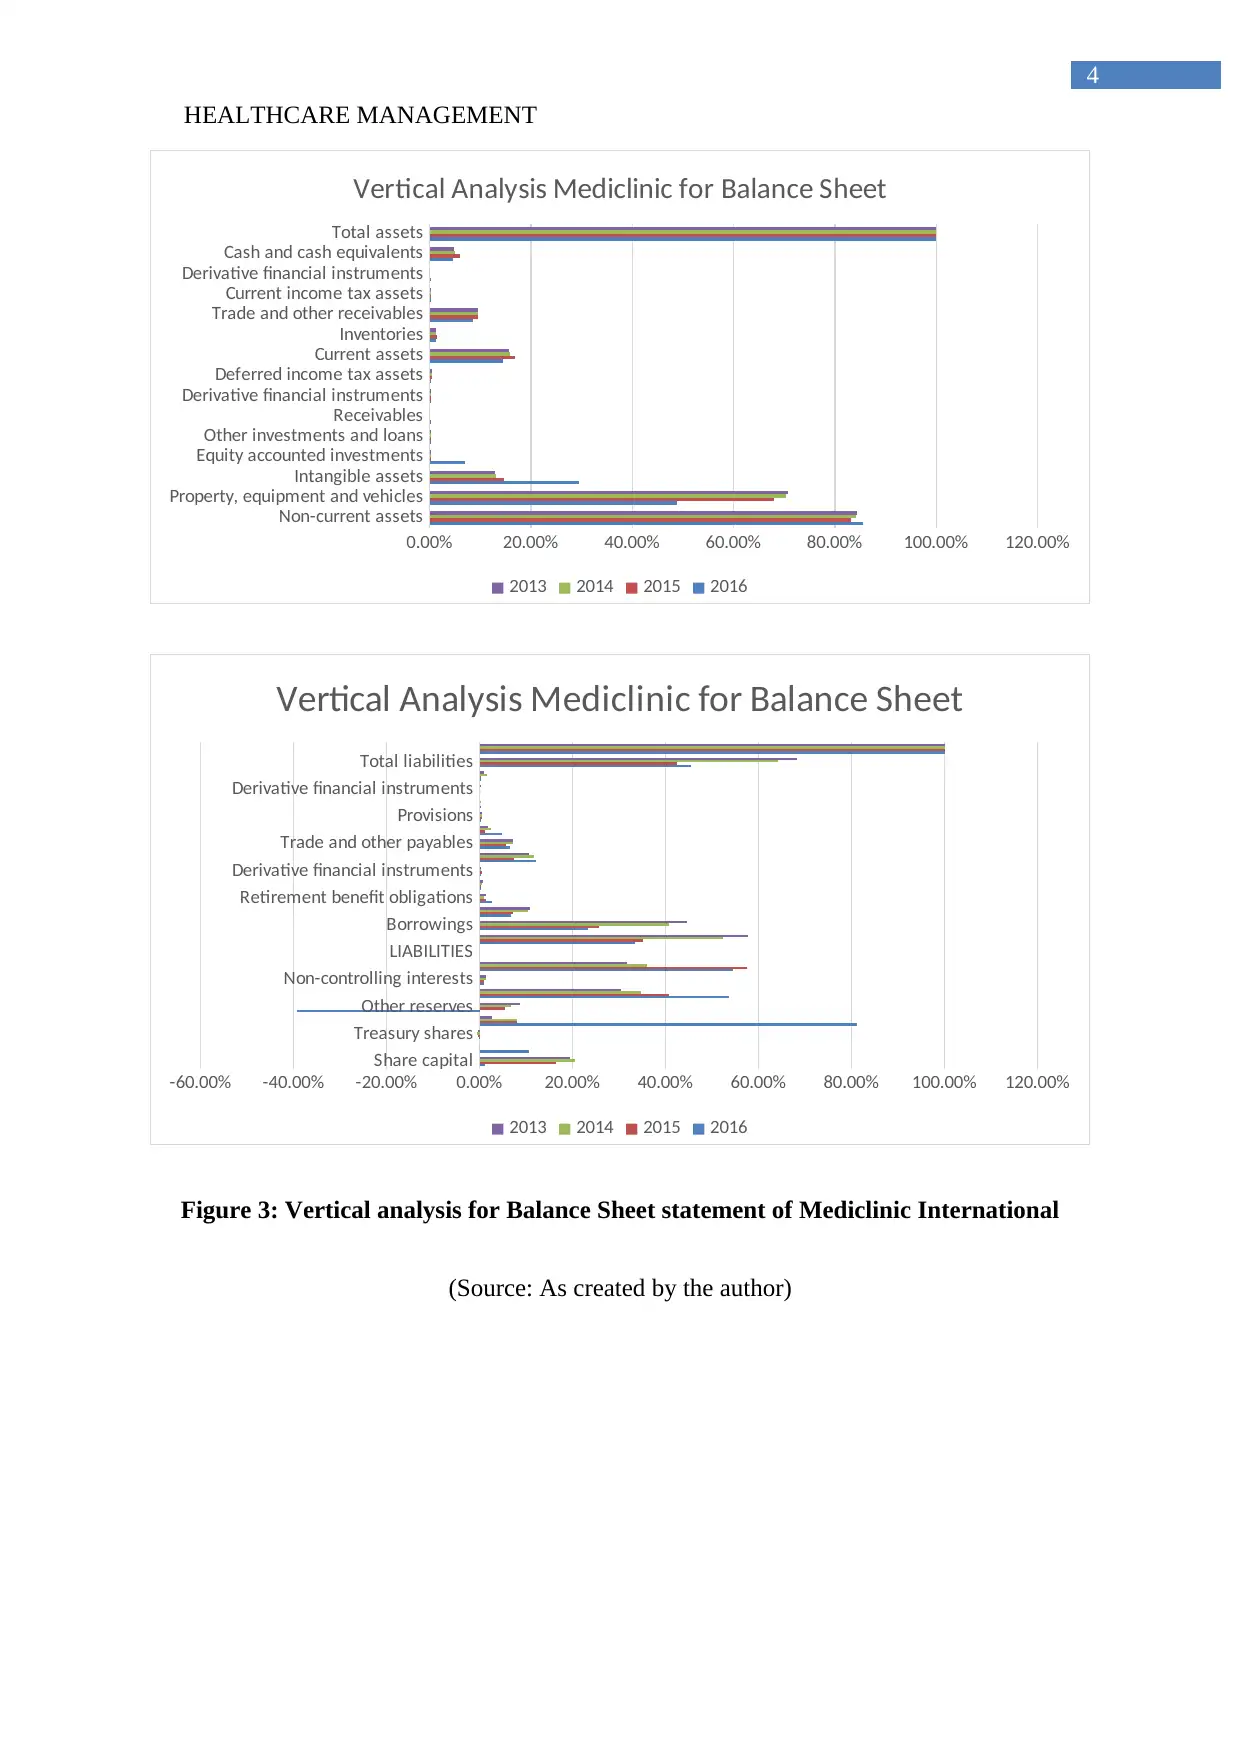
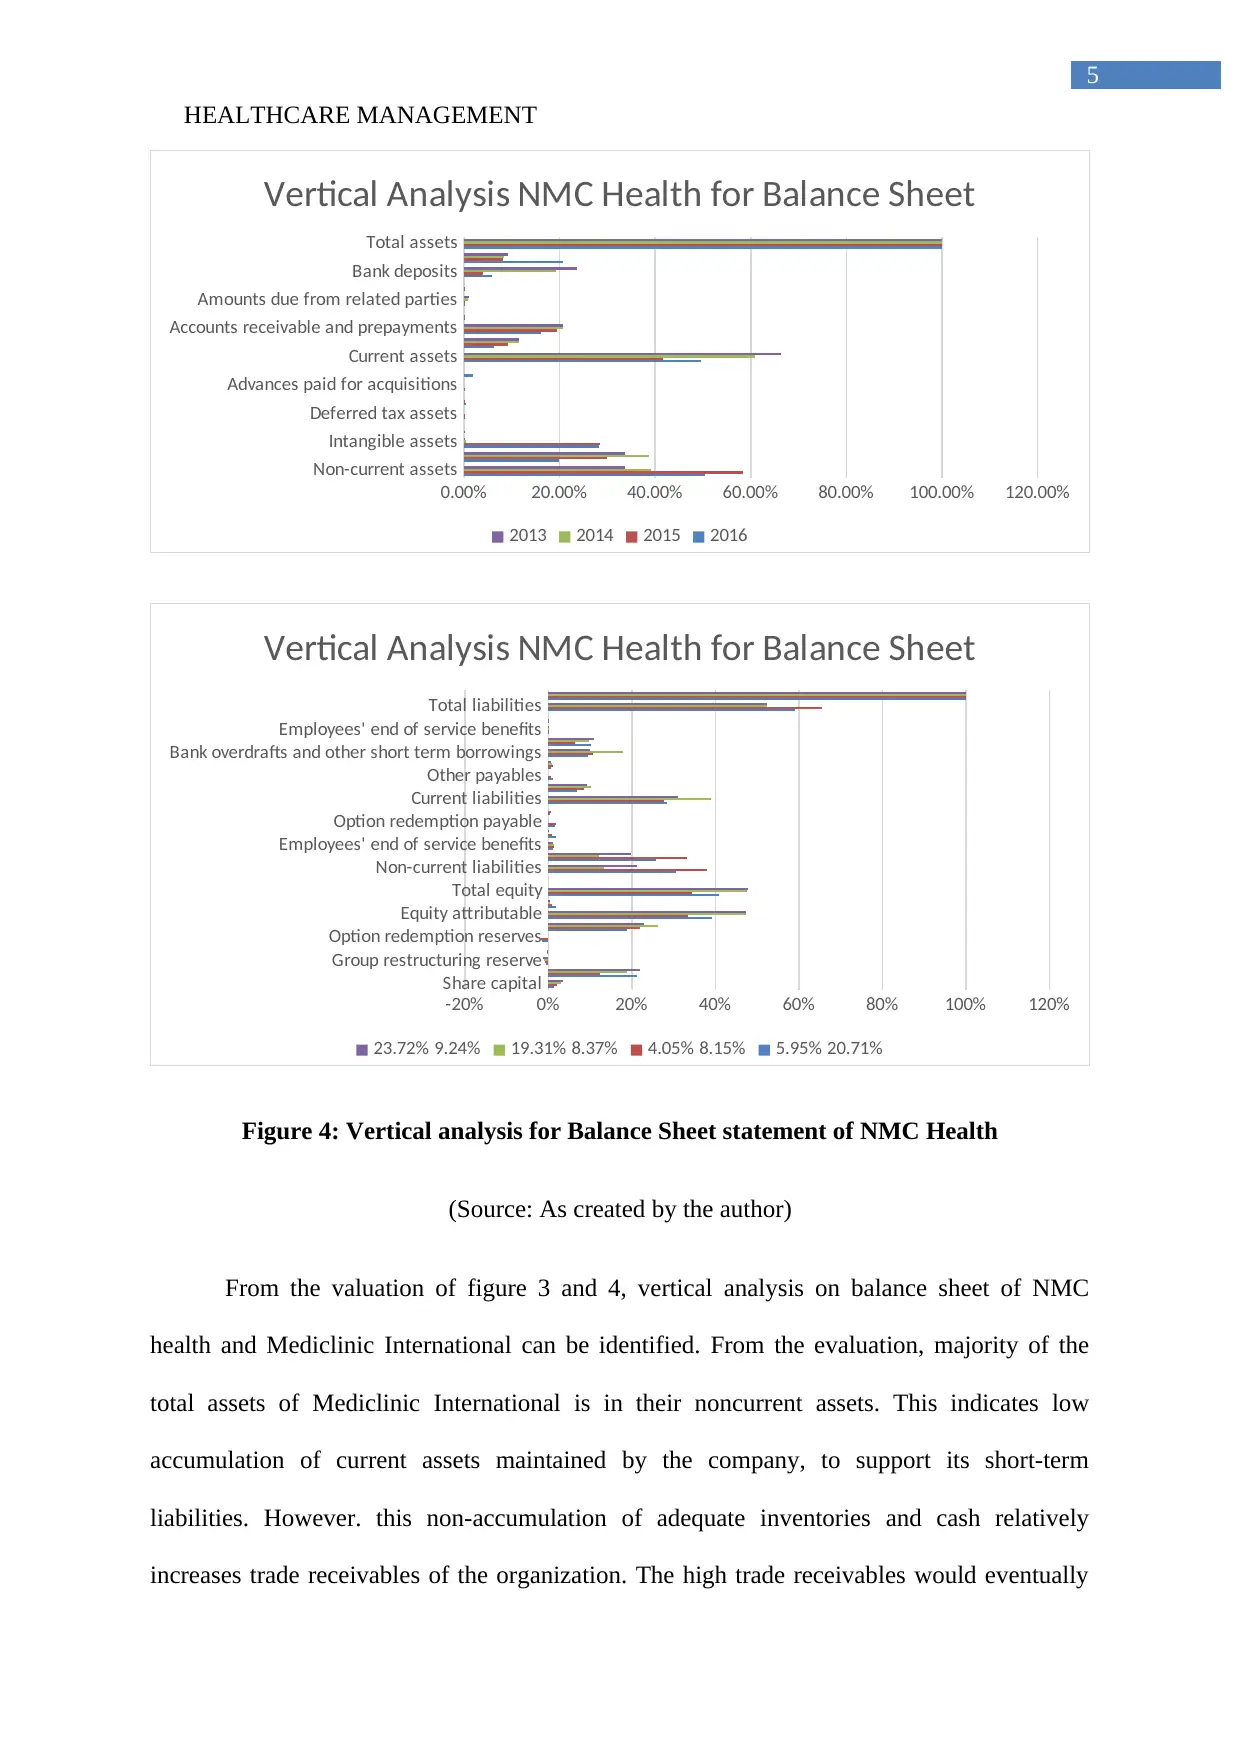
From the valuation of figure 3 and 4, vertical analysis on balance sheet of NMC
health and Mediclinic International can be identified. From the evaluation, majority of the
total assets of Mediclinic International is in their noncurrent assets. This indicates low
accumulation of current assets maintained by the company, to support its short-term
liabilities. However. this non-accumulation of adequate inventories and cash relatively
increases trade receivables of the organization. The high trade receivables would eventually
5
Non-current assets
Intangible assets
Deferred tax assets
Advances paid for acquisitions
Current assets
Accounts receivable and prepayments
Amounts due from related parties
Bank deposits
Total assets
0.00% 20.00% 40.00% 60.00% 80.00% 100.00% 120.00%
Vertical Analysis NMC Health for Balance Sheet
2013 2014 2015 2016
Share capital
Group restructuring reserve
Option redemption reserves
Equity attributable
Total equity
Non-current liabilities
Employees' end of service benefits
Option redemption payable
Current liabilities
Other payables
Bank overdrafts and other short term borrowings
Employees' end of service benefits
Total liabilities
-20% 0% 20% 40% 60% 80% 100% 120%
Vertical Analysis NMC Health for Balance Sheet
23.72% 9.24% 19.31% 8.37% 4.05% 8.15% 5.95% 20.71%
Figure 4: Vertical analysis for Balance Sheet statement of NMC Health
(Source: As created by the author)
From the valuation of figure 3 and 4, vertical analysis on balance sheet of NMC
health and Mediclinic International can be identified. From the evaluation, majority of the
total assets of Mediclinic International is in their noncurrent assets. This indicates low
accumulation of current assets maintained by the company, to support its short-term
liabilities. However. this non-accumulation of adequate inventories and cash relatively
increases trade receivables of the organization. The high trade receivables would eventually
⊘ This is a preview!⊘
Do you want full access?
Subscribe today to unlock all pages.
Trusted by 1+ million students worldwide
HEALTHCARE MANAGEMENT
6
indicate blockage of essential capital, which is used in the business process. More majority of
the total equity and liability section is compliant with total equity, which is relatively
increased in 4 fiscal years. The total liabilities section mainly holds 45.49% of the total equity
and liability part of the balance sheet. the total liabilities section mainly comprises of 33.4%
of non-current liabilities while current liability only 12.02%. Moreover, debt of the
organization has relatively declined over the period which helped in reducing the finance cost
(Ir.mediclinic.com 2018). However, trade payables have been declining over the period,
which Indicates the credit provision provided to the company.
The evaluation also indicates that total Assets of the organization is relatively divided
in non-current and current assets, where maximum of the investment of non-current assets are
conducted in property and intangibles. Moreover, the current assets investments are mainly
conducted on account receivables, cash, and inventories, which will be used by NMC Health
to improve its financial position. However, from the valuation it could be understood that
total equity only holds 41% of total liabilities and equity of the organization. On the other
hand, 59% of total liabilities is used by NMC Health for supporting has operations. This high
accumulation of debt is relatively depicting the weak financial position of NMC Health
(NMC 2018).
From the evaluation it could be detected that Mediclinic International is more
financially sound than NMC Health.
Paraphrase This Document
Need a fresh take? Get an instant paraphrase of this document with our AI Paraphraser
HEALTHCARE MANAGEMENT
7
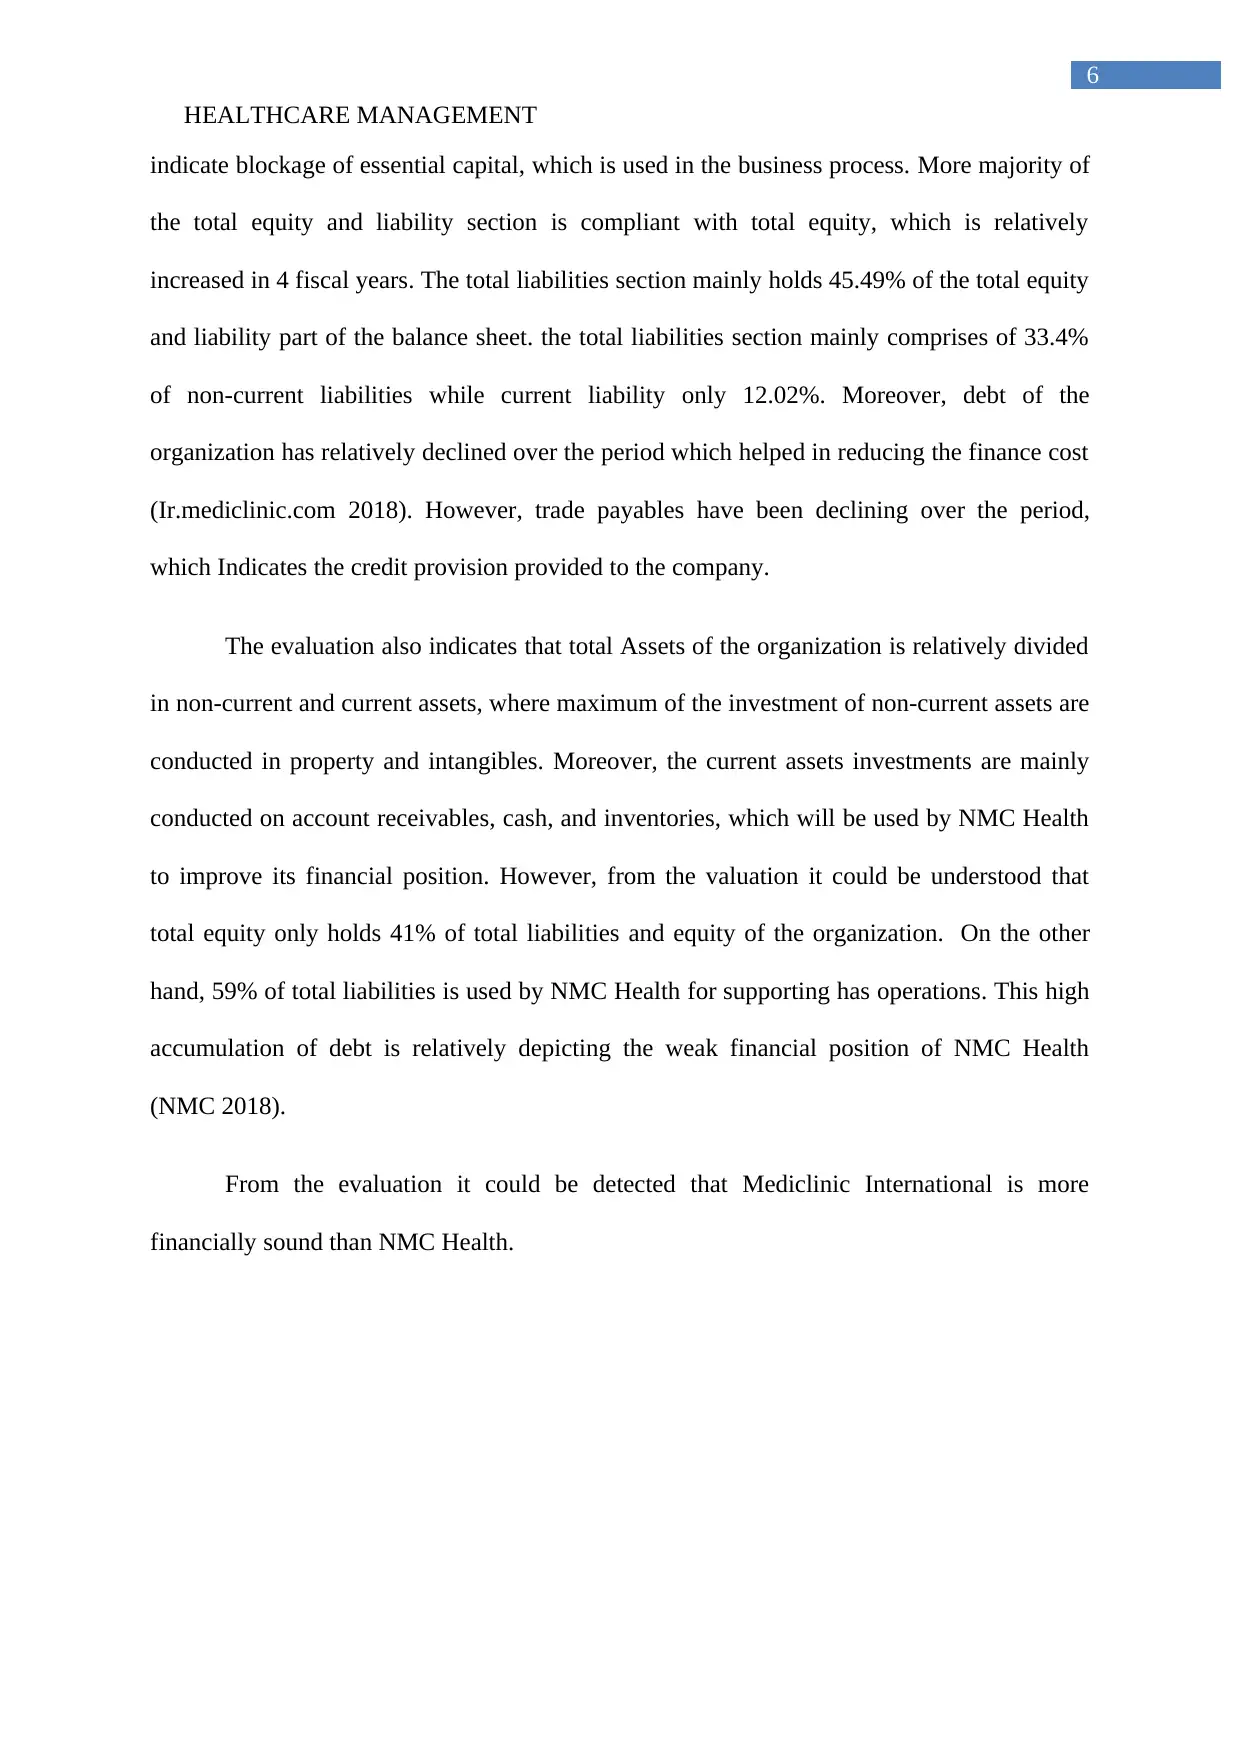
1.2 Horizontal Analysis Mediclinic International and NMC Health:
Revenue
Cost of sales
Administration and other operating expenses
Other gains and losses
Operating profit
Depreciation
Finance income
Finance cost
Share of profit of equity accounted investments
Profit before tax
Income tax expense
Profit for the year
-200.00% 0.00% 200.00% 400.00% 600.00% 800.00% 1000.00%
Horizontal Analysis Income Statement
Mediclinic
2013 2014 2015 2016
Figure 5: Horizontal analysis for income statement of Mediclinic International
(Source: As created by the author)
Revenue
Gross profit
Other income
Transaction costs
Amortisation
PROFIT FROM OPERATIONS
Finance income
Profit before tax
Profit for the year
-200% -100% 0% 100% 200% 300% 400% 500% 600%
Horizontal Analysis Income Statement NMC
Health
2013 2014 2015 2016
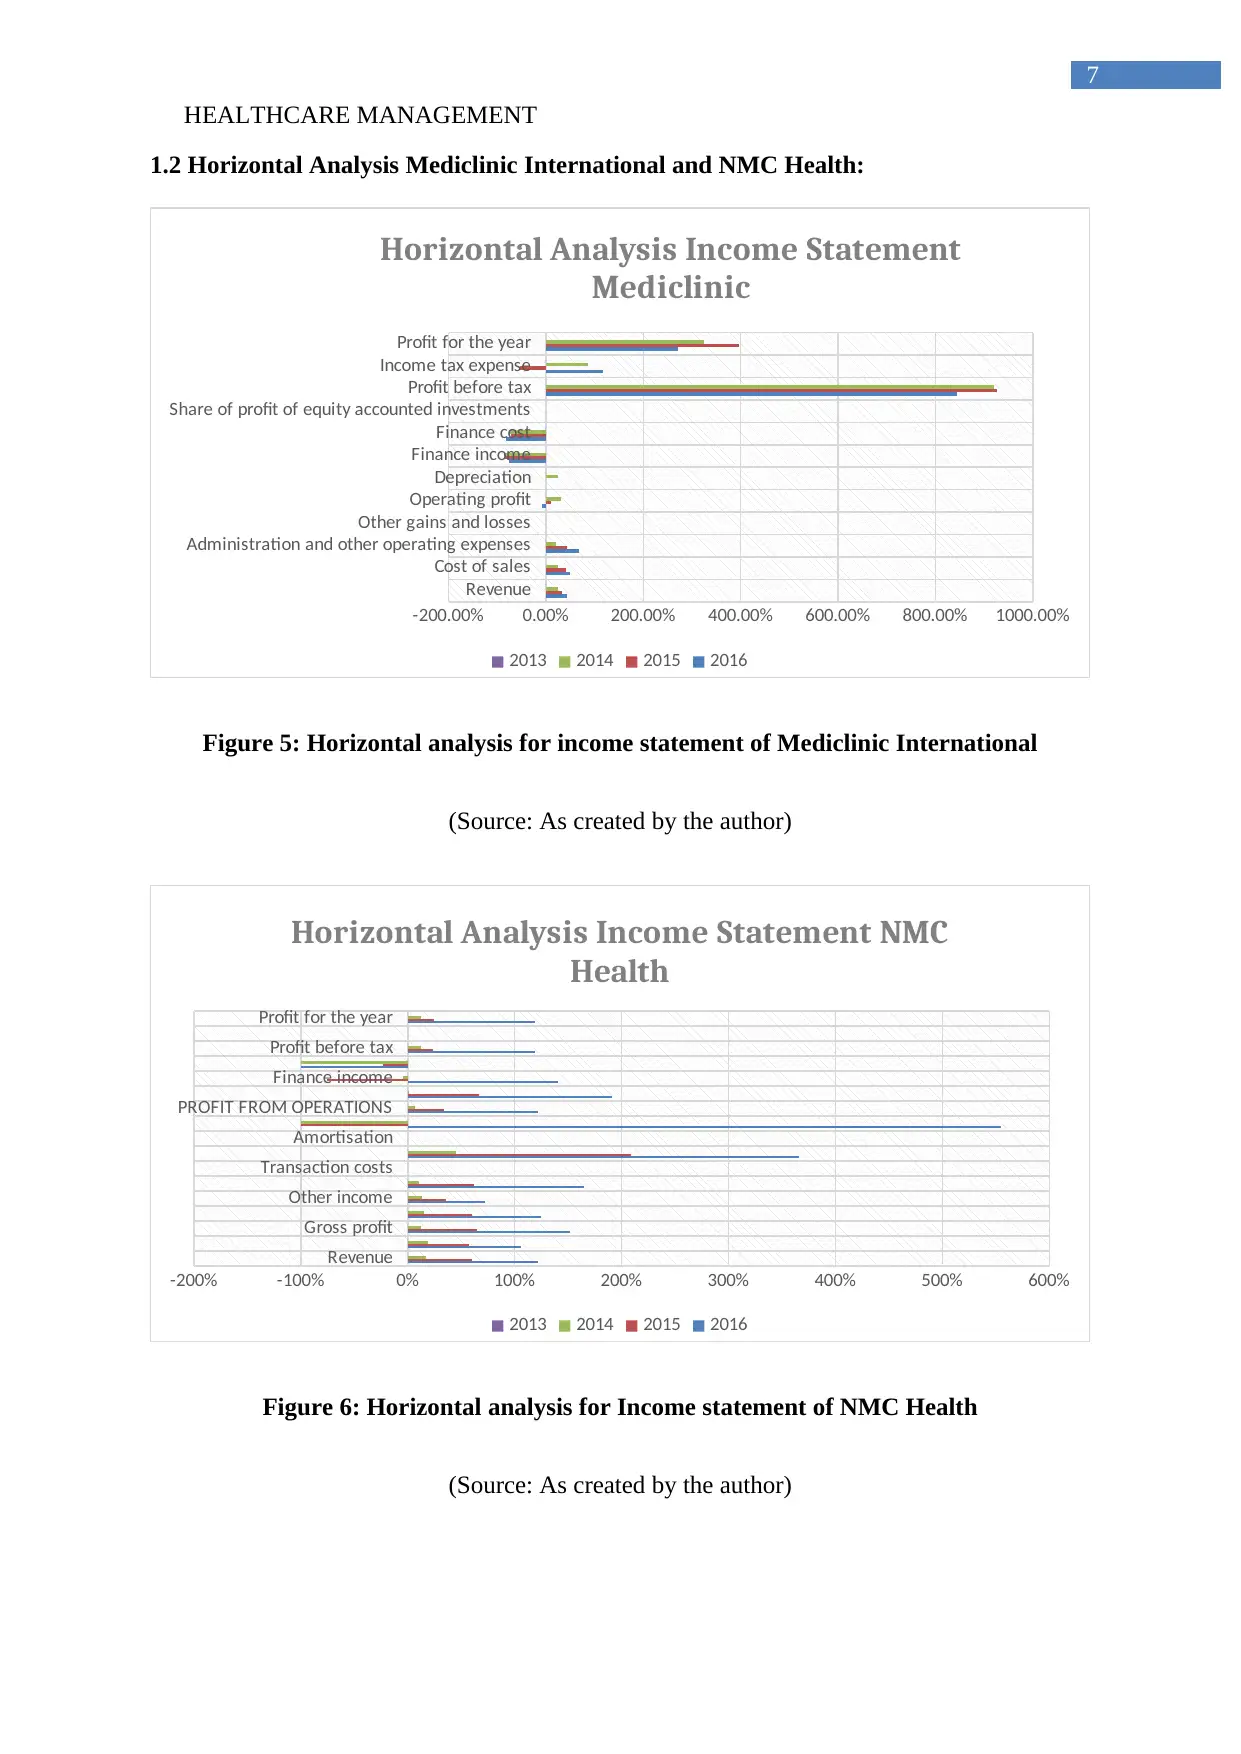
Figure 6: Horizontal analysis for Income statement of NMC Health
(Source: As created by the author)
7
1.2 Horizontal Analysis Mediclinic International and NMC Health:
Revenue
Cost of sales
Administration and other operating expenses
Other gains and losses
Operating profit
Depreciation
Finance income
Finance cost
Share of profit of equity accounted investments
Profit before tax
Income tax expense
Profit for the year
-200.00% 0.00% 200.00% 400.00% 600.00% 800.00% 1000.00%
Horizontal Analysis Income Statement
Mediclinic
2013 2014 2015 2016
Figure 5: Horizontal analysis for income statement of Mediclinic International
(Source: As created by the author)
Revenue
Gross profit
Other income
Transaction costs
Amortisation
PROFIT FROM OPERATIONS
Finance income
Profit before tax
Profit for the year
-200% -100% 0% 100% 200% 300% 400% 500% 600%
Horizontal Analysis Income Statement NMC
Health
2013 2014 2015 2016
Figure 6: Horizontal analysis for Income statement of NMC Health
(Source: As created by the author)
HEALTHCARE MANAGEMENT
8
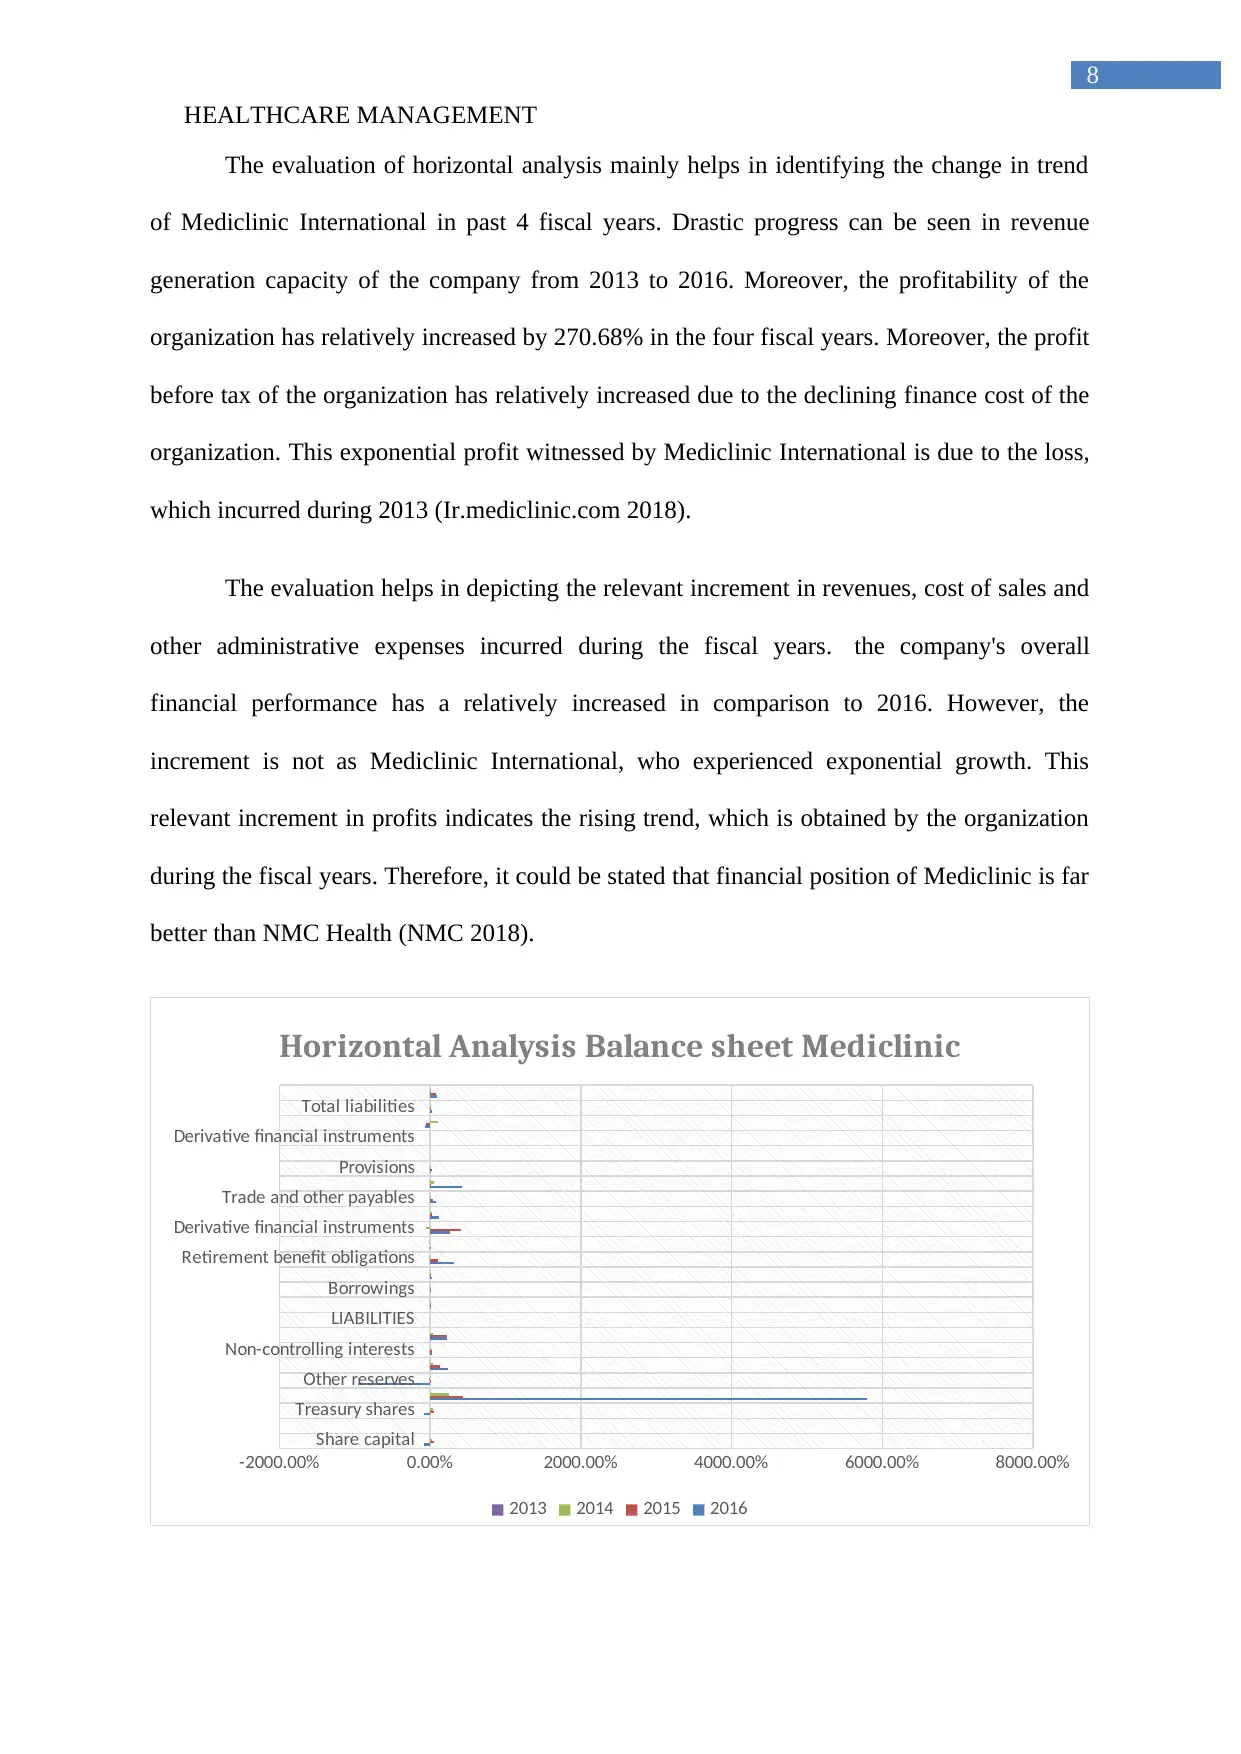
The evaluation of horizontal analysis mainly helps in identifying the change in trend
of Mediclinic International in past 4 fiscal years. Drastic progress can be seen in revenue
generation capacity of the company from 2013 to 2016. Moreover, the profitability of the
organization has relatively increased by 270.68% in the four fiscal years. Moreover, the profit
before tax of the organization has relatively increased due to the declining finance cost of the
organization. This exponential profit witnessed by Mediclinic International is due to the loss,
which incurred during 2013 (Ir.mediclinic.com 2018).
The evaluation helps in depicting the relevant increment in revenues, cost of sales and
other administrative expenses incurred during the fiscal years. the company's overall
financial performance has a relatively increased in comparison to 2016. However, the
increment is not as Mediclinic International, who experienced exponential growth. This
relevant increment in profits indicates the rising trend, which is obtained by the organization
during the fiscal years. Therefore, it could be stated that financial position of Mediclinic is far
better than NMC Health (NMC 2018).
Share capital
Treasury shares
Other reserves
Non-controlling interests
LIABILITIES
Borrowings
Retirement benefit obligations
Derivative financial instruments
Trade and other payables
Provisions
Derivative financial instruments
Total liabilities
-2000.00% 0.00% 2000.00% 4000.00% 6000.00% 8000.00%
Horizontal Analysis Balance sheet Mediclinic
2013 2014 2015 2016
8
The evaluation of horizontal analysis mainly helps in identifying the change in trend
of Mediclinic International in past 4 fiscal years. Drastic progress can be seen in revenue
generation capacity of the company from 2013 to 2016. Moreover, the profitability of the
organization has relatively increased by 270.68% in the four fiscal years. Moreover, the profit
before tax of the organization has relatively increased due to the declining finance cost of the
organization. This exponential profit witnessed by Mediclinic International is due to the loss,
which incurred during 2013 (Ir.mediclinic.com 2018).
The evaluation helps in depicting the relevant increment in revenues, cost of sales and
other administrative expenses incurred during the fiscal years. the company's overall
financial performance has a relatively increased in comparison to 2016. However, the
increment is not as Mediclinic International, who experienced exponential growth. This
relevant increment in profits indicates the rising trend, which is obtained by the organization
during the fiscal years. Therefore, it could be stated that financial position of Mediclinic is far
better than NMC Health (NMC 2018).
Share capital
Treasury shares
Other reserves
Non-controlling interests
LIABILITIES
Borrowings
Retirement benefit obligations
Derivative financial instruments
Trade and other payables
Provisions
Derivative financial instruments
Total liabilities
-2000.00% 0.00% 2000.00% 4000.00% 6000.00% 8000.00%
Horizontal Analysis Balance sheet Mediclinic
2013 2014 2015 2016
⊘ This is a preview!⊘
Do you want full access?
Subscribe today to unlock all pages.
Trusted by 1+ million students worldwide
HEALTHCARE MANAGEMENT
9
Non-current assets
Property, equipment and vehicles
Intangible assets
Equity accounted investments
Other investments and loans
Receivables
Derivative financial instruments
Deferred income tax assets
Current assets
Inventories
Trade and other receivables
Current income tax assets
Derivative financial instruments
Cash and cash equivalents
Total assets
-2000.00% 0.00% 2000.00% 4000.00% 6000.00% 8000.00% 10000.00% 12000.00%
Horizontal Analysis Balance sheet Mediclinic
2013 2014 2015 2016
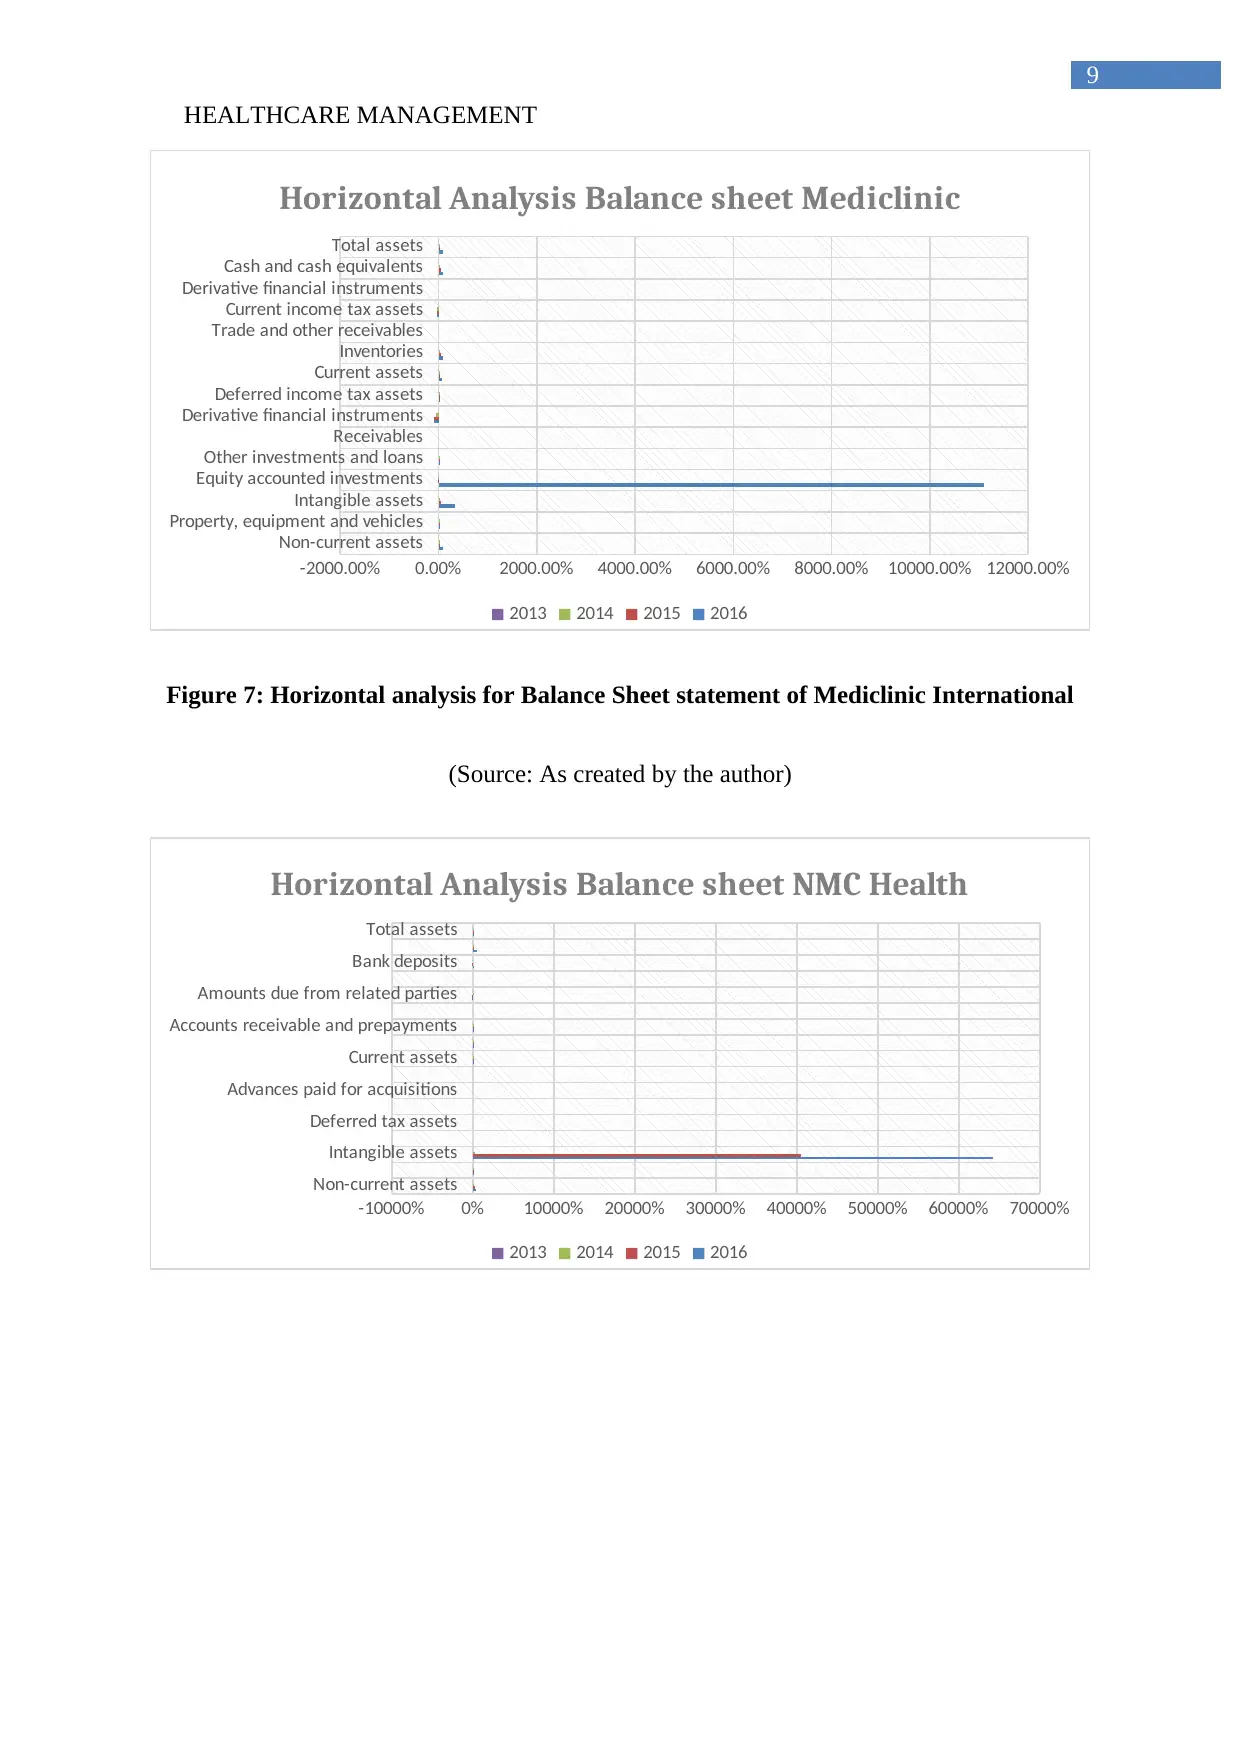
Figure 7: Horizontal analysis for Balance Sheet statement of Mediclinic International
(Source: As created by the author)
Non-current assets
Intangible assets
Deferred tax assets
Advances paid for acquisitions
Current assets
Accounts receivable and prepayments
Amounts due from related parties
Bank deposits
Total assets
-10000% 0% 10000% 20000% 30000% 40000% 50000% 60000% 70000%
Horizontal Analysis Balance sheet NMC Health
2013 2014 2015 2016
9
Non-current assets
Property, equipment and vehicles
Intangible assets
Equity accounted investments
Other investments and loans
Receivables
Derivative financial instruments
Deferred income tax assets
Current assets
Inventories
Trade and other receivables
Current income tax assets
Derivative financial instruments
Cash and cash equivalents
Total assets
-2000.00% 0.00% 2000.00% 4000.00% 6000.00% 8000.00% 10000.00% 12000.00%
Horizontal Analysis Balance sheet Mediclinic
2013 2014 2015 2016
Figure 7: Horizontal analysis for Balance Sheet statement of Mediclinic International
(Source: As created by the author)
Non-current assets
Intangible assets
Deferred tax assets
Advances paid for acquisitions
Current assets
Accounts receivable and prepayments
Amounts due from related parties
Bank deposits
Total assets
-10000% 0% 10000% 20000% 30000% 40000% 50000% 60000% 70000%
Horizontal Analysis Balance sheet NMC Health
2013 2014 2015 2016
Paraphrase This Document
Need a fresh take? Get an instant paraphrase of this document with our AI Paraphraser
HEALTHCARE MANAGEMENT
10
Share capital
Group restructuring reserve
Option redemption reserves
Equity attributable
Total equity
Non-current liabilities
Employees' end of service benefits
Option redemption payable
Current liabilities
Other payables
Bank overdrafts and other short term borrowings
Employees' end of service benefits
Total liabilities
-2000% 0% 2000% 4000% 6000% 8000% 10000% 12000%
Horizontal Analysis Balance sheet NMC Health
2013 2014 2015 2016
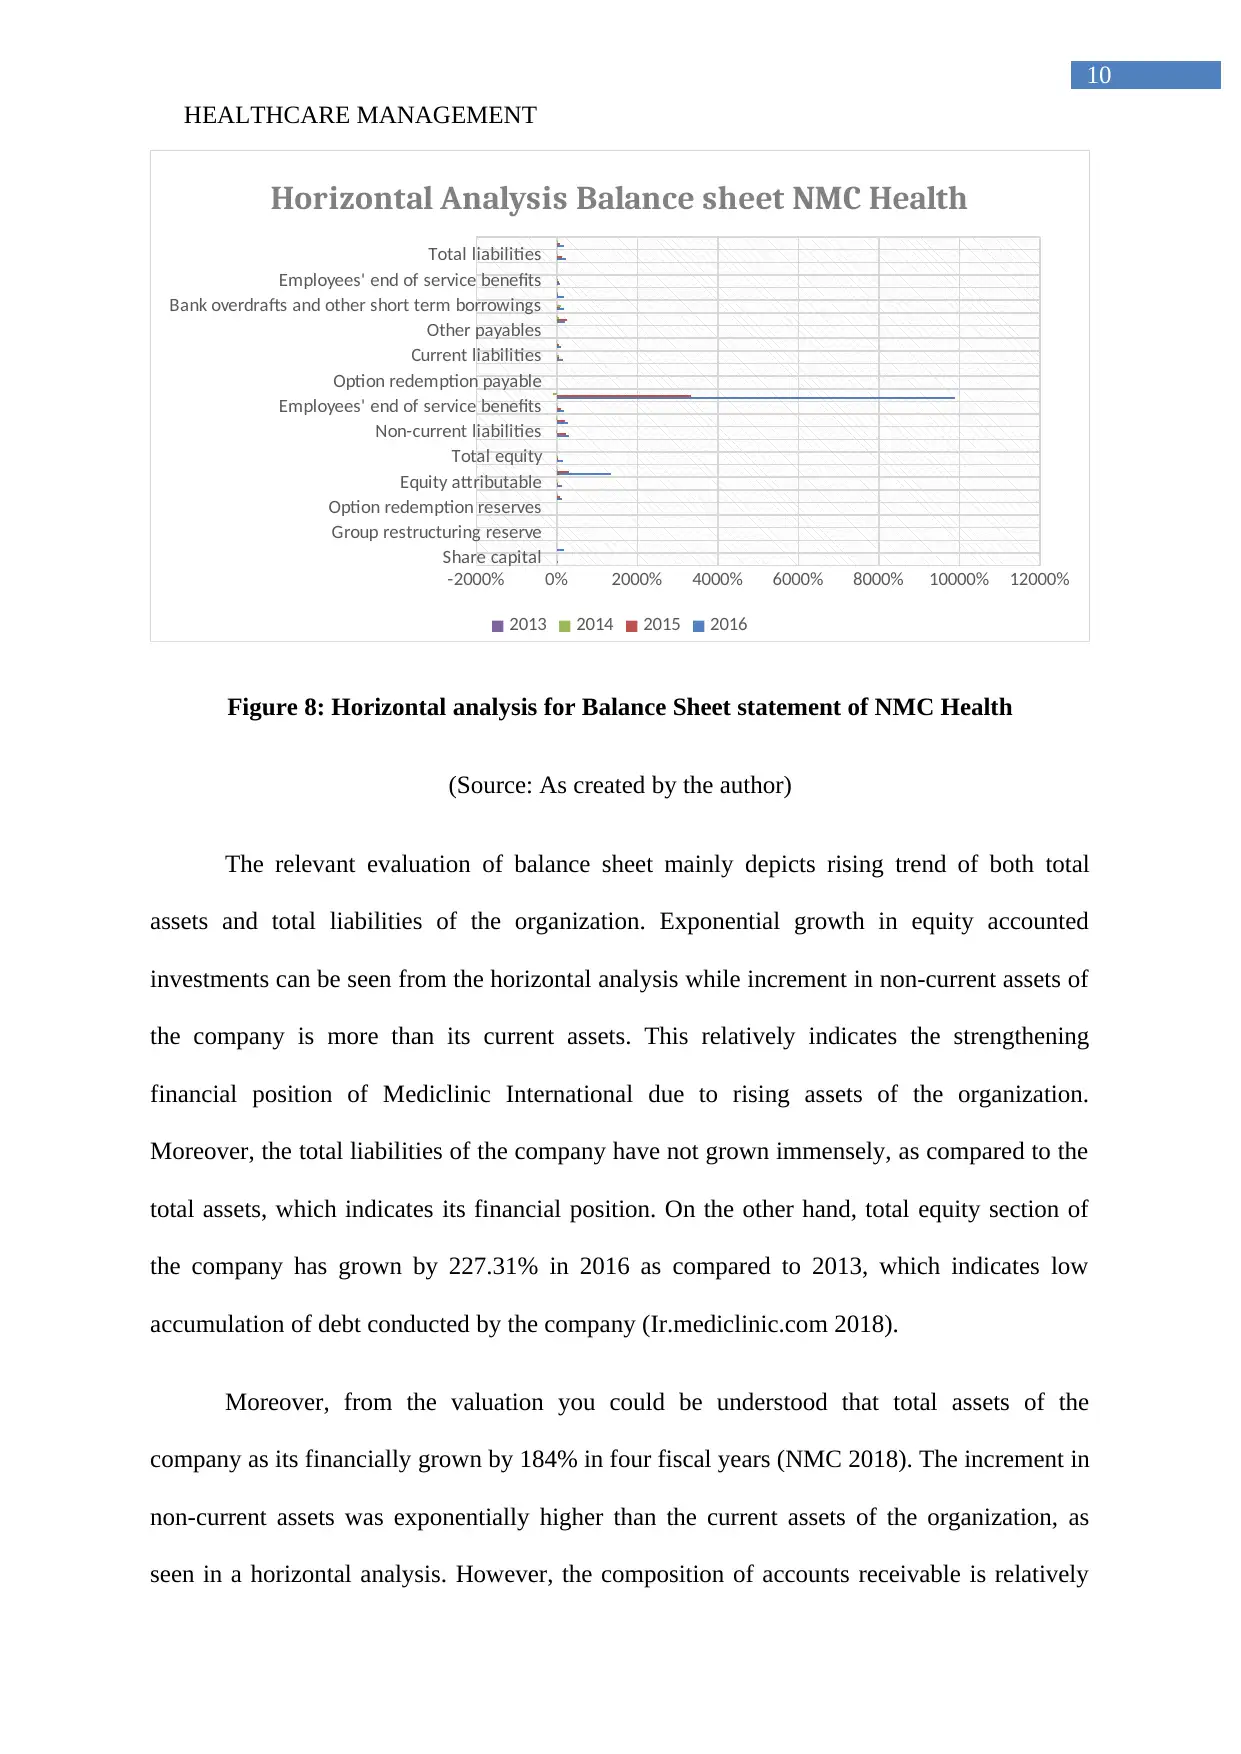
Figure 8: Horizontal analysis for Balance Sheet statement of NMC Health
(Source: As created by the author)
The relevant evaluation of balance sheet mainly depicts rising trend of both total
assets and total liabilities of the organization. Exponential growth in equity accounted
investments can be seen from the horizontal analysis while increment in non-current assets of
the company is more than its current assets. This relatively indicates the strengthening
financial position of Mediclinic International due to rising assets of the organization.
Moreover, the total liabilities of the company have not grown immensely, as compared to the
total assets, which indicates its financial position. On the other hand, total equity section of
the company has grown by 227.31% in 2016 as compared to 2013, which indicates low
accumulation of debt conducted by the company (Ir.mediclinic.com 2018).
Moreover, from the valuation you could be understood that total assets of the
company as its financially grown by 184% in four fiscal years (NMC 2018). The increment in
non-current assets was exponentially higher than the current assets of the organization, as
seen in a horizontal analysis. However, the composition of accounts receivable is relatively
10
Share capital
Group restructuring reserve
Option redemption reserves
Equity attributable
Total equity
Non-current liabilities
Employees' end of service benefits
Option redemption payable
Current liabilities
Other payables
Bank overdrafts and other short term borrowings
Employees' end of service benefits
Total liabilities
-2000% 0% 2000% 4000% 6000% 8000% 10000% 12000%
Horizontal Analysis Balance sheet NMC Health
2013 2014 2015 2016
Figure 8: Horizontal analysis for Balance Sheet statement of NMC Health
(Source: As created by the author)
The relevant evaluation of balance sheet mainly depicts rising trend of both total
assets and total liabilities of the organization. Exponential growth in equity accounted
investments can be seen from the horizontal analysis while increment in non-current assets of
the company is more than its current assets. This relatively indicates the strengthening
financial position of Mediclinic International due to rising assets of the organization.
Moreover, the total liabilities of the company have not grown immensely, as compared to the
total assets, which indicates its financial position. On the other hand, total equity section of
the company has grown by 227.31% in 2016 as compared to 2013, which indicates low
accumulation of debt conducted by the company (Ir.mediclinic.com 2018).
Moreover, from the valuation you could be understood that total assets of the
company as its financially grown by 184% in four fiscal years (NMC 2018). The increment in
non-current assets was exponentially higher than the current assets of the organization, as
seen in a horizontal analysis. However, the composition of accounts receivable is relatively
HEALTHCARE MANAGEMENT
11
higher, which could relatively block essential capital. However, the equity section has
experienced an exponential growth in total liabilities by 221% in 2016. On the other hand, the
equity section of the company has only grown by 114%. This relatively indicates that NMC
Health has accumulated debt to support its financial operations, which increases the chance of
insolvency for the company.
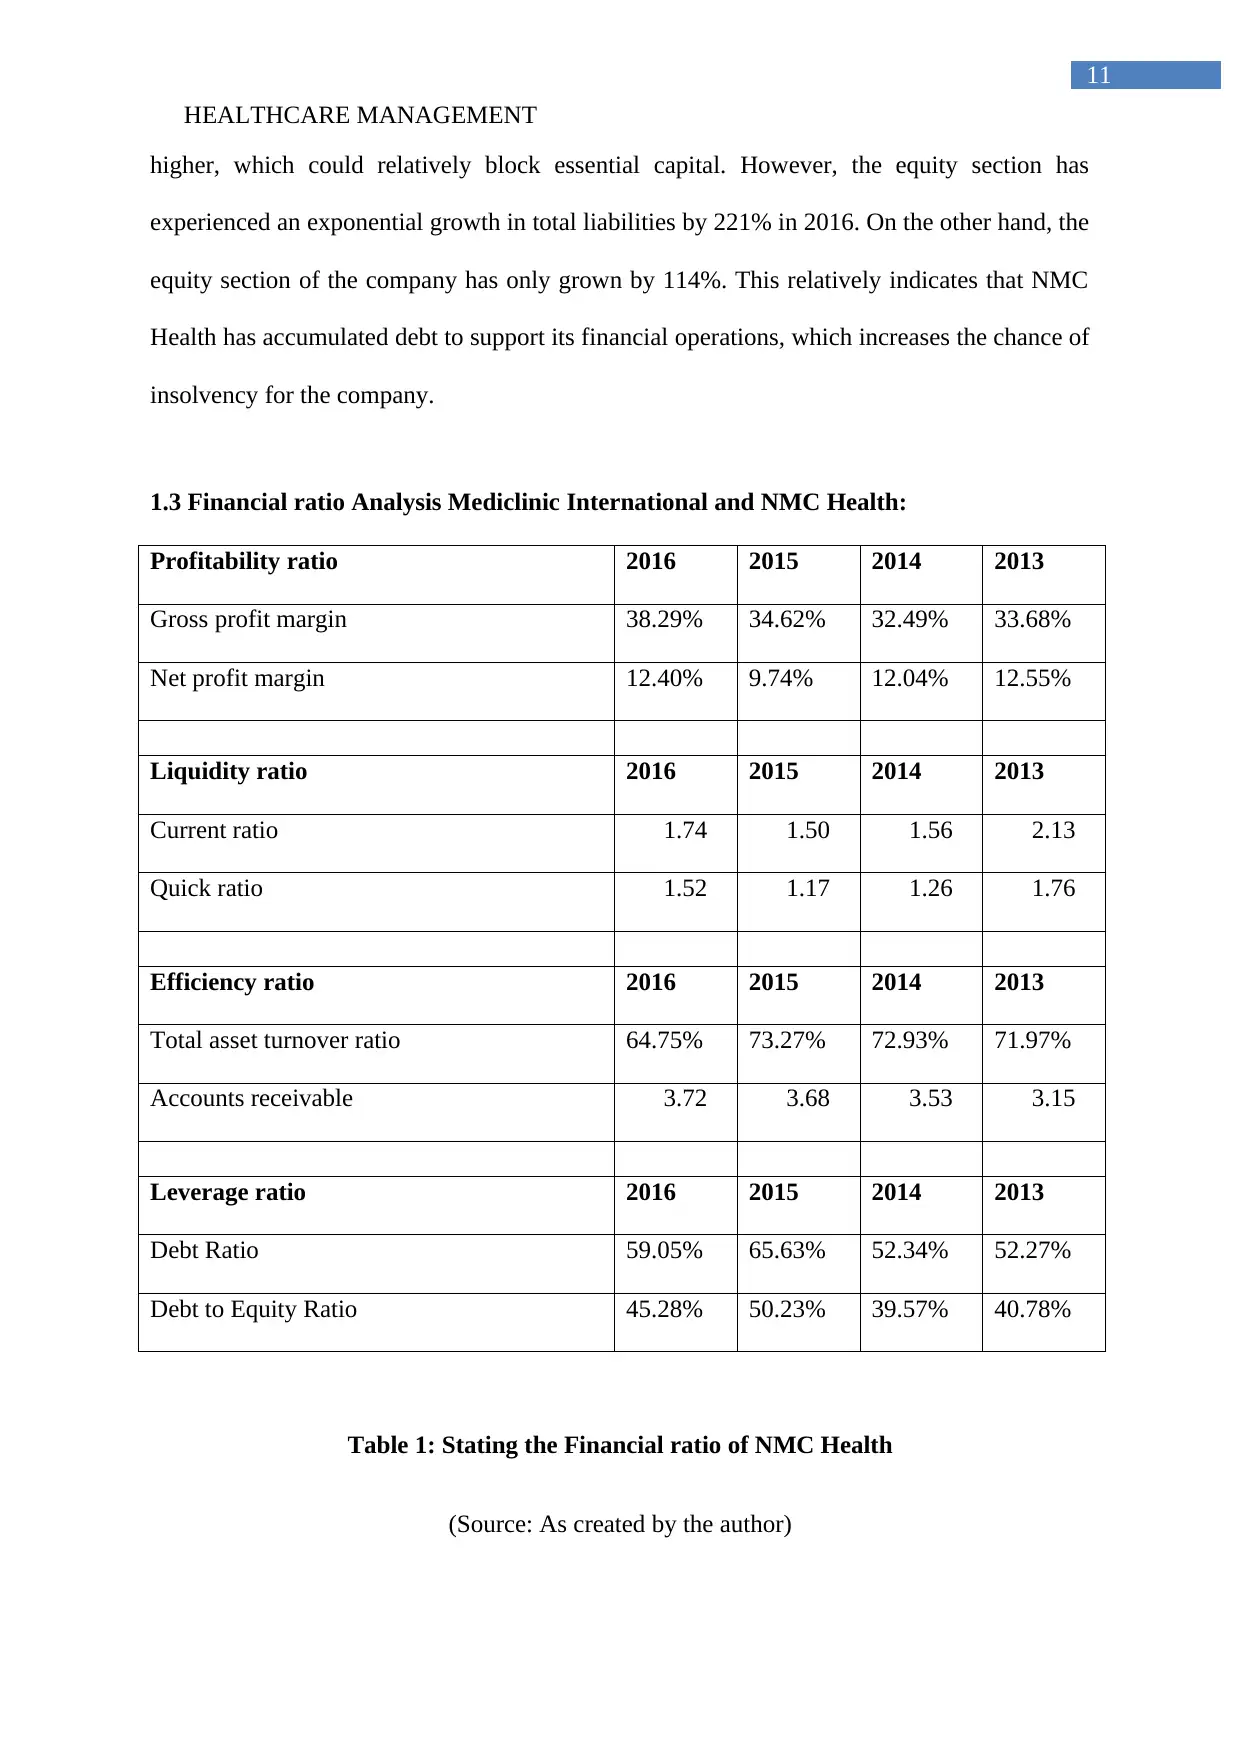
1.3 Financial ratio Analysis Mediclinic International and NMC Health:
Profitability ratio 2016 2015 2014 2013
Gross profit margin 38.29% 34.62% 32.49% 33.68%
Net profit margin 12.40% 9.74% 12.04% 12.55%
Liquidity ratio 2016 2015 2014 2013
Current ratio 1.74 1.50 1.56 2.13
Quick ratio 1.52 1.17 1.26 1.76
Efficiency ratio 2016 2015 2014 2013
Total asset turnover ratio 64.75% 73.27% 72.93% 71.97%
Accounts receivable 3.72 3.68 3.53 3.15
Leverage ratio 2016 2015 2014 2013
Debt Ratio 59.05% 65.63% 52.34% 52.27%
Debt to Equity Ratio 45.28% 50.23% 39.57% 40.78%
Table 1: Stating the Financial ratio of NMC Health
(Source: As created by the author)
11
higher, which could relatively block essential capital. However, the equity section has
experienced an exponential growth in total liabilities by 221% in 2016. On the other hand, the
equity section of the company has only grown by 114%. This relatively indicates that NMC
Health has accumulated debt to support its financial operations, which increases the chance of
insolvency for the company.
1.3 Financial ratio Analysis Mediclinic International and NMC Health:
Profitability ratio 2016 2015 2014 2013
Gross profit margin 38.29% 34.62% 32.49% 33.68%
Net profit margin 12.40% 9.74% 12.04% 12.55%
Liquidity ratio 2016 2015 2014 2013
Current ratio 1.74 1.50 1.56 2.13
Quick ratio 1.52 1.17 1.26 1.76
Efficiency ratio 2016 2015 2014 2013
Total asset turnover ratio 64.75% 73.27% 72.93% 71.97%
Accounts receivable 3.72 3.68 3.53 3.15
Leverage ratio 2016 2015 2014 2013
Debt Ratio 59.05% 65.63% 52.34% 52.27%
Debt to Equity Ratio 45.28% 50.23% 39.57% 40.78%
Table 1: Stating the Financial ratio of NMC Health
(Source: As created by the author)
⊘ This is a preview!⊘
Do you want full access?
Subscribe today to unlock all pages.
Trusted by 1+ million students worldwide
1 out of 21
Related Documents


Your All-in-One AI-Powered Toolkit for Academic Success.
+13062052269
info@desklib.com
Available 24*7 on WhatsApp / Email
![[object Object]](/_next/static/media/star-bottom.7253800d.svg)
Unlock your academic potential
Copyright © 2020–2026 A2Z Services. All Rights Reserved. Developed and managed by ZUCOL.