Managerial Finance: Comparative Analysis of M&S PLC and Next PLC
VerifiedAdded on 2020/12/09
|14
|4030
|491
Report
AI Summary
This report presents a comparative financial analysis of Marks and Spencer PLC and Next PLC for the years 2018 and 2017. It begins with an executive summary and a table of contents, followed by a detailed calculation and analysis of ten financial ratios for both companies, including current ratio, quick ratio, and profitability metrics. The report compares the financial positions of the two organizations, highlighting the strengths and weaknesses of each. It then evaluates a capital investment project for Brooks Private Limited, utilizing investment appraisal techniques to determine the most profitable project. The analysis includes discussions on the limitations of relying on financial ratios and investment appraisal techniques. Finally, the report provides recommendations for improving the financial performance of Next PLC, concluding with a summary of findings and a reference list.

MANAGERIAL FINANCE
STUDENT’S NAME:
STUDENT’S ID:
STUDENT’S NAME:
STUDENT’S ID:
Paraphrase This Document
Need a fresh take? Get an instant paraphrase of this document with our AI Paraphraser
Executive summary
The present report has focused on evaluating and calculating the financial report of both Marks
and Spencer PLC and Next PLC for the years 2018 and 2017. Based on the financial ratios this
report has compared the current financial position of both organisations in the market. Finally,
this report has analysed the project of Brooks Private Limited. Using relevant investment
appraisal technique the report has determined the most profitable project for the company. The
financial position of Marks and Spencer PLC is better than Next PLC. The liquidity ratios of
both companies have shown that Marks and Spencer PLC has high current and quick ratio rate
compared to Next PLC. This has increased financial crisis for Next PLC in the current financial
year. Additionally, Next PLC can face difficulties to meet their short-term and long-term market
liabilities compared to Marks and Spencer PLC. Based on the investment appraisal techniques of
both projects it can be understood that Alpha project is more appropriate compared to Beta
project. The Beta project can reduce the payback period for the company. Nonetheless, the rate
of returns can decrease and the cash expenses can expand in future.
2
Table of Contents
Introduction......................................................................................................................................4
Task 1:.............................................................................................................................................4
Calculation of 10 financial ratios of both companies..................................................................4
Analysis the performance, financial position and investment potential of both companies........6
Recommendations for the financial performance of poorly performing business improvement 8
Discussion of limitations of relying on financial ratios to interpret companies’ performance....9
Task 2: Capital Investment Appraisal............................................................................................10
Advising senior management on whether they should opt for the Alpha project or Beta project
based on investment appraisal techniques.................................................................................10
Discussion the limitations of using investment appraisal techniques to help in long-term
decision making.........................................................................................................................11
Conclusion.....................................................................................................................................12
Reference list.................................................................................................................................13
3
⊘ This is a preview!⊘
Do you want full access?
Subscribe today to unlock all pages.
Trusted by 1+ million students worldwide
Introduction
Ratio analysis can help business organisations to identify their current financial health. The
present report has focused on evaluating and calculating the financial report of both Marks and
Spencer PLC and Next PLC for the years 2018 and 2017. Marks and Spencer PLC is a large
retailing organisation of United Kingdom. The organisation has more than 1,025 stores in the
country (Marksandspencer, 2018). Next PLC is a retail organisation that has been launched in
February 1982. In the current year Next has more than 500 stores in the United Kingdom (Next,
2018). Based on the financial ratios this report has compared the current financial position of
both organisations in the market. Finally, this report has analysed the project of Brooks Private
Limited. Using relevant investment appraisal technique the report has determined the most
profitable project for the company.
Task 1:
Calculation of 10 financial ratios of both companies
Ratio
Marks and Spencer
PLC Next PLC
2018 2017 2018 2017
Current ratios 0.72 0.73 -1.94 -2.29
Quick ratios 0.76 0.89 -2.48 -2.91
Net Profit Margin 1.00 1.01 0.15 0.16
Gross Profit margin 0.99 0.99 0.33 0.34
Debt-to-equity ratio 1.55 1.63 -4.31 -3.71
P/E ratio 0.1% 1.6% 0.3% 0.3%
Earnings per share 1.6 7.2 416.7 441.3
Return on capital employed 0.017 0.024 0.47 0.49
Average inventories turnover
period -0.15 -0.15 -5.51 -6.01
Dividend payout ratio 11.688 2.361 0.005 0.012
Table 1: Ratio analysis of Marks and Spencer PLC and Next PLC
4
Paraphrase This Document
Need a fresh take? Get an instant paraphrase of this document with our AI Paraphraser
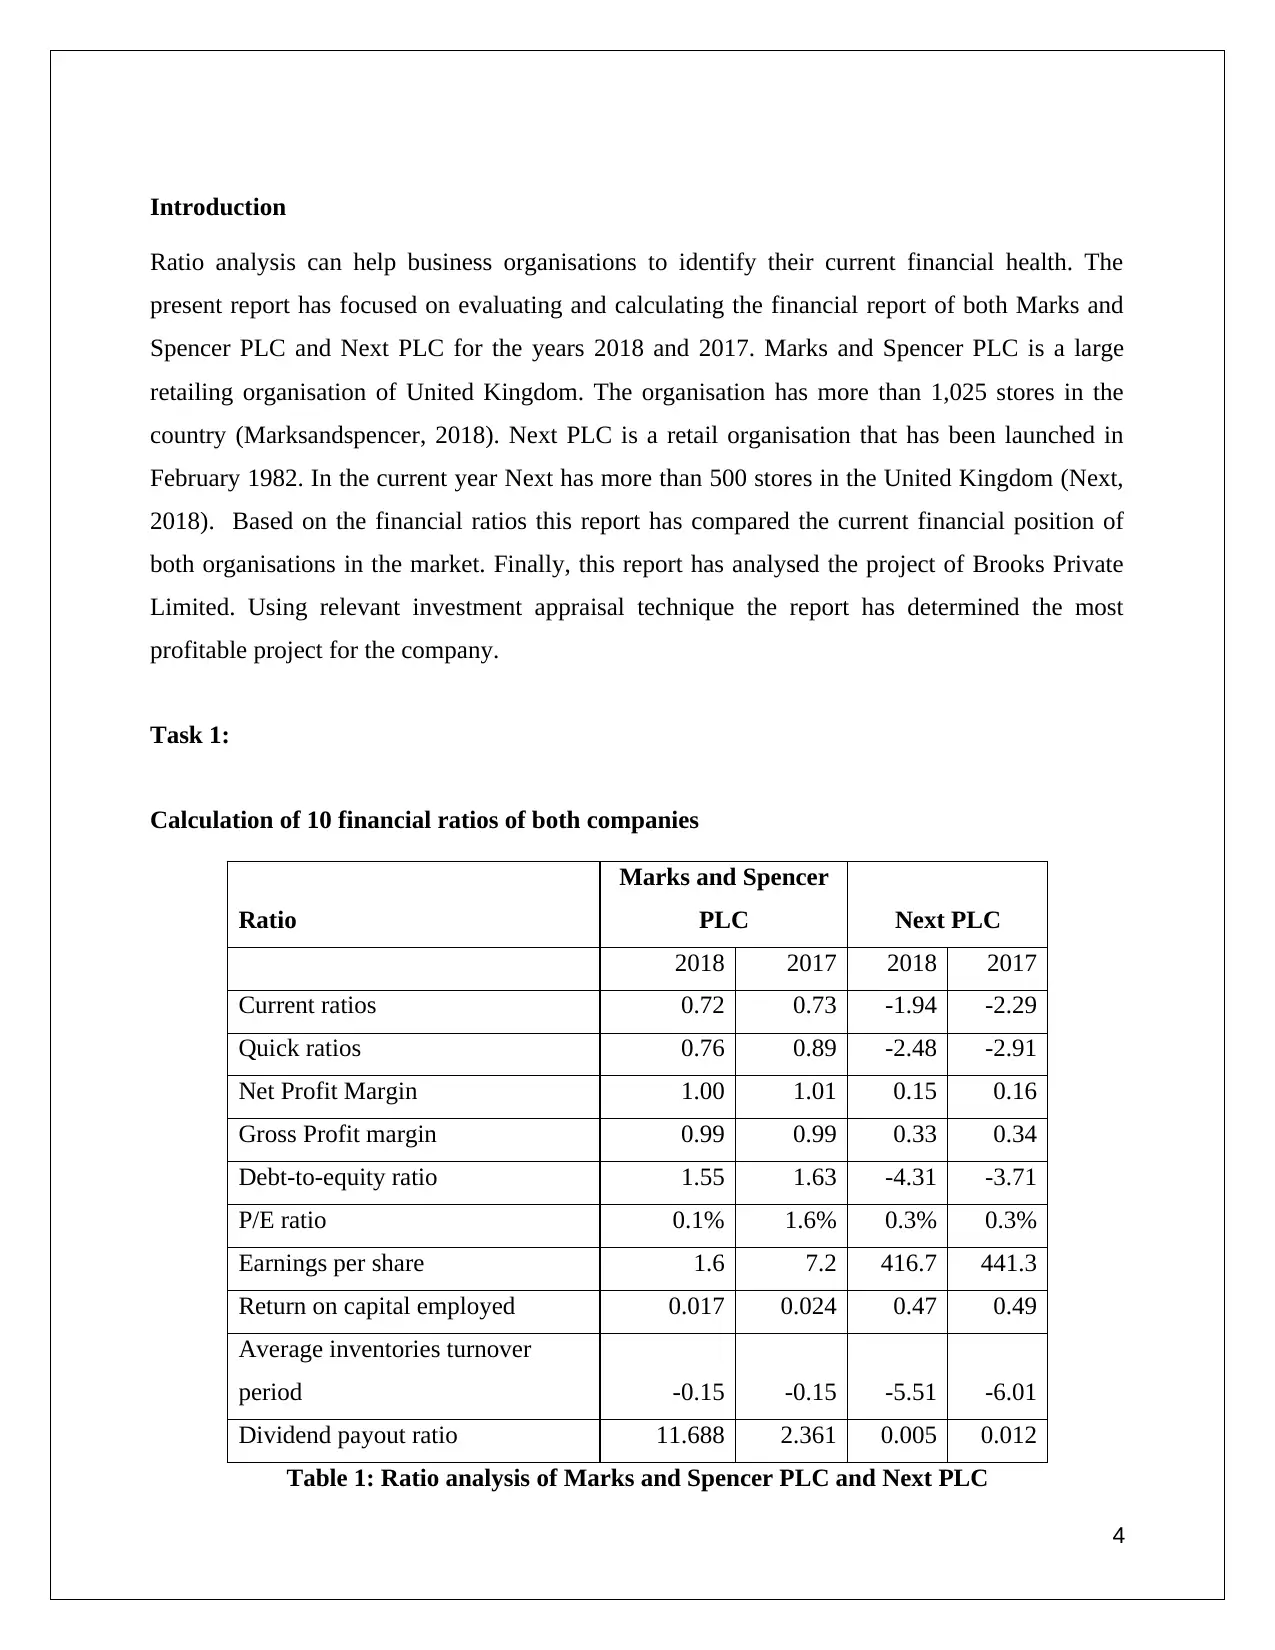
(Source: Nextplc, 2018; Corporate, 2018)
The above table has clearly shown that Marks and Spencer PLC has been able to maintain
favourable financial ratios compared to Next PLC. However, Marks and Spencer PLC has failed
to maintain a high ratio growth per year. It has been understood that the current ratio and quick
ratio of Marks and Spencer PLC has been 0.73 and 0.89 respectively in 2017. However, the
current ratio of the organisation has decreased in 2018 from 0.73 and 0.89 to 0.72 and 0.76
(Nextplc, 2018). This has cleared that the business organisation has failed to maintain assets
liquidity in 2018. Additionally, market liabilities of Marks and Spencer PLC have also increased
in 2018 compared to 2017. This can increase financial crisis for the company in future.
Additionally, Marks and Spencer PLC can face difficulties to meet their short-term and long-
term market liabilities in the business. This can also be increased the possibility of bankruptcy
for the company as they are facing high market liabilities.
The profitability ratios of Marks and Spencer PLC have clearly shown that both net profit margin
and gross profit margin has not increased in 2018. On the other hand, the net profit margin of
Marks and Spencer PLC has decreased due to high finance cost in the current year. The gearing
ratio of the organisation has decreased compared to 2017. This has helped to avoid irrelevant
cash expenses in the business compared. The EPS and price earnings ratio of both organisations
has decreased over the year. Therefore, in the views of Dehnavi et al. (2015, p.122), the capital
amount has reduced in the current year. Finally, the efficiency ratios of Marks and Spencer PLC
has described that the company has failed to improve their inventory management system.
Nonetheless, the dividend payout ratio has increased in 2018 compared to 2017.
On the contrary, it has been understood from the ratio analysis of Next PLC has a low rate of
current ratio and quick ratio. The liquidity ratios have increased in 2018 compared to 2017.
However, the ratio rate is not appropriate for meeting their short-term and long-term market
liabilities. The profitability ratios of Next PLC have decreased over the year due to high financial
expenses per year. Finally, it has been understood that both investors’ ratios and efficiency ratios
have decreased in 2018 compared to 2017. In the opinions of Uechi et al. (2015, p.488), low
price earnings ratio and average inventories turnover can reduce sales revenue growth in future.
Therefore, the possibility of insolvency can expand in future financial year.
5
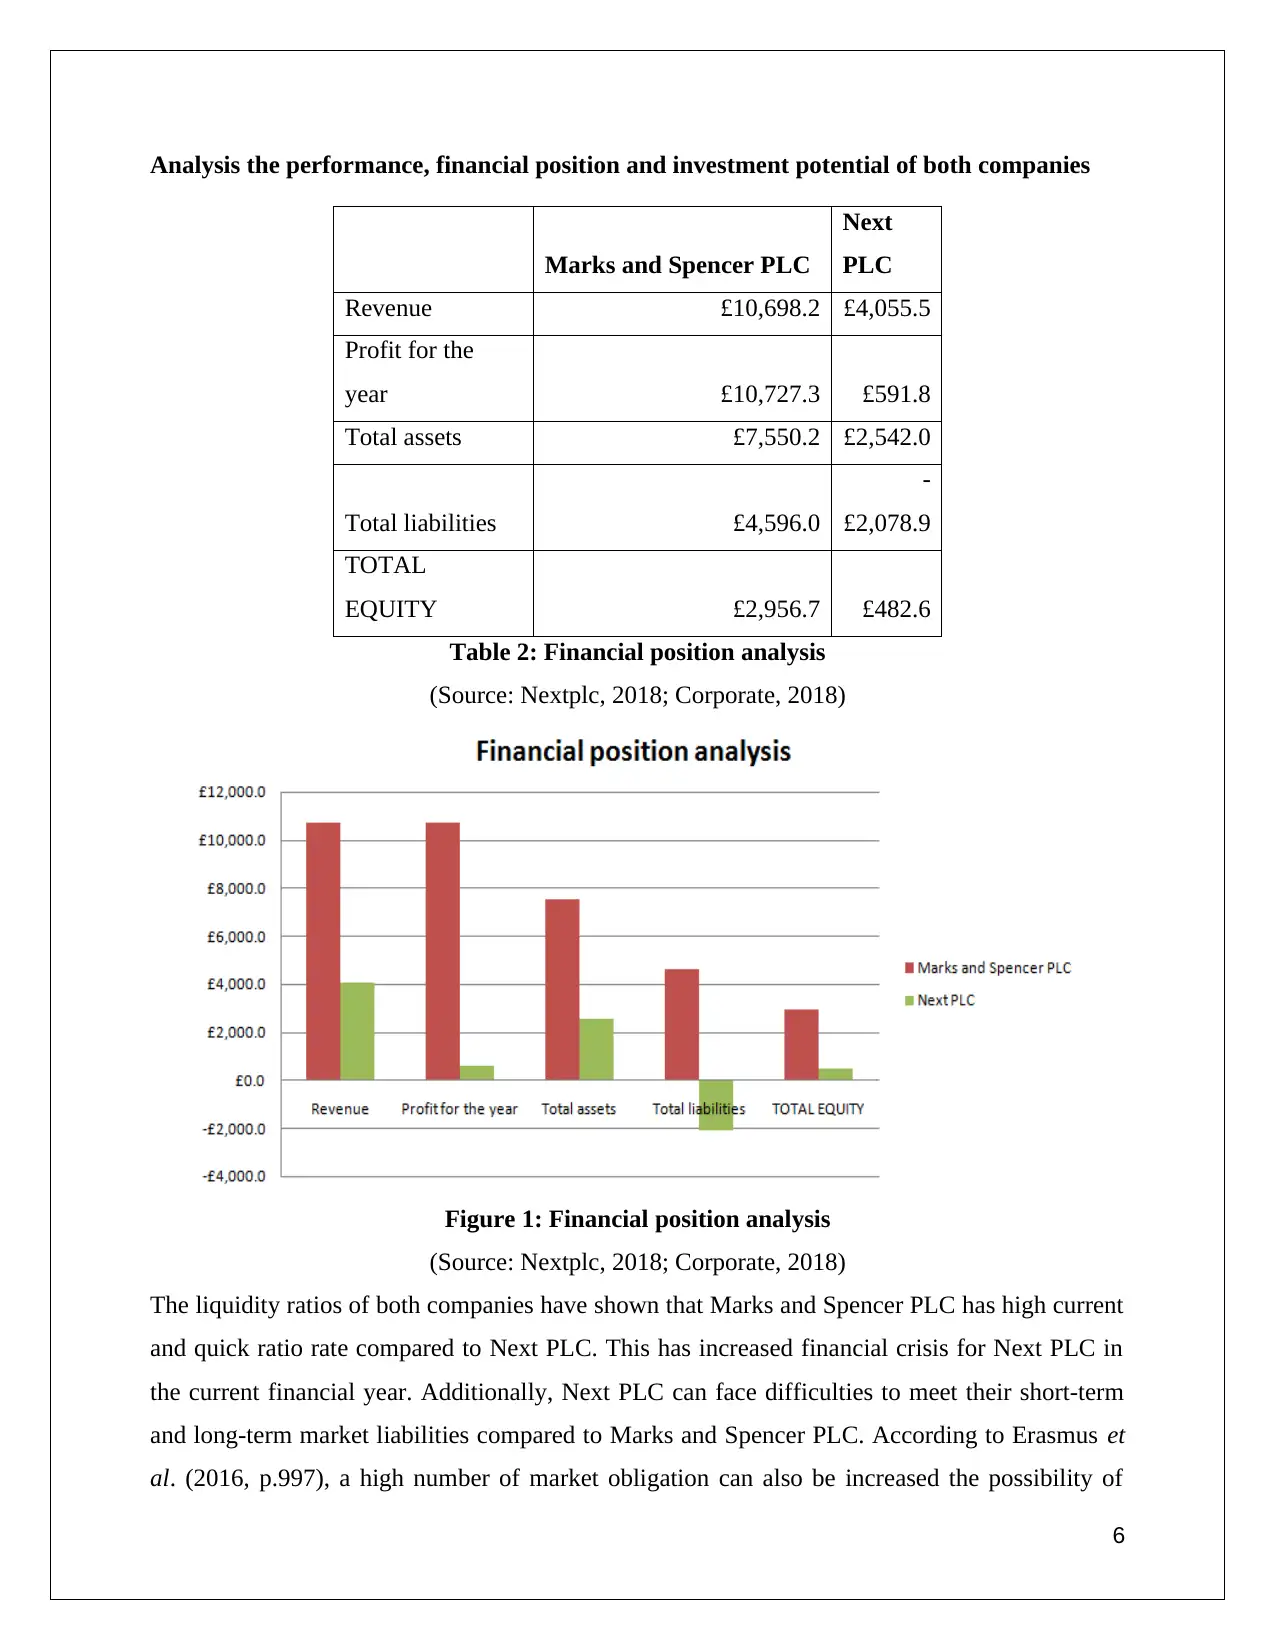
Analysis the performance, financial position and investment potential of both companies
Marks and Spencer PLC
Next
PLC
Revenue £10,698.2 £4,055.5
Profit for the
year £10,727.3 £591.8
Total assets £7,550.2 £2,542.0
Total liabilities £4,596.0
-
£2,078.9
TOTAL
EQUITY £2,956.7 £482.6
Table 2: Financial position analysis
(Source: Nextplc, 2018; Corporate, 2018)
Figure 1: Financial position analysis
(Source: Nextplc, 2018; Corporate, 2018)
The liquidity ratios of both companies have shown that Marks and Spencer PLC has high current
and quick ratio rate compared to Next PLC. This has increased financial crisis for Next PLC in
the current financial year. Additionally, Next PLC can face difficulties to meet their short-term
and long-term market liabilities compared to Marks and Spencer PLC. According to Erasmus et
al. (2016, p.997), a high number of market obligation can also be increased the possibility of
6
⊘ This is a preview!⊘
Do you want full access?
Subscribe today to unlock all pages.
Trusted by 1+ million students worldwide
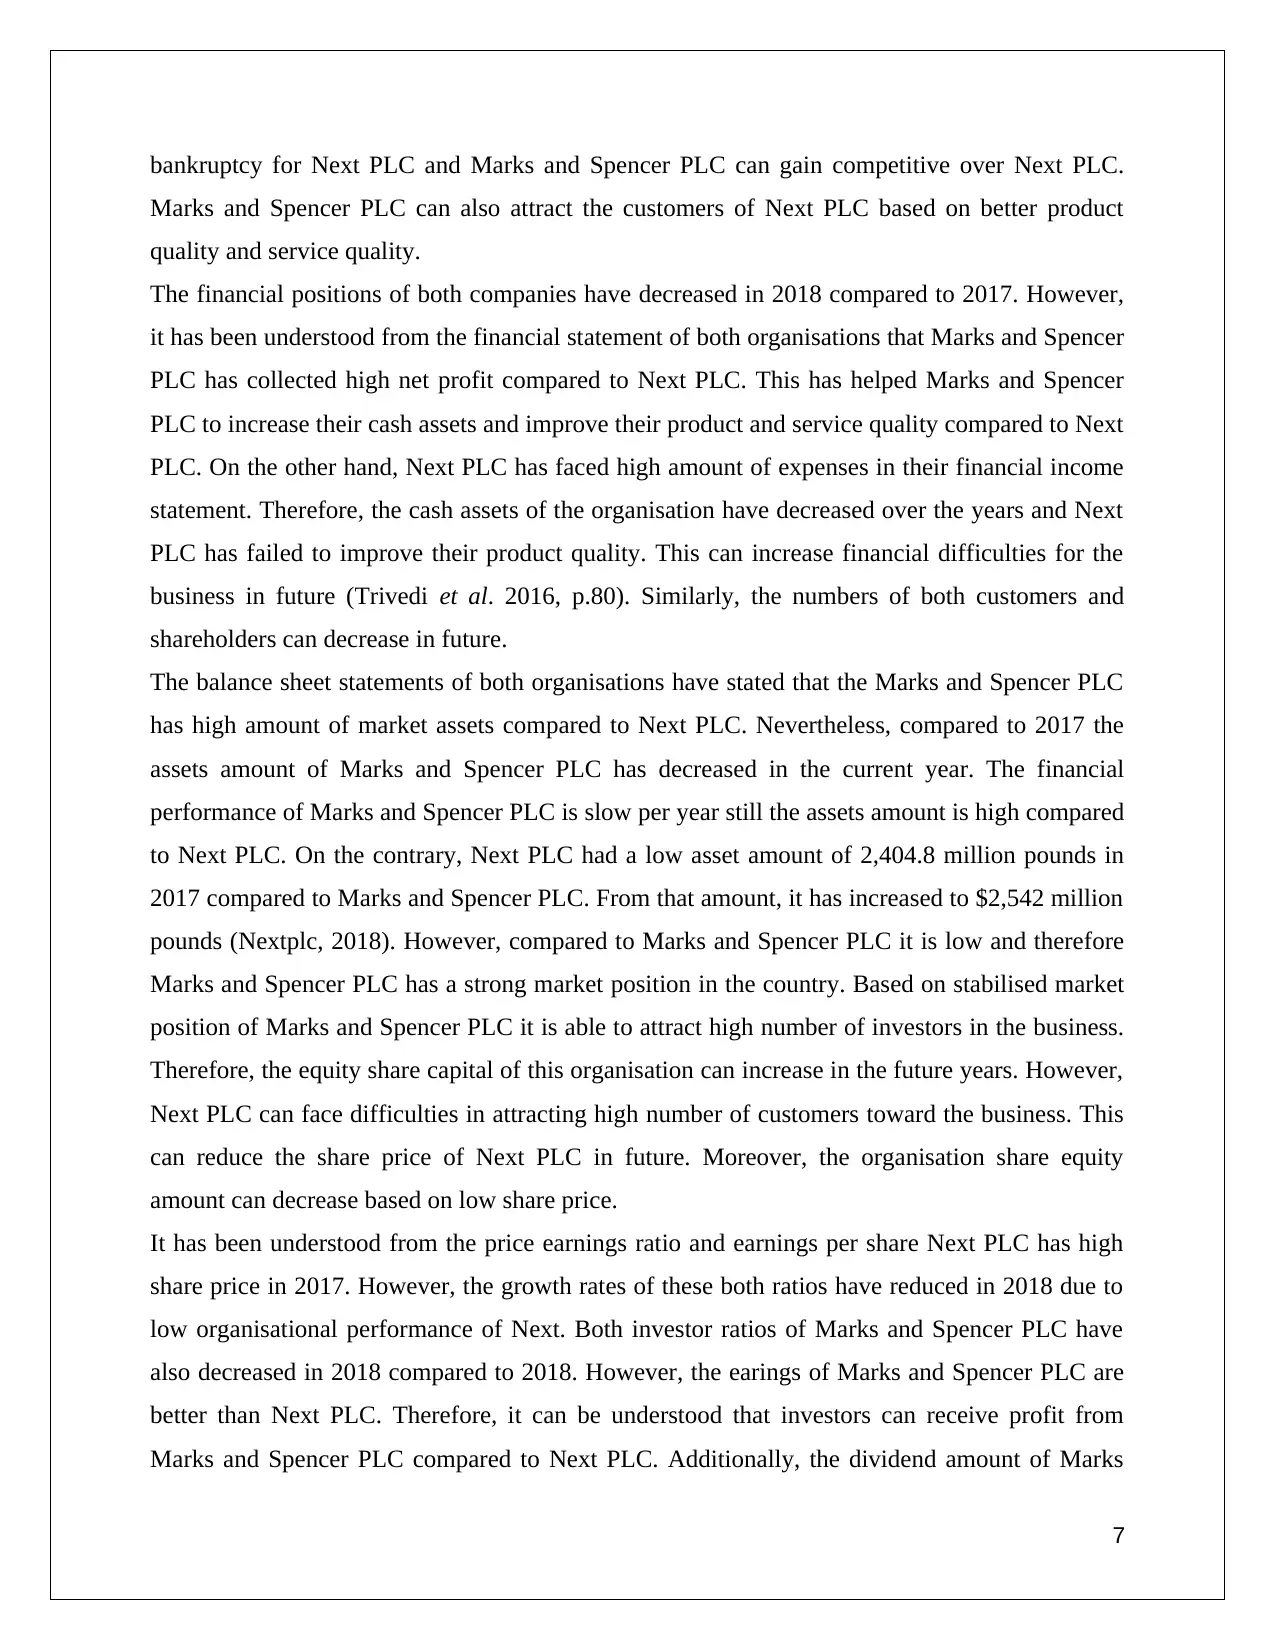
bankruptcy for Next PLC and Marks and Spencer PLC can gain competitive over Next PLC.
Marks and Spencer PLC can also attract the customers of Next PLC based on better product
quality and service quality.
The financial positions of both companies have decreased in 2018 compared to 2017. However,
it has been understood from the financial statement of both organisations that Marks and Spencer
PLC has collected high net profit compared to Next PLC. This has helped Marks and Spencer
PLC to increase their cash assets and improve their product and service quality compared to Next
PLC. On the other hand, Next PLC has faced high amount of expenses in their financial income
statement. Therefore, the cash assets of the organisation have decreased over the years and Next
PLC has failed to improve their product quality. This can increase financial difficulties for the
business in future (Trivedi et al. 2016, p.80). Similarly, the numbers of both customers and
shareholders can decrease in future.
The balance sheet statements of both organisations have stated that the Marks and Spencer PLC
has high amount of market assets compared to Next PLC. Nevertheless, compared to 2017 the
assets amount of Marks and Spencer PLC has decreased in the current year. The financial
performance of Marks and Spencer PLC is slow per year still the assets amount is high compared
to Next PLC. On the contrary, Next PLC had a low asset amount of 2,404.8 million pounds in
2017 compared to Marks and Spencer PLC. From that amount, it has increased to $2,542 million
pounds (Nextplc, 2018). However, compared to Marks and Spencer PLC it is low and therefore
Marks and Spencer PLC has a strong market position in the country. Based on stabilised market
position of Marks and Spencer PLC it is able to attract high number of investors in the business.
Therefore, the equity share capital of this organisation can increase in the future years. However,
Next PLC can face difficulties in attracting high number of customers toward the business. This
can reduce the share price of Next PLC in future. Moreover, the organisation share equity
amount can decrease based on low share price.
It has been understood from the price earnings ratio and earnings per share Next PLC has high
share price in 2017. However, the growth rates of these both ratios have reduced in 2018 due to
low organisational performance of Next. Both investor ratios of Marks and Spencer PLC have
also decreased in 2018 compared to 2018. However, the earings of Marks and Spencer PLC are
better than Next PLC. Therefore, it can be understood that investors can receive profit from
Marks and Spencer PLC compared to Next PLC. Additionally, the dividend amount of Marks
7
Paraphrase This Document
Need a fresh take? Get an instant paraphrase of this document with our AI Paraphraser
and Spencer PLC has increased in 2018 compared to Next. This has helped Marks and Spencer
PLC to collect high number of international stakeholder in 2018 and Marks and Spencer PLC has
expanded the market share compared to Next PLC.
The returns on capital employed of both organisations have decreased in 2018. This can increase
financial crisis for the organisation can increase in future as the cash growth has decreased.
Additionally, both business organisations have failed to improve their inventory management
system in the current compared to 2017. This can increase financial crisis of the company in
future and the organisations can decrease their financial performance per year (Qiu et al. 2016,
p.102). Based on the Return on capital employed and Average inventories turnover period both
Marks and Spencer PLC and Next PLC can face high market risks in future. This can reduce
their product and service quality and both companies can face market risks in future.
Recommendations for the financial performance of poorly performing business
improvement
Based on the financial statement of both companies it is clear that Next has poor performance
compared to Marks and Spencer PLC. Therefore, Next PLC can maintain the following steps in
the business.
Proper evaluation of financial statement
The CEO of Next PLC has to evaluate their financial statement per year to understand the
authenticity of annual report. This can increase help the company to reduce their unnecessary
expenses in the business. Additionally, CEO can introduce a new business policy to decrease the
wastage of raw materials in future. Low wastage of raw materials can help the organisation
increase their efficiency ratios in future year.
Introduce new and innovative business tools
Next PLC has increased their financial expenses in the current year. This has reduced their cash
assets in 2018 compared to 2017. Therefore, the business organisation can introduce new and
innovative strategy to gain external opportunities such as tax benefits. As influenced by the
opinions of Baum and Crosby (2014, p.17), in case the organisation managed to gain tax benefits
then the tax expenses of Next can decrease over the years. Moreover, the business organisation
can be able to maintain high profitability growth rate per year due to low financial expenses.
8
High cash assets can help the company to sustain their position in the competitive market and the
organisation can meet their long-term market obligations.
Hire highly experienced financial employees
The human resource manager of Next PLC has to hire highly skilled and experienced financial
employees in the business. Therefore, the employees can perform a proper investigation on the
management and collect accurate financial data in the business. This can help the business
organisation to reduce fraud and mistake on the financial statement and additionally the
organisation can gain competitive advantage over the rival organisations. Finally, the business
organisation can be able to maintain a relevant financial forecast in future.
Reduce number of borrowings
The CEO of Next PLC has to evaluate the past financial expenses in the business. Based on the
financial expenses the CEO can take a relevant business decision to reduce number of debts in
the market. As influenced by the opinions of Jacksoncan et al. (2015, p.43) low number of debts
help the business organisation to avoid high-interest rate in the market and maintain high
profitability growth from year to year. This can also help the business organisation to reduce
their market liabilities and sustain their position in the competitive market in future. In case Next
PLC manages to reduce their number of borrowing in the current financial year then they can
meet their market obligations.
Discussion of limitations of relying on financial ratios to interpret companies’ performance
In relation to the profitability, liquidity, investors and efficiency ratios both Next PLC and Marks
and Spencer PLC has faced some limitations in 2018. The limitations of both organisations have
been described below.
i) The liquidity ratios rates for both organisations have decreased in 2017 compared to 2018. It
has been clear that both organisations are unable to improve their assets liquidity per year. In
case the liquidity ratio of Next PLC and Marks and Spencer PLC decrease in future then
possibility of bankruptcy for both companies can increase in future.
ii) The profitability ratios of both companies have shown that both net profit margin and gross
profit margin have decreased in 2018. Due to high operating cost and finance cost, the operating
margins have decreased in the current year compared to 2017. This can reduce organisational
performances and both companies can expand market risks (Alkaraan, 2017, p.67).
9
⊘ This is a preview!⊘
Do you want full access?
Subscribe today to unlock all pages.
Trusted by 1+ million students worldwide
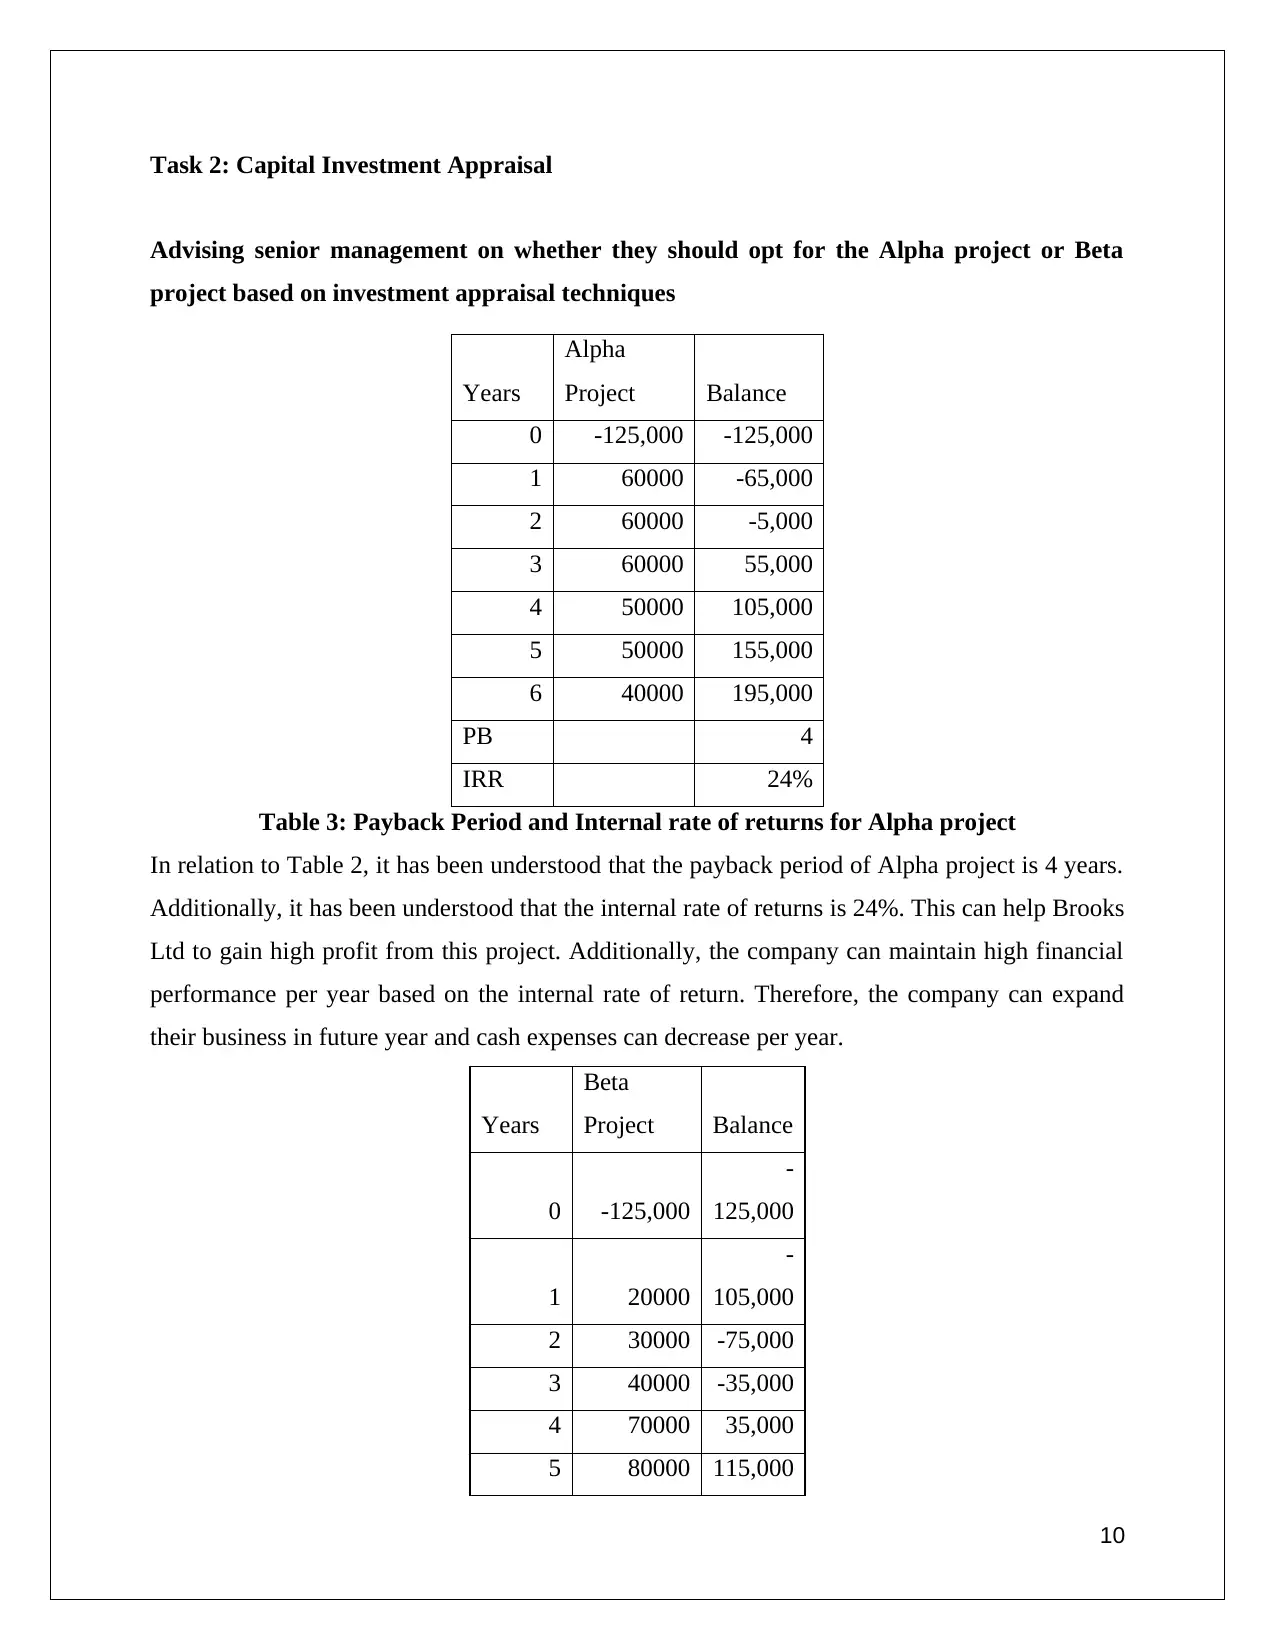
Task 2: Capital Investment Appraisal
Advising senior management on whether they should opt for the Alpha project or Beta
project based on investment appraisal techniques
Years
Alpha
Project Balance
0 -125,000 -125,000
1 60000 -65,000
2 60000 -5,000
3 60000 55,000
4 50000 105,000
5 50000 155,000
6 40000 195,000
PB 4
IRR 24%
Table 3: Payback Period and Internal rate of returns for Alpha project
In relation to Table 2, it has been understood that the payback period of Alpha project is 4 years.
Additionally, it has been understood that the internal rate of returns is 24%. This can help Brooks
Ltd to gain high profit from this project. Additionally, the company can maintain high financial
performance per year based on the internal rate of return. Therefore, the company can expand
their business in future year and cash expenses can decrease per year.
Years
Beta
Project Balance
0 -125,000
-
125,000
1 20000
-
105,000
2 30000 -75,000
3 40000 -35,000
4 70000 35,000
5 80000 115,000
10
Paraphrase This Document
Need a fresh take? Get an instant paraphrase of this document with our AI Paraphraser
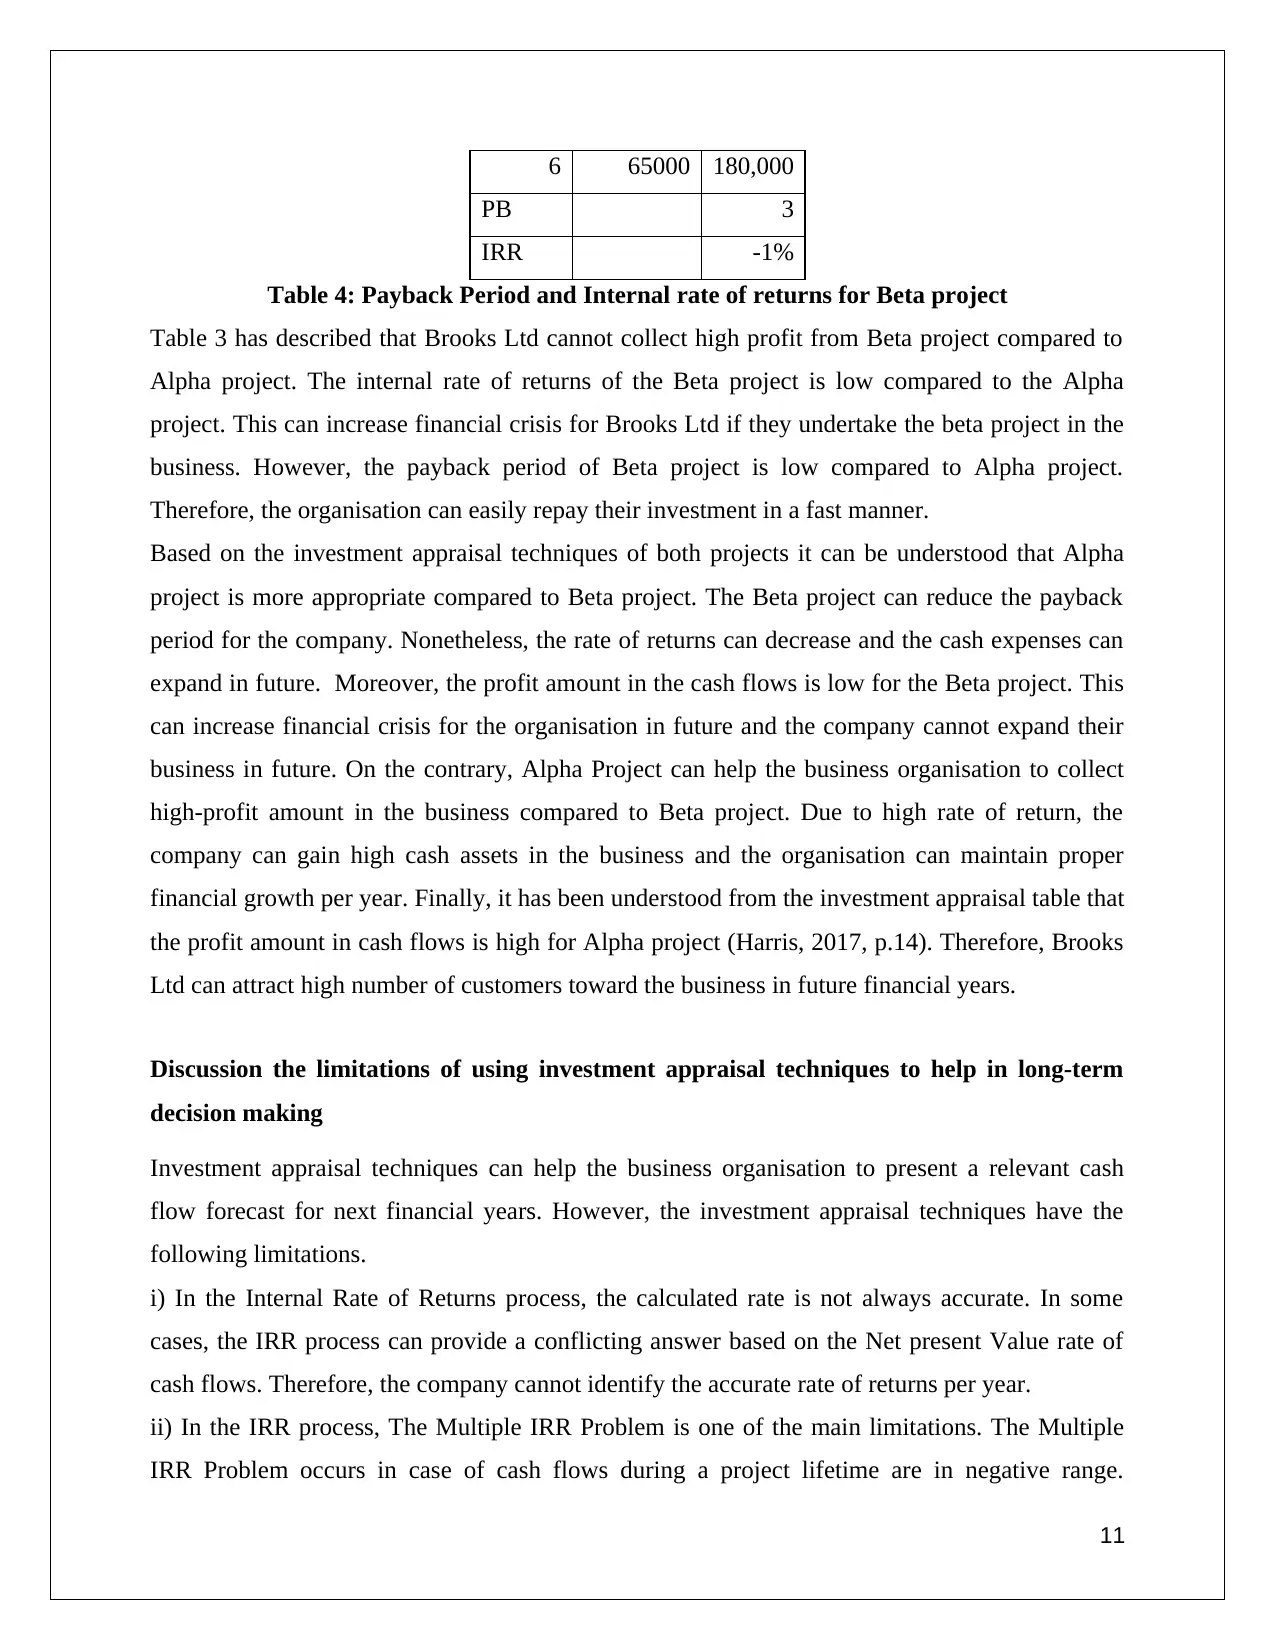
6 65000 180,000
PB 3
IRR -1%
Table 4: Payback Period and Internal rate of returns for Beta project
Table 3 has described that Brooks Ltd cannot collect high profit from Beta project compared to
Alpha project. The internal rate of returns of the Beta project is low compared to the Alpha
project. This can increase financial crisis for Brooks Ltd if they undertake the beta project in the
business. However, the payback period of Beta project is low compared to Alpha project.
Therefore, the organisation can easily repay their investment in a fast manner.
Based on the investment appraisal techniques of both projects it can be understood that Alpha
project is more appropriate compared to Beta project. The Beta project can reduce the payback
period for the company. Nonetheless, the rate of returns can decrease and the cash expenses can
expand in future. Moreover, the profit amount in the cash flows is low for the Beta project. This
can increase financial crisis for the organisation in future and the company cannot expand their
business in future. On the contrary, Alpha Project can help the business organisation to collect
high-profit amount in the business compared to Beta project. Due to high rate of return, the
company can gain high cash assets in the business and the organisation can maintain proper
financial growth per year. Finally, it has been understood from the investment appraisal table that
the profit amount in cash flows is high for Alpha project (Harris, 2017, p.14). Therefore, Brooks
Ltd can attract high number of customers toward the business in future financial years.
Discussion the limitations of using investment appraisal techniques to help in long-term
decision making
Investment appraisal techniques can help the business organisation to present a relevant cash
flow forecast for next financial years. However, the investment appraisal techniques have the
following limitations.
i) In the Internal Rate of Returns process, the calculated rate is not always accurate. In some
cases, the IRR process can provide a conflicting answer based on the Net present Value rate of
cash flows. Therefore, the company cannot identify the accurate rate of returns per year.
ii) In the IRR process, The Multiple IRR Problem is one of the main limitations. The Multiple
IRR Problem occurs in case of cash flows during a project lifetime are in negative range.
11
Therefore, this investment appraisal technique cannot calculate the relevant rate of returns in the
business. This can increase financial crisis for the company in future and the organisation
forecast can be corrupted.
iii) The payback period process takes no consideration of time value of money. Additionally, it
ignores the fact that some project has a greater payback period based on long payback period.
Therefore, it cannot be able to project proper investment repay amount in the business. This can
increase market risks for companies in future.
Conclusion
It can be concluded that from the above discussion that the financial position of Marks and
Spencer PLC is better than Next PLC. The liquidity ratios of both companies have shown that
Marks and Spencer PLC has high current and quick ratio rate compared to Next PLC. This has
increased financial crisis for Next PLC in the current financial year. Additionally, Next PLC can
face difficulties to meet their short-term and long-term market liabilities compared to Marks and
Spencer PLC. Based on the investment appraisal techniques of both projects it can be understood
that Alpha project is more appropriate compared to Beta project. The Beta project can reduce the
payback period for the company. Nonetheless, the rate of returns can decrease and the cash
expenses can expand in future.
12
⊘ This is a preview!⊘
Do you want full access?
Subscribe today to unlock all pages.
Trusted by 1+ million students worldwide
1 out of 14
Related Documents


Your All-in-One AI-Powered Toolkit for Academic Success.
+13062052269
info@desklib.com
Available 24*7 on WhatsApp / Email
![[object Object]](/_next/static/media/star-bottom.7253800d.svg)
Unlock your academic potential
Copyright © 2020–2026 A2Z Services. All Rights Reserved. Developed and managed by ZUCOL.