Comprehensive Financial Report: OOCL Performance Analysis (AAF0446)
VerifiedAdded on 2023/06/12
|13
|3066
|188
Report
AI Summary
This report provides a comprehensive analysis of Oriental Overseas Container Line (OOCL)'s financial and non-financial performance over the past two years, comparing it to key competitors like Cosco Shipping Line (CSL). The analysis includes ratio analysis of profitability, liquidity, efficiency, and gearing, highlighting trends and areas for improvement. Non-financial performance is evaluated through quarterly achievements and initiatives. A comparison with CSL reveals OOCL's strengths and weaknesses, leading to investment recommendations. The report concludes with an overall assessment of OOCL's financial health and future prospects, offering valuable insights for investors and stakeholders. Desklib provides access to this and many more solved assignments for students.
Accounting and Finance
AAF0446
AAF0446
Paraphrase This Document
Need a fresh take? Get an instant paraphrase of this document with our AI Paraphraser
TABLE OF CONTENTS
INTRODUCTION...........................................................................................................................3
MAIN BODY...................................................................................................................................4
Evaluating the performance of OOCL over the last two years in financial and non-financial....4
Terms...........................................................................................................................................4
Comparison of performance with key competitors......................................................................8
Recommendations to investors..................................................................................................10
CONCLUSION..............................................................................................................................11
REFERENCES..............................................................................................................................12
INTRODUCTION
Accounting & finance are the crucial part that helps the organization to gain the relevant
information about the financial practices so that taking sound decision can become possible. In
the current era, having effectual financial reporting is important in order to obtain reliable
understanding so that making appropriate decision-making can become possible. The current
report is based on Oriental k Overseas Container Line which is one of the firm operating in the
container shipping and logistic service sector. The specified firm has the presence in the
transportation, logistic and terminal company along with possessing the vessels of the different
classes. The crucial features of the organization involves having safety, quality and
environmental management system that is helping the firm to perform well in the sector.
The one of the significant objective of the particular organization is to offer best and
innovative h international container transport & logistics service provider. The current financial
metric such as revenue, profitability, etc are indicating its good leading position in sector. There
are the various kinds of the resources which are used by the organization for gaining the ability
to coordinate with prevailing competition in sector. This involves using certified equipment,
operating homogenizes & oil purifiers, etc. These are the ways which helps in operating
successfully in the sector in turn achieving objective of gaining leading position in sector can
become possible.
There are few issues which are faced by the organization that has hampered its growth &
development and affected its ability to accomplish the objective. This includes ineffective
management of the container, inability to manage all dept, procurement & daily monitoring etc
that is leading to affect its capacity to function in the industry. These have impact on the ability t
attain the objectives of the organization. The current study will pay attention on assessing
performance in both financial and non financial terms. It will give emphasis on comparing its
performance with its key competitors such as Cosco Shipping Line (CSL) for understanding the
challenges faced by the company. This will pay attention on recommending that buying shares of
OOCL is beneficial or not.
⊘ This is a preview!⊘
Do you want full access?
Subscribe today to unlock all pages.
Trusted by 1+ million students worldwide
MAIN BODY
Evaluating the performance of OOCL over the last two years in financial and non-financial
Terms
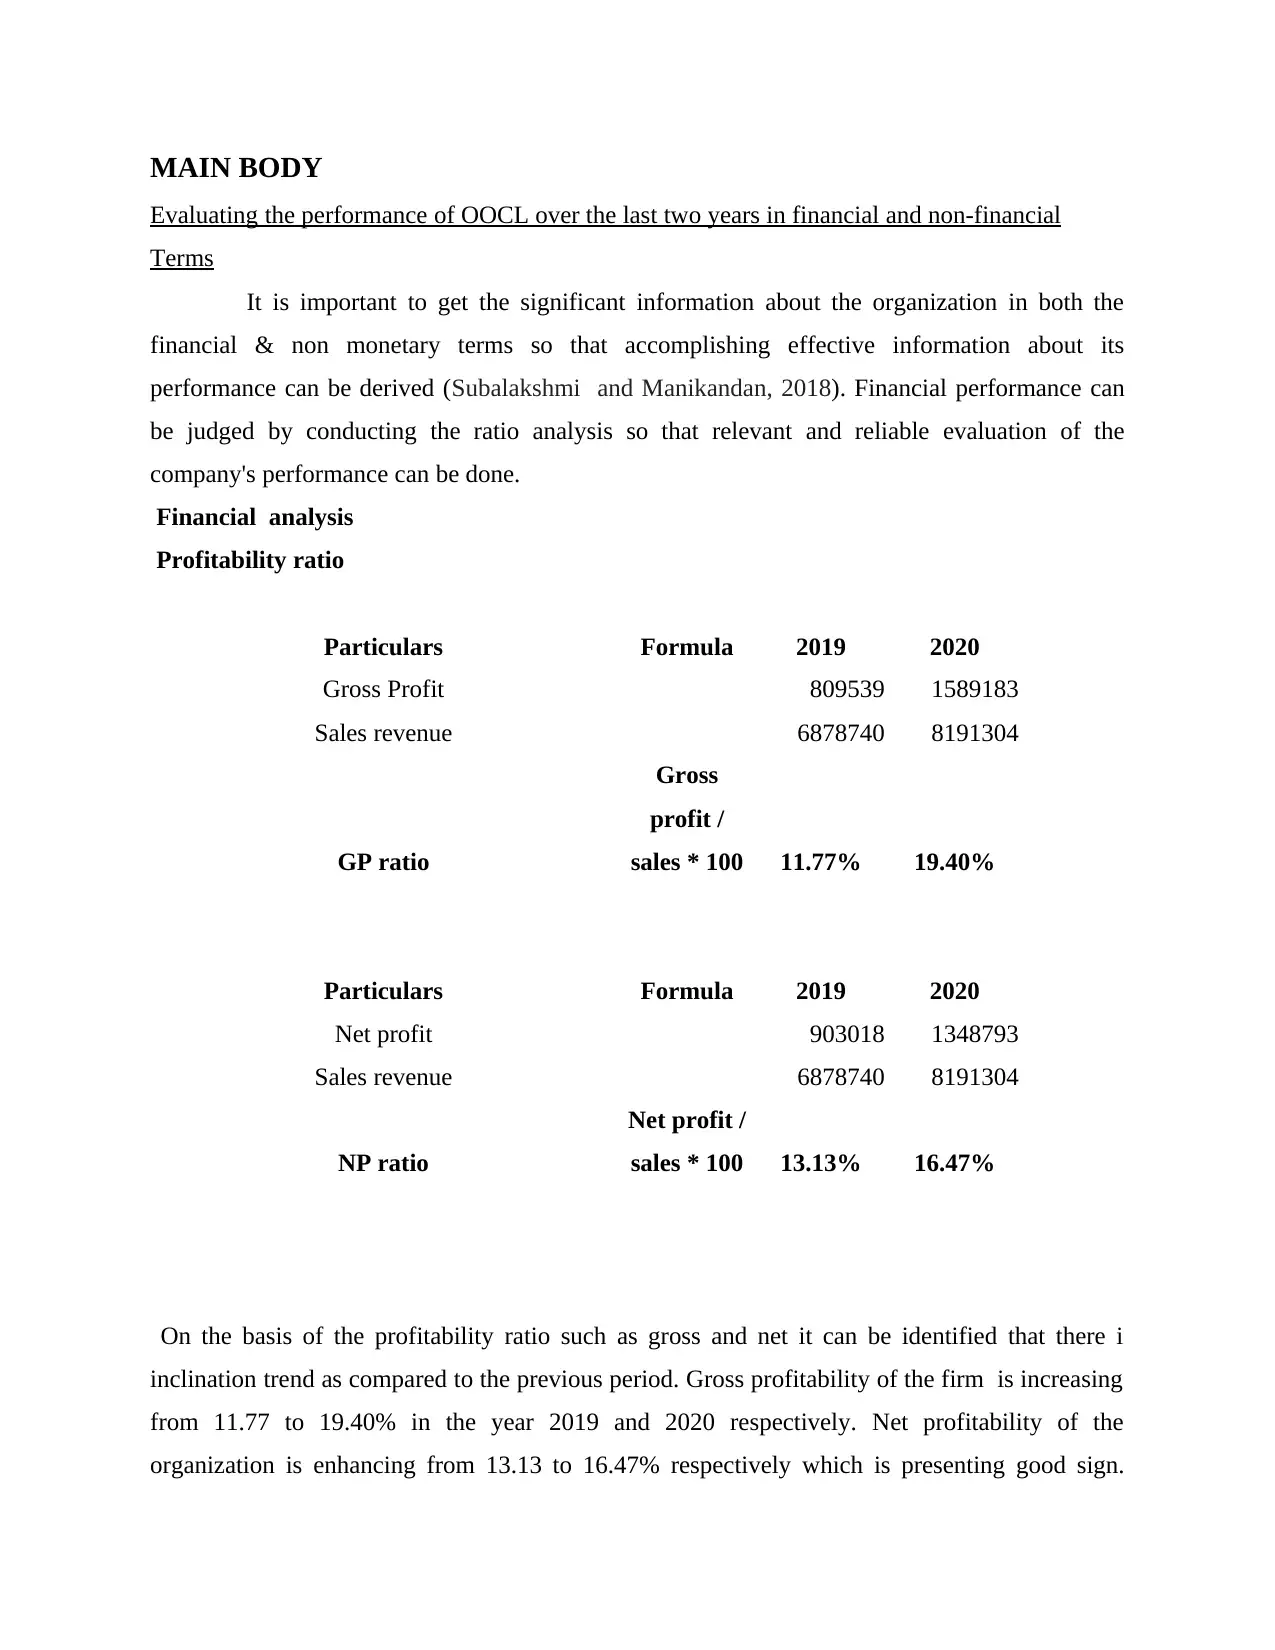
It is important to get the significant information about the organization in both the
financial & non monetary terms so that accomplishing effective information about its
performance can be derived (Subalakshmi and Manikandan, 2018). Financial performance can
be judged by conducting the ratio analysis so that relevant and reliable evaluation of the
company's performance can be done.
Financial analysis
Profitability ratio
Particulars Formula 2019 2020
Gross Profit 809539 1589183
Sales revenue 6878740 8191304
GP ratio
Gross
profit /
sales * 100 11.77% 19.40%
Particulars Formula 2019 2020
Net profit 903018 1348793
Sales revenue 6878740 8191304
NP ratio
Net profit /
sales * 100 13.13% 16.47%
On the basis of the profitability ratio such as gross and net it can be identified that there i
inclination trend as compared to the previous period. Gross profitability of the firm is increasing
from 11.77 to 19.40% in the year 2019 and 2020 respectively. Net profitability of the
organization is enhancing from 13.13 to 16.47% respectively which is presenting good sign.
Evaluating the performance of OOCL over the last two years in financial and non-financial
Terms
It is important to get the significant information about the organization in both the
financial & non monetary terms so that accomplishing effective information about its
performance can be derived (Subalakshmi and Manikandan, 2018). Financial performance can
be judged by conducting the ratio analysis so that relevant and reliable evaluation of the
company's performance can be done.
Financial analysis
Profitability ratio
Particulars Formula 2019 2020
Gross Profit 809539 1589183
Sales revenue 6878740 8191304
GP ratio
Gross
profit /
sales * 100 11.77% 19.40%
Particulars Formula 2019 2020
Net profit 903018 1348793
Sales revenue 6878740 8191304
NP ratio
Net profit /
sales * 100 13.13% 16.47%
On the basis of the profitability ratio such as gross and net it can be identified that there i
inclination trend as compared to the previous period. Gross profitability of the firm is increasing
from 11.77 to 19.40% in the year 2019 and 2020 respectively. Net profitability of the
organization is enhancing from 13.13 to 16.47% respectively which is presenting good sign.
Paraphrase This Document
Need a fresh take? Get an instant paraphrase of this document with our AI Paraphraser
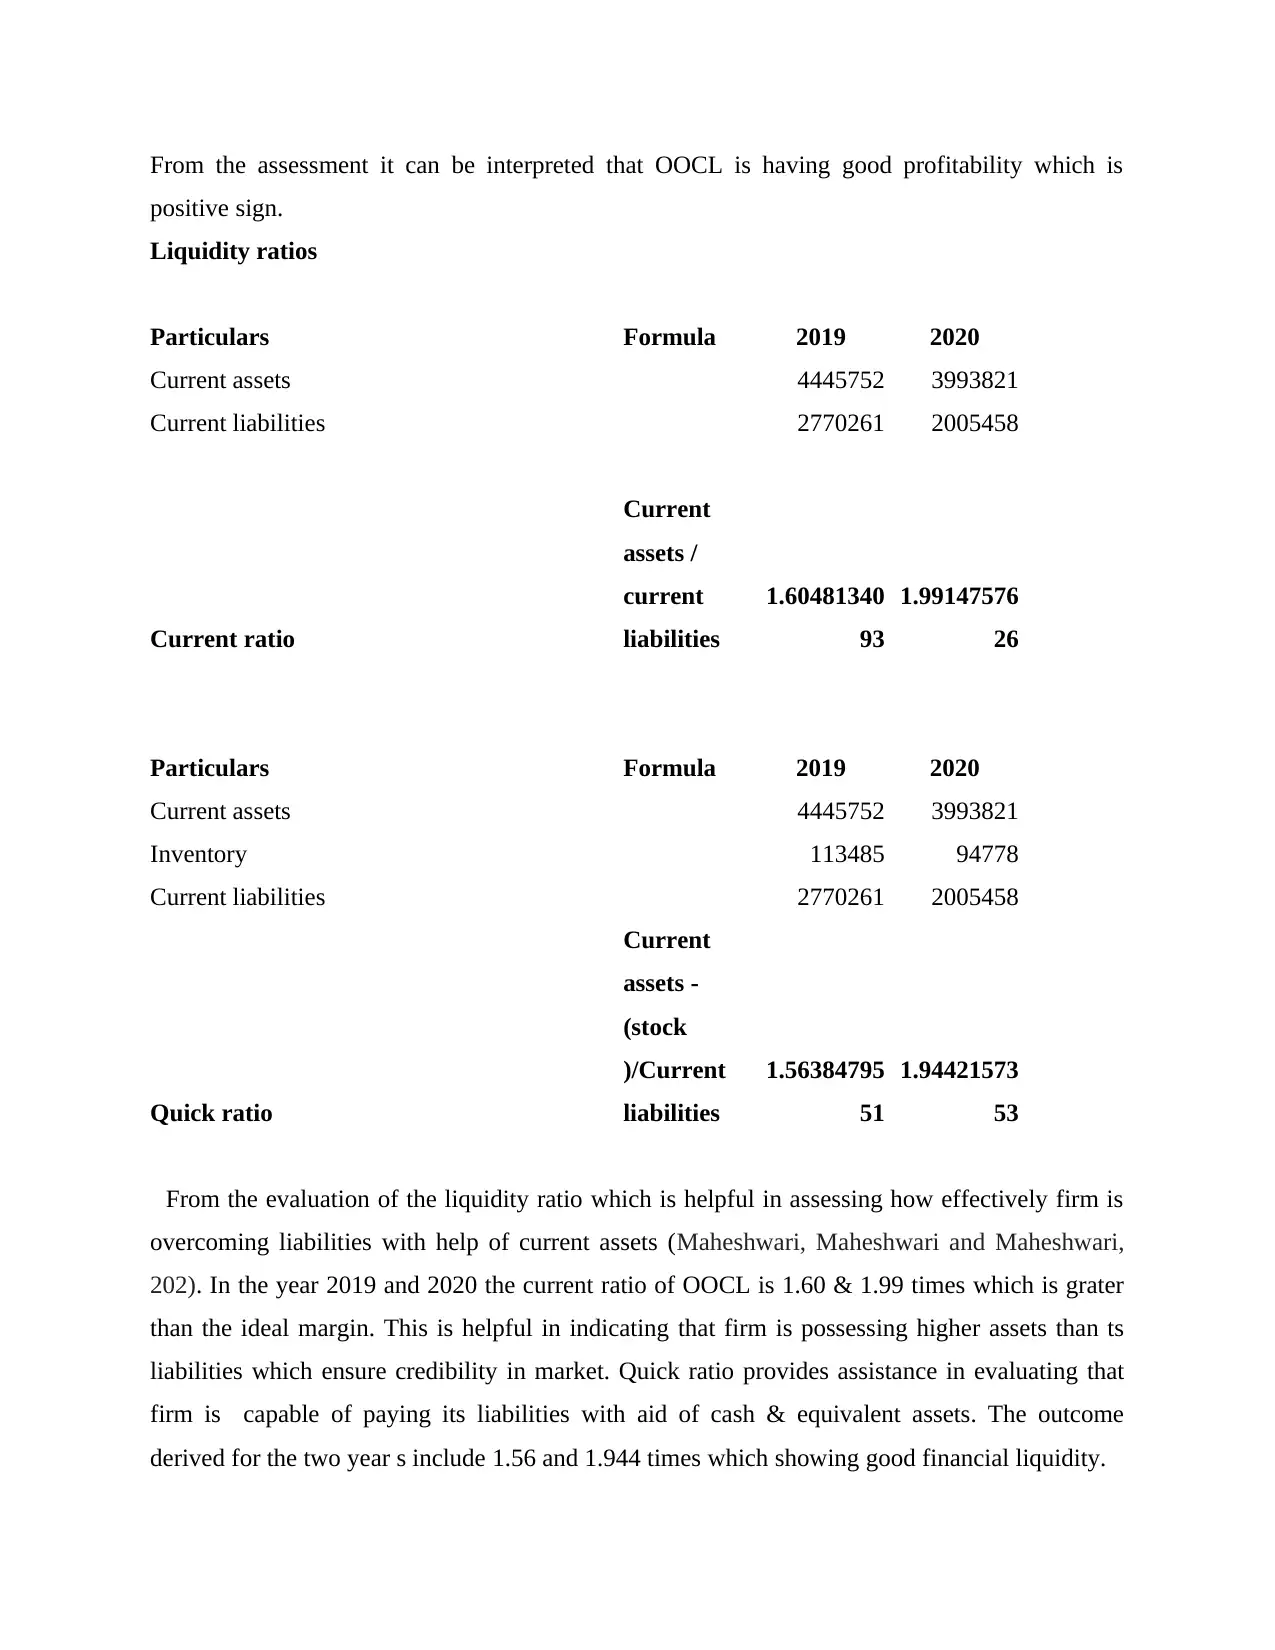
From the assessment it can be interpreted that OOCL is having good profitability which is
positive sign.
Liquidity ratios
Particulars Formula 2019 2020
Current assets 4445752 3993821
Current liabilities 2770261 2005458
Current ratio
Current
assets /
current
liabilities
1.60481340
93
1.99147576
26
Particulars Formula 2019 2020
Current assets 4445752 3993821
Inventory 113485 94778
Current liabilities 2770261 2005458
Quick ratio
Current
assets -
(stock
)/Current
liabilities
1.56384795
51
1.94421573
53
From the evaluation of the liquidity ratio which is helpful in assessing how effectively firm is
overcoming liabilities with help of current assets (Maheshwari, Maheshwari and Maheshwari,
202). In the year 2019 and 2020 the current ratio of OOCL is 1.60 & 1.99 times which is grater
than the ideal margin. This is helpful in indicating that firm is possessing higher assets than ts
liabilities which ensure credibility in market. Quick ratio provides assistance in evaluating that
firm is capable of paying its liabilities with aid of cash & equivalent assets. The outcome
derived for the two year s include 1.56 and 1.944 times which showing good financial liquidity.
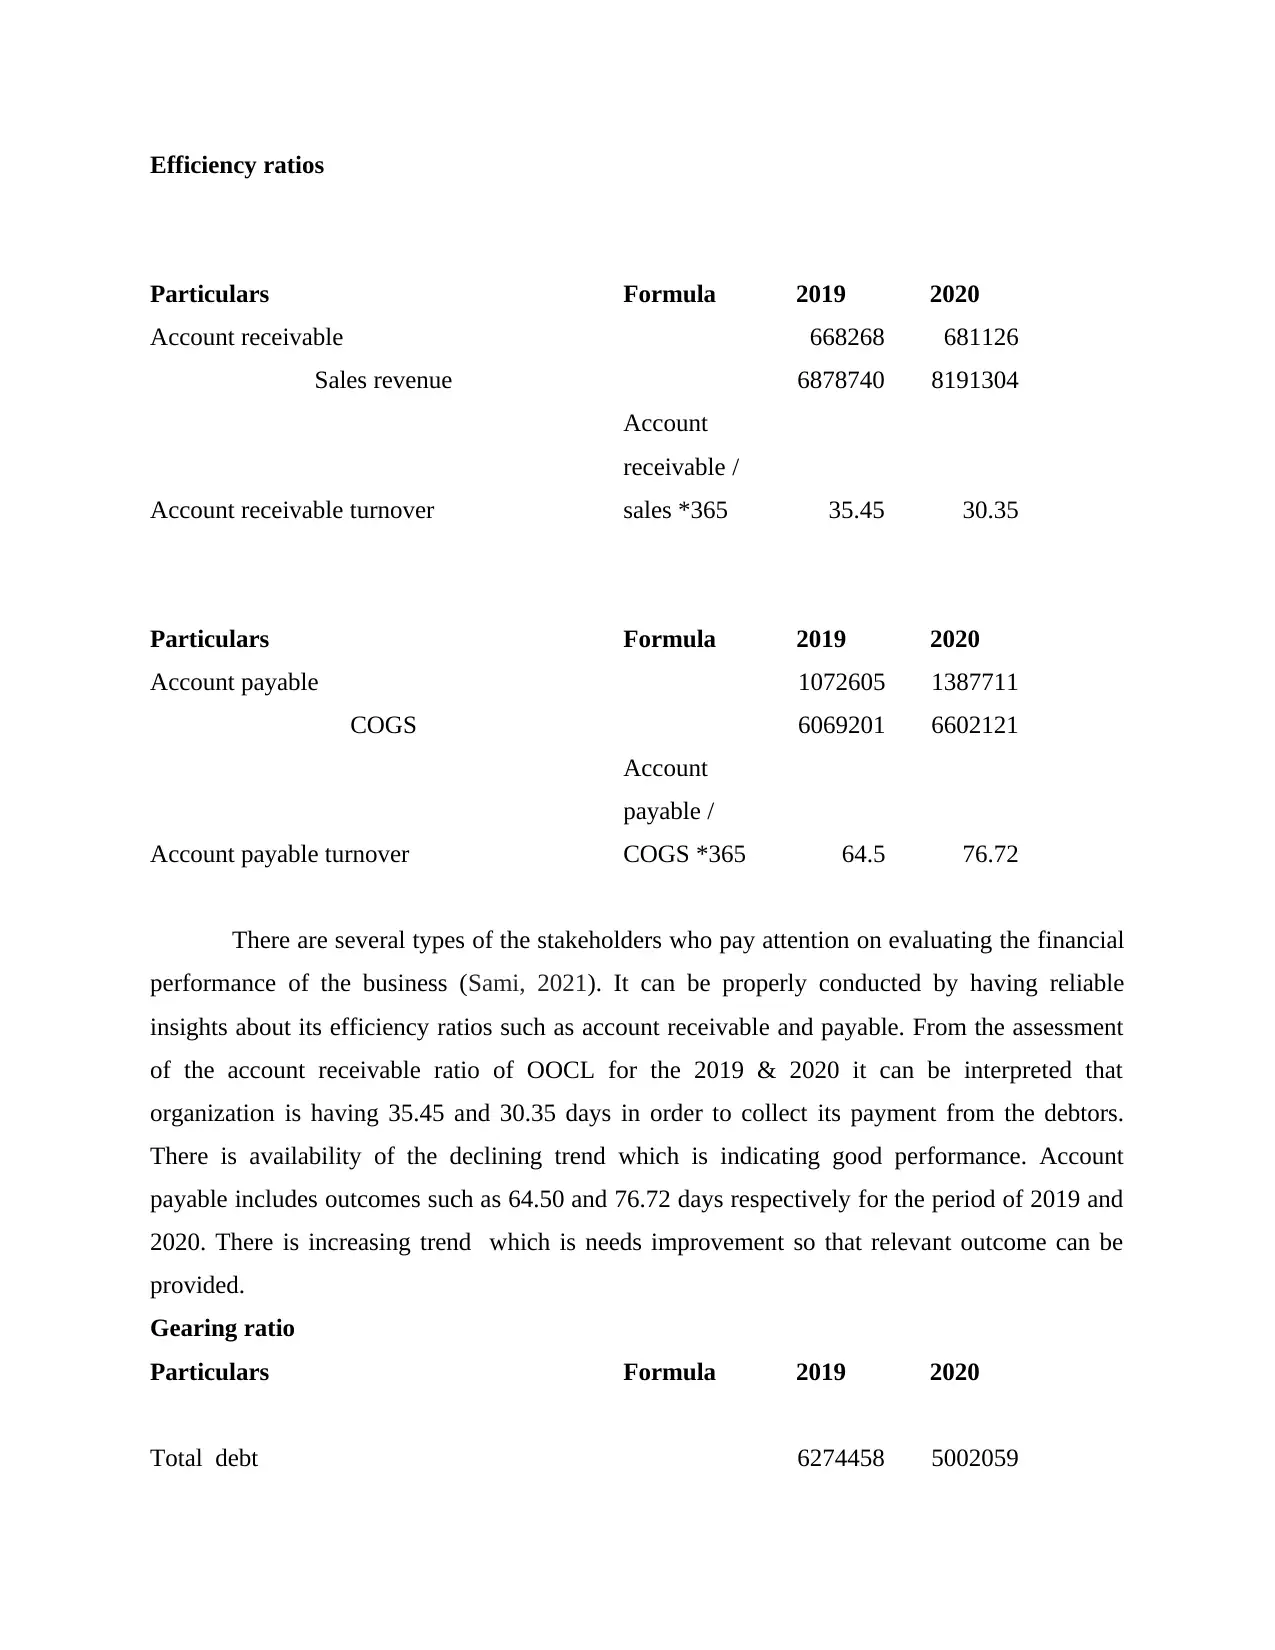
Efficiency ratios
Particulars Formula 2019 2020
Account receivable 668268 681126
Sales revenue 6878740 8191304
Account receivable turnover
Account
receivable /
sales *365 35.45 30.35
Particulars Formula 2019 2020
Account payable 1072605 1387711
COGS 6069201 6602121
Account payable turnover
Account
payable /
COGS *365 64.5 76.72
There are several types of the stakeholders who pay attention on evaluating the financial
performance of the business (Sami, 2021). It can be properly conducted by having reliable
insights about its efficiency ratios such as account receivable and payable. From the assessment
of the account receivable ratio of OOCL for the 2019 & 2020 it can be interpreted that
organization is having 35.45 and 30.35 days in order to collect its payment from the debtors.
There is availability of the declining trend which is indicating good performance. Account
payable includes outcomes such as 64.50 and 76.72 days respectively for the period of 2019 and
2020. There is increasing trend which is needs improvement so that relevant outcome can be
provided.
Gearing ratio
Particulars Formula 2019 2020
Total debt 6274458 5002059
Particulars Formula 2019 2020
Account receivable 668268 681126
Sales revenue 6878740 8191304
Account receivable turnover
Account
receivable /
sales *365 35.45 30.35
Particulars Formula 2019 2020
Account payable 1072605 1387711
COGS 6069201 6602121
Account payable turnover
Account
payable /
COGS *365 64.5 76.72
There are several types of the stakeholders who pay attention on evaluating the financial
performance of the business (Sami, 2021). It can be properly conducted by having reliable
insights about its efficiency ratios such as account receivable and payable. From the assessment
of the account receivable ratio of OOCL for the 2019 & 2020 it can be interpreted that
organization is having 35.45 and 30.35 days in order to collect its payment from the debtors.
There is availability of the declining trend which is indicating good performance. Account
payable includes outcomes such as 64.50 and 76.72 days respectively for the period of 2019 and
2020. There is increasing trend which is needs improvement so that relevant outcome can be
provided.
Gearing ratio
Particulars Formula 2019 2020
Total debt 6274458 5002059
⊘ This is a preview!⊘
Do you want full access?
Subscribe today to unlock all pages.
Trusted by 1+ million students worldwide
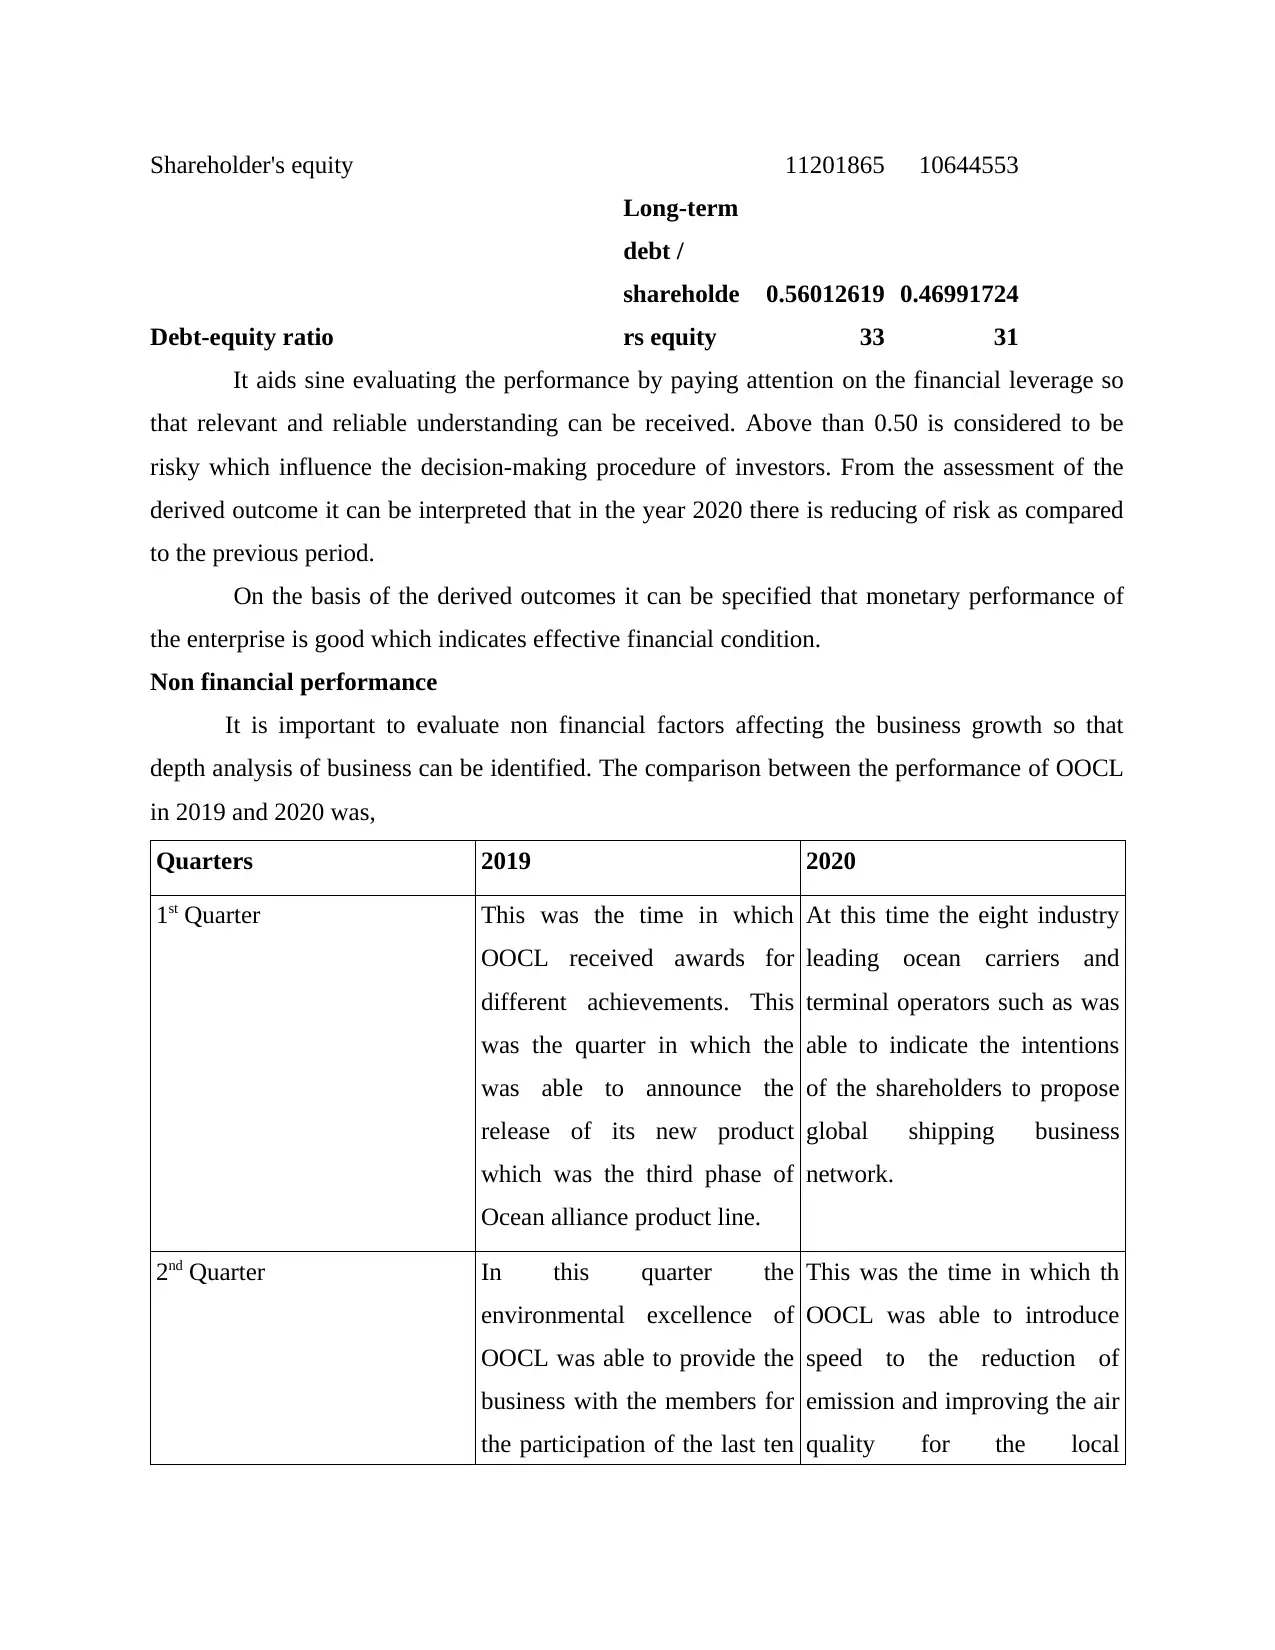
Shareholder's equity 11201865 10644553
Debt-equity ratio
Long-term
debt /
shareholde
rs equity
0.56012619
33
0.46991724
31
It aids sine evaluating the performance by paying attention on the financial leverage so
that relevant and reliable understanding can be received. Above than 0.50 is considered to be
risky which influence the decision-making procedure of investors. From the assessment of the
derived outcome it can be interpreted that in the year 2020 there is reducing of risk as compared
to the previous period.
On the basis of the derived outcomes it can be specified that monetary performance of
the enterprise is good which indicates effective financial condition.
Non financial performance
It is important to evaluate non financial factors affecting the business growth so that
depth analysis of business can be identified. The comparison between the performance of OOCL
in 2019 and 2020 was,
Quarters 2019 2020
1st Quarter This was the time in which
OOCL received awards for
different achievements. This
was the quarter in which the
was able to announce the
release of its new product
which was the third phase of
Ocean alliance product line.
At this time the eight industry
leading ocean carriers and
terminal operators such as was
able to indicate the intentions
of the shareholders to propose
global shipping business
network.
2nd Quarter In this quarter the
environmental excellence of
OOCL was able to provide the
business with the members for
the participation of the last ten
This was the time in which th
OOCL was able to introduce
speed to the reduction of
emission and improving the air
quality for the local
Paraphrase This Document
Need a fresh take? Get an instant paraphrase of this document with our AI Paraphraser
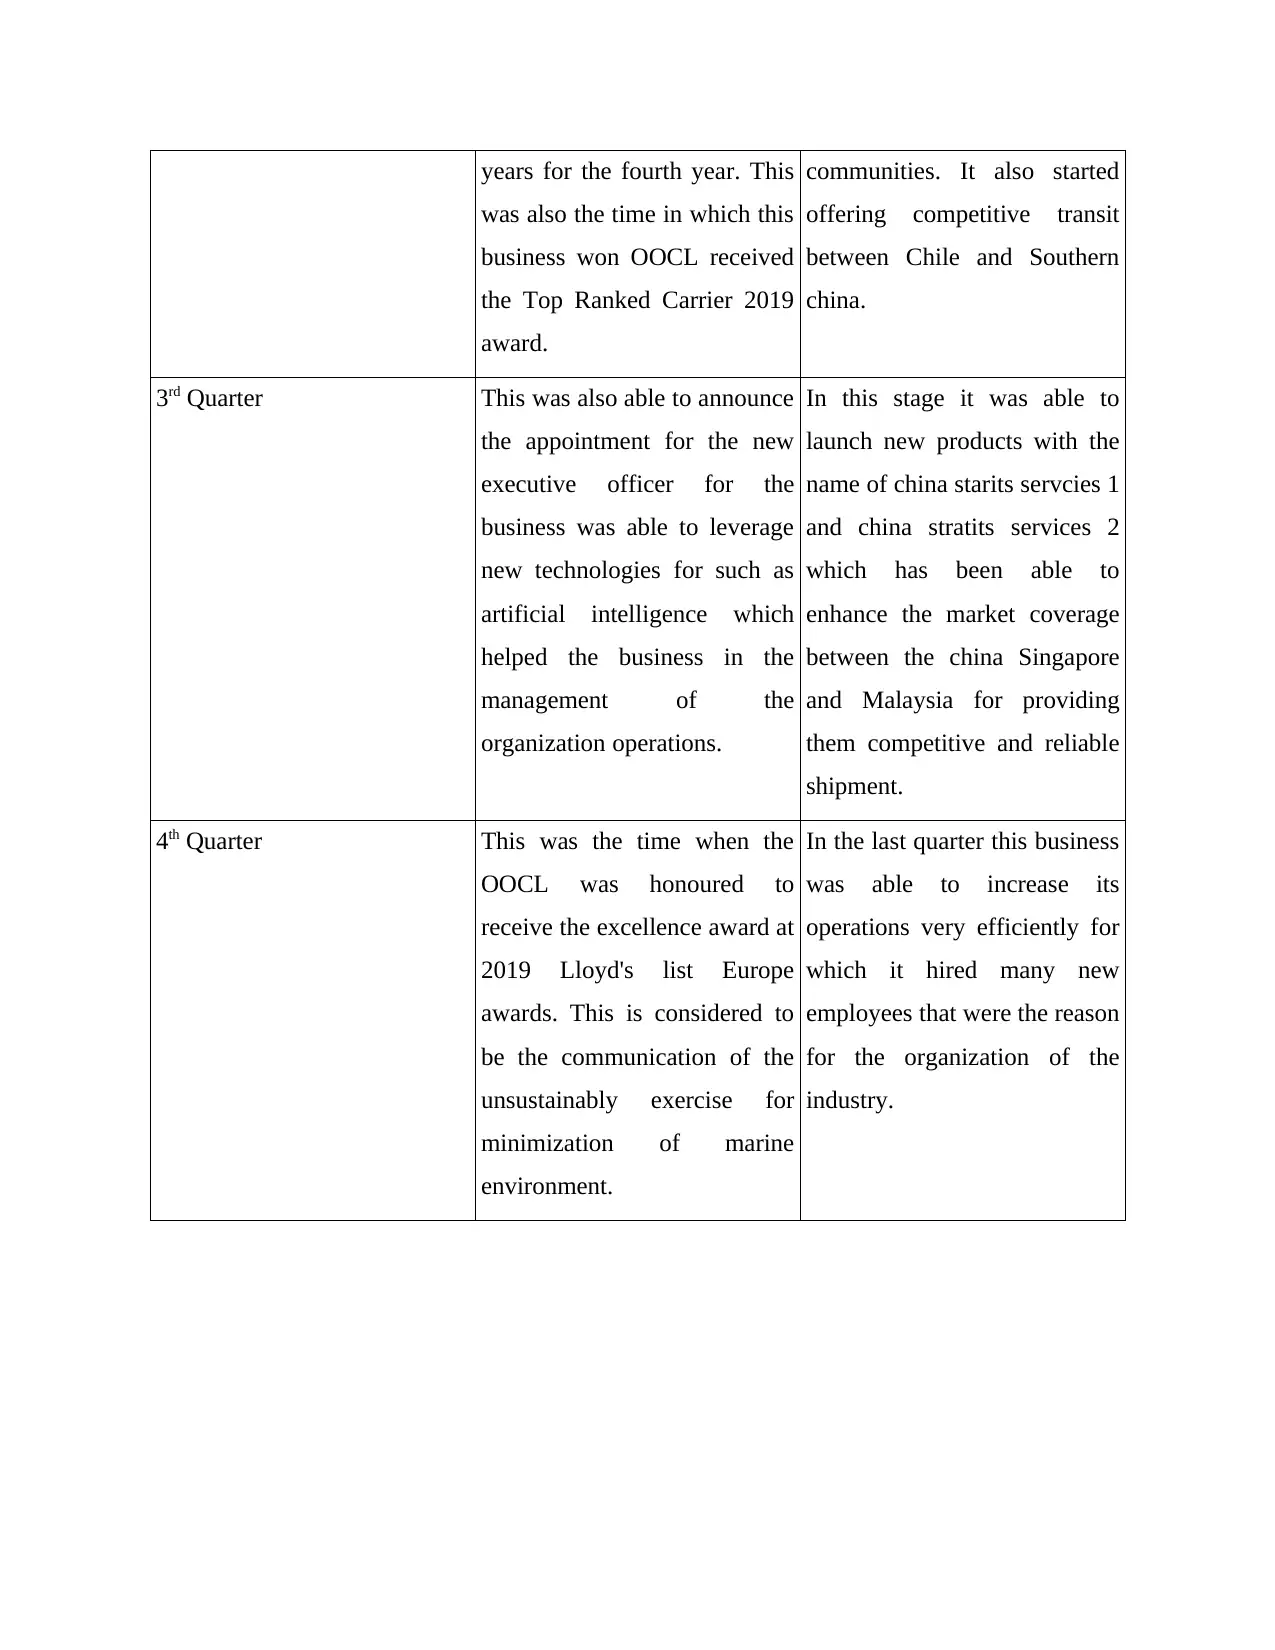
years for the fourth year. This
was also the time in which this
business won OOCL received
the Top Ranked Carrier 2019
award.
communities. It also started
offering competitive transit
between Chile and Southern
china.
3rd Quarter This was also able to announce
the appointment for the new
executive officer for the
business was able to leverage
new technologies for such as
artificial intelligence which
helped the business in the
management of the
organization operations.
In this stage it was able to
launch new products with the
name of china starits servcies 1
and china stratits services 2
which has been able to
enhance the market coverage
between the china Singapore
and Malaysia for providing
them competitive and reliable
shipment.
4th Quarter This was the time when the
OOCL was honoured to
receive the excellence award at
2019 Lloyd's list Europe
awards. This is considered to
be the communication of the
unsustainably exercise for
minimization of marine
environment.
In the last quarter this business
was able to increase its
operations very efficiently for
which it hired many new
employees that were the reason
for the organization of the
industry.
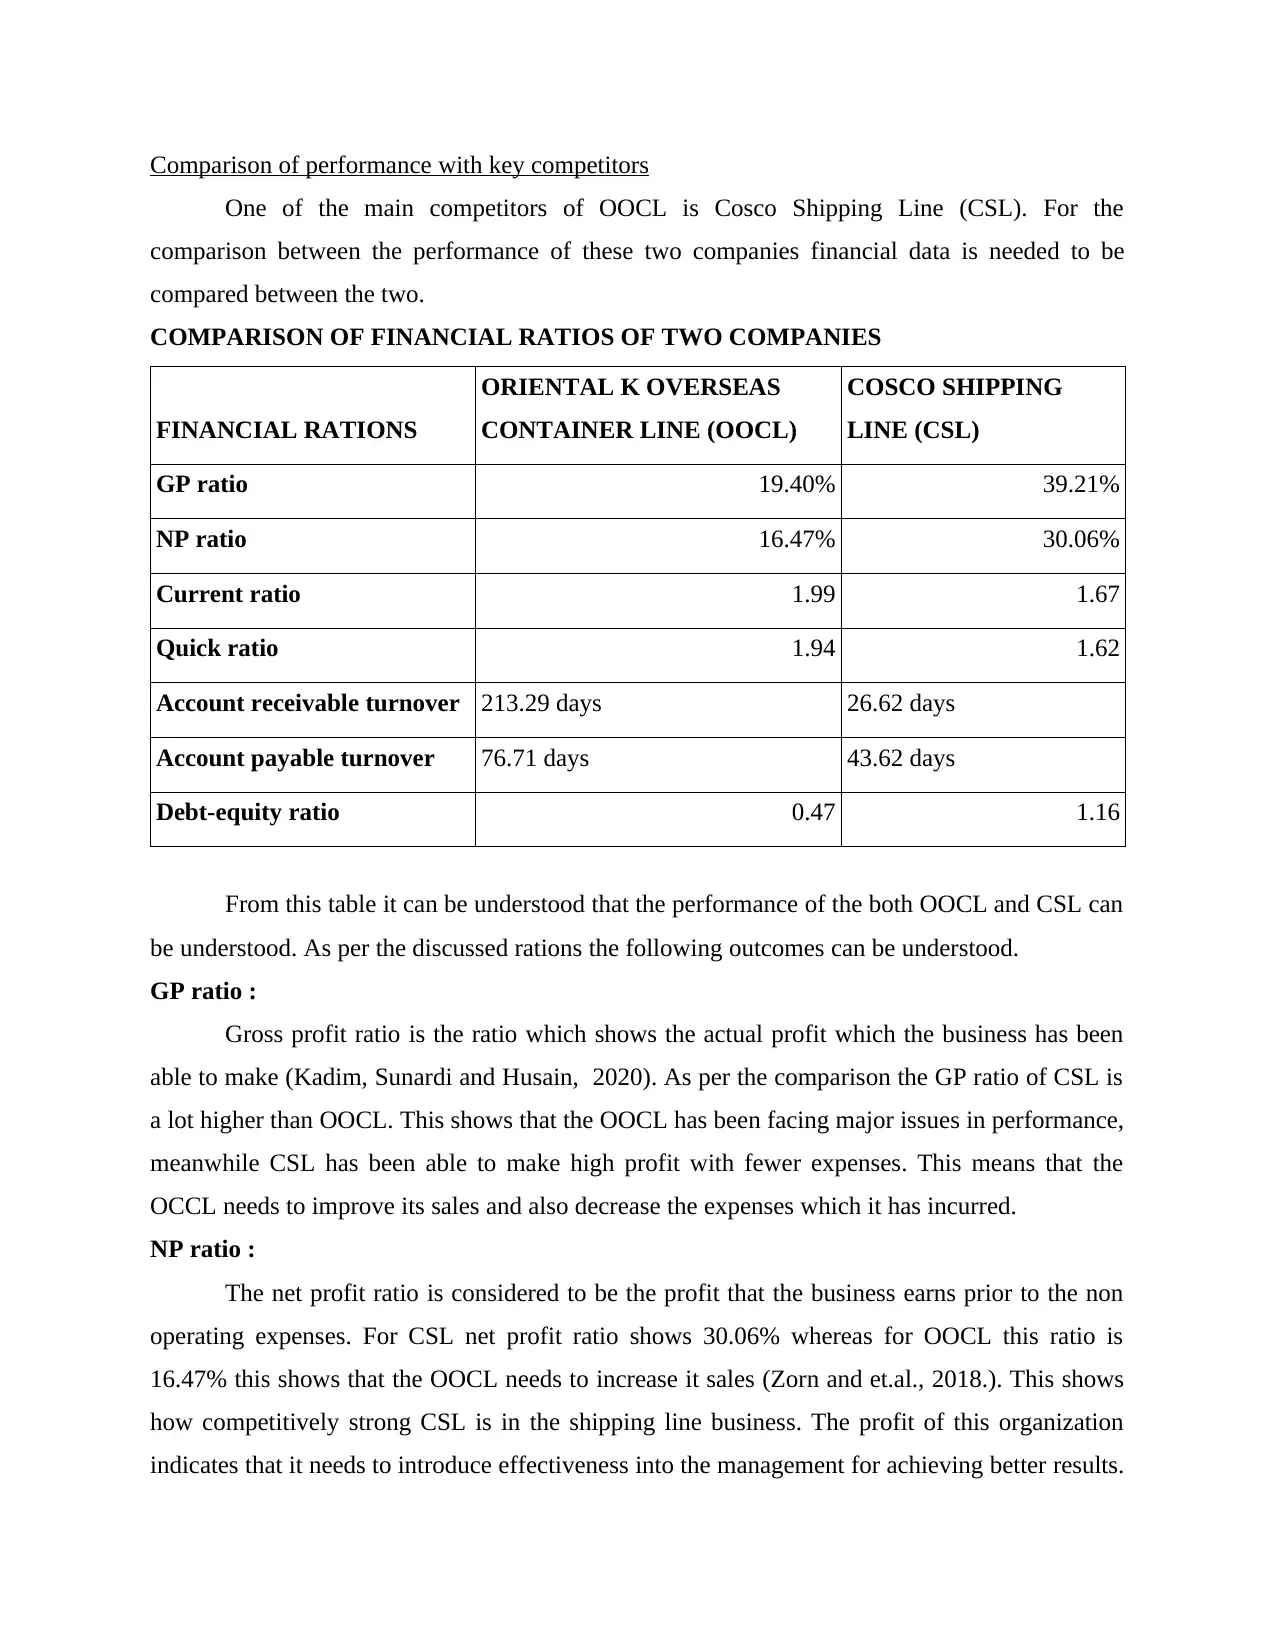
Comparison of performance with key competitors
One of the main competitors of OOCL is Cosco Shipping Line (CSL). For the
comparison between the performance of these two companies financial data is needed to be
compared between the two.
COMPARISON OF FINANCIAL RATIOS OF TWO COMPANIES
FINANCIAL RATIONS
ORIENTAL K OVERSEAS
CONTAINER LINE (OOCL)
COSCO SHIPPING
LINE (CSL)
GP ratio 19.40% 39.21%
NP ratio 16.47% 30.06%
Current ratio 1.99 1.67
Quick ratio 1.94 1.62
Account receivable turnover 213.29 days 26.62 days
Account payable turnover 76.71 days 43.62 days
Debt-equity ratio 0.47 1.16
From this table it can be understood that the performance of the both OOCL and CSL can
be understood. As per the discussed rations the following outcomes can be understood.
GP ratio :
Gross profit ratio is the ratio which shows the actual profit which the business has been
able to make (Kadim, Sunardi and Husain, 2020). As per the comparison the GP ratio of CSL is
a lot higher than OOCL. This shows that the OOCL has been facing major issues in performance,
meanwhile CSL has been able to make high profit with fewer expenses. This means that the
OCCL needs to improve its sales and also decrease the expenses which it has incurred.
NP ratio :
The net profit ratio is considered to be the profit that the business earns prior to the non
operating expenses. For CSL net profit ratio shows 30.06% whereas for OOCL this ratio is
16.47% this shows that the OOCL needs to increase it sales (Zorn and et.al., 2018.). This shows
how competitively strong CSL is in the shipping line business. The profit of this organization
indicates that it needs to introduce effectiveness into the management for achieving better results.
⊘ This is a preview!⊘
Do you want full access?
Subscribe today to unlock all pages.
Trusted by 1+ million students worldwide
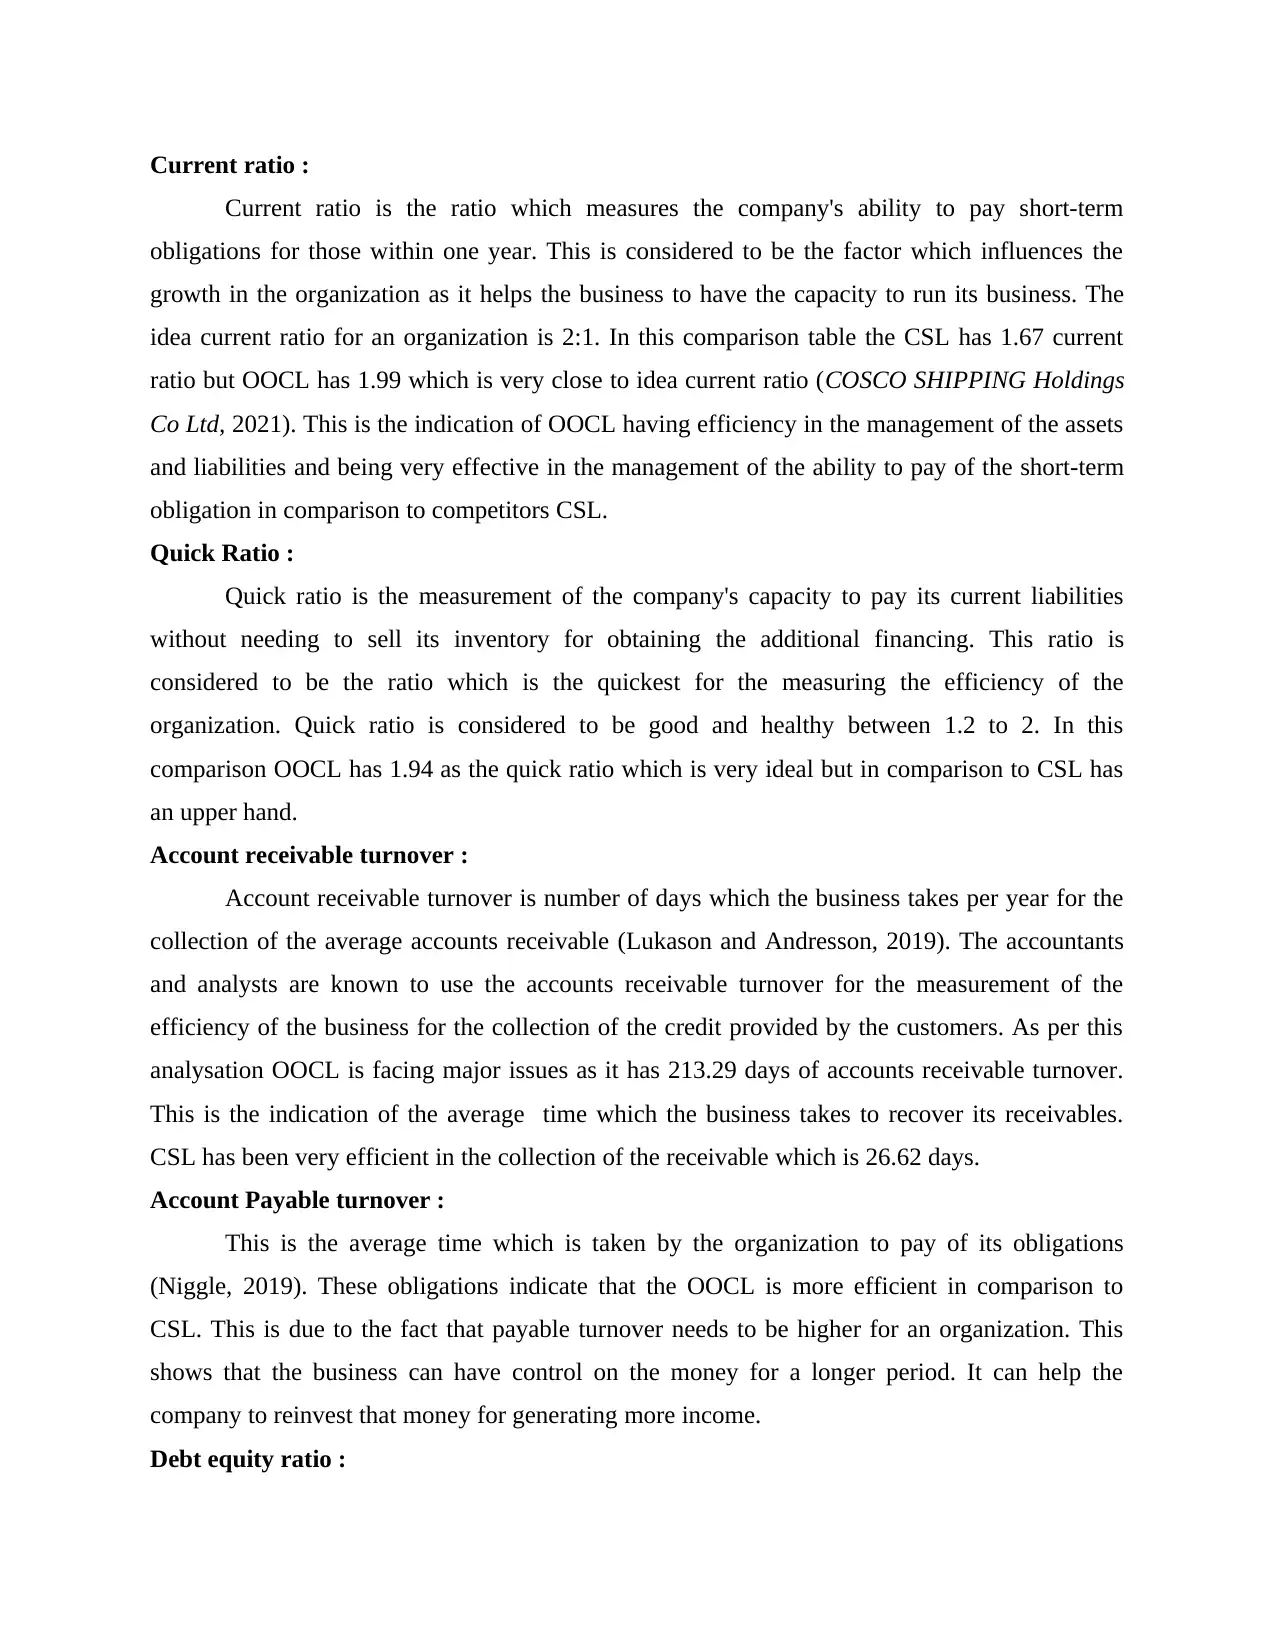
Current ratio :
Current ratio is the ratio which measures the company's ability to pay short-term
obligations for those within one year. This is considered to be the factor which influences the
growth in the organization as it helps the business to have the capacity to run its business. The
idea current ratio for an organization is 2:1. In this comparison table the CSL has 1.67 current
ratio but OOCL has 1.99 which is very close to idea current ratio (COSCO SHIPPING Holdings
Co Ltd, 2021). This is the indication of OOCL having efficiency in the management of the assets
and liabilities and being very effective in the management of the ability to pay of the short-term
obligation in comparison to competitors CSL.
Quick Ratio :
Quick ratio is the measurement of the company's capacity to pay its current liabilities
without needing to sell its inventory for obtaining the additional financing. This ratio is
considered to be the ratio which is the quickest for the measuring the efficiency of the
organization. Quick ratio is considered to be good and healthy between 1.2 to 2. In this
comparison OOCL has 1.94 as the quick ratio which is very ideal but in comparison to CSL has
an upper hand.
Account receivable turnover :
Account receivable turnover is number of days which the business takes per year for the
collection of the average accounts receivable (Lukason and Andresson, 2019). The accountants
and analysts are known to use the accounts receivable turnover for the measurement of the
efficiency of the business for the collection of the credit provided by the customers. As per this
analysation OOCL is facing major issues as it has 213.29 days of accounts receivable turnover.
This is the indication of the average time which the business takes to recover its receivables.
CSL has been very efficient in the collection of the receivable which is 26.62 days.
Account Payable turnover :
This is the average time which is taken by the organization to pay of its obligations
(Niggle, 2019). These obligations indicate that the OOCL is more efficient in comparison to
CSL. This is due to the fact that payable turnover needs to be higher for an organization. This
shows that the business can have control on the money for a longer period. It can help the
company to reinvest that money for generating more income.
Debt equity ratio :
Paraphrase This Document
Need a fresh take? Get an instant paraphrase of this document with our AI Paraphraser
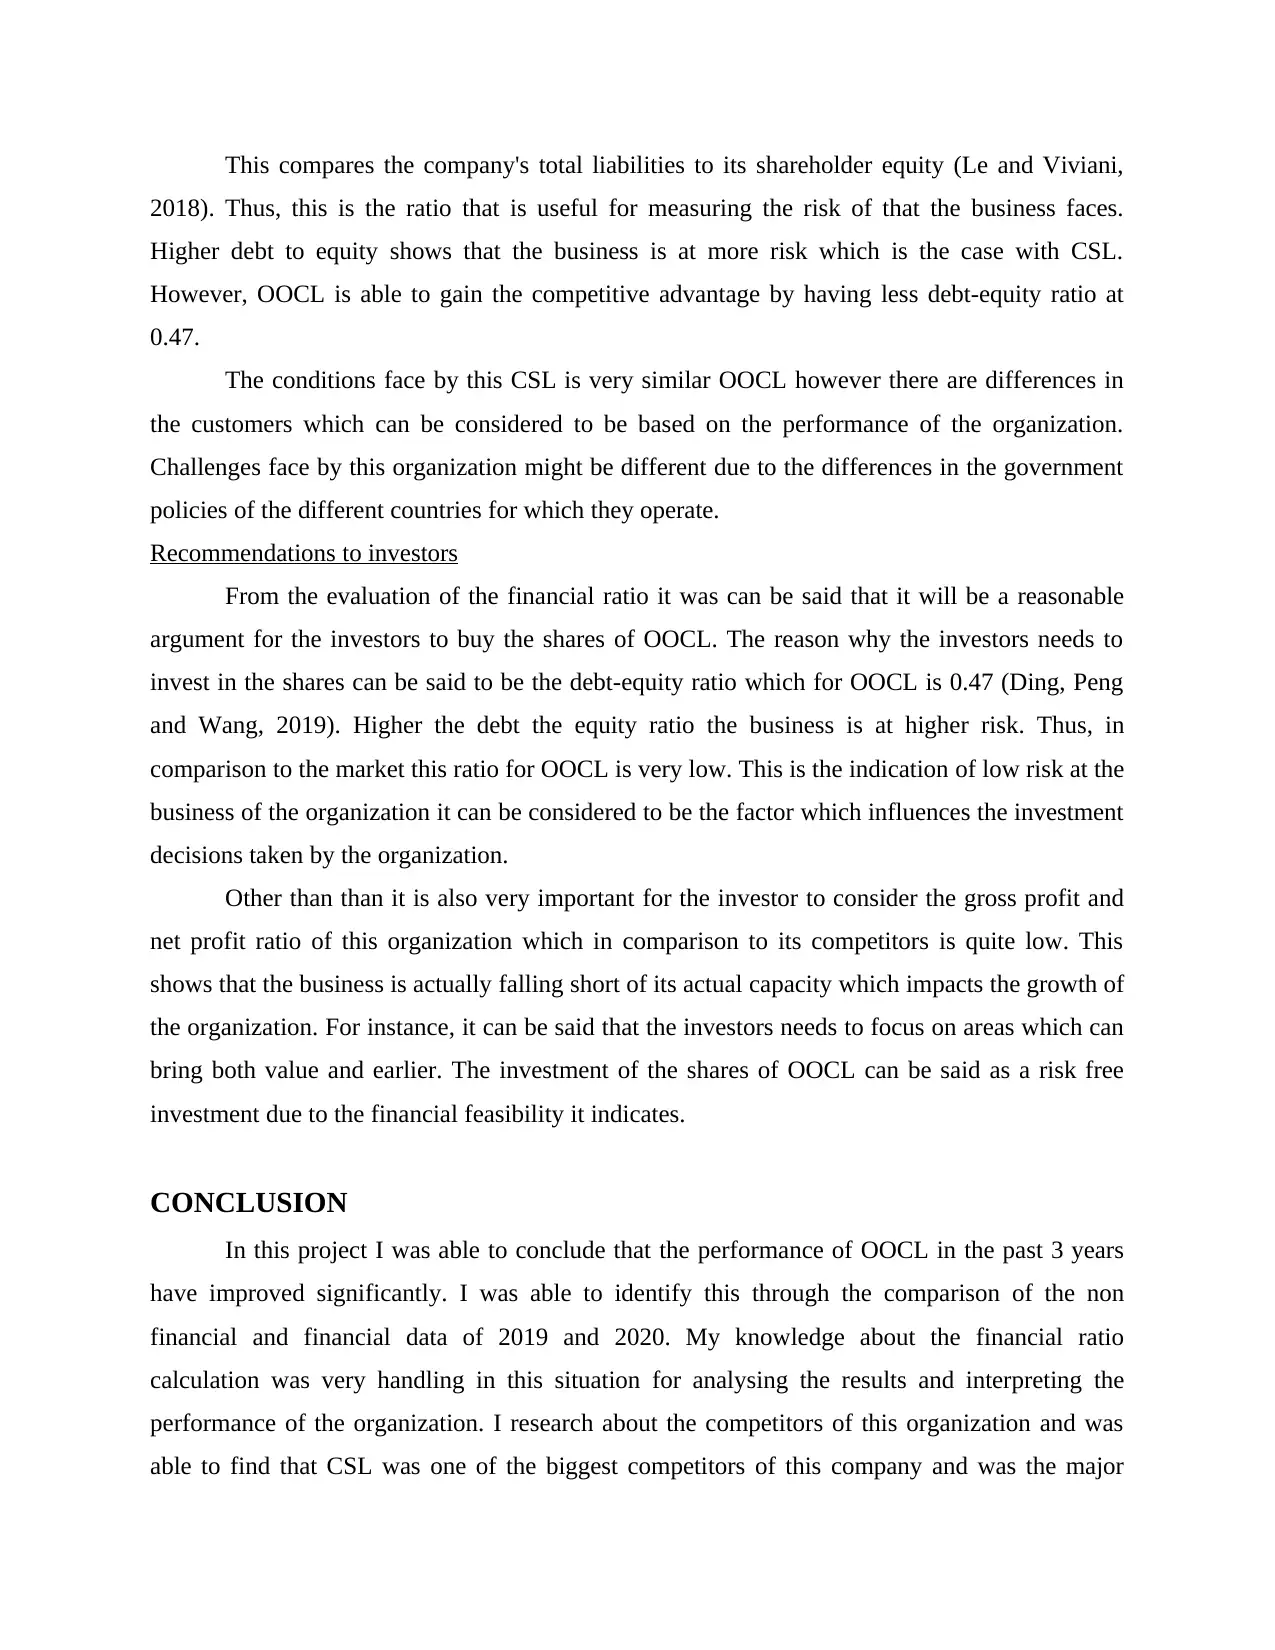
This compares the company's total liabilities to its shareholder equity (Le and Viviani,
2018). Thus, this is the ratio that is useful for measuring the risk of that the business faces.
Higher debt to equity shows that the business is at more risk which is the case with CSL.
However, OOCL is able to gain the competitive advantage by having less debt-equity ratio at
0.47.
The conditions face by this CSL is very similar OOCL however there are differences in
the customers which can be considered to be based on the performance of the organization.
Challenges face by this organization might be different due to the differences in the government
policies of the different countries for which they operate.
Recommendations to investors
From the evaluation of the financial ratio it was can be said that it will be a reasonable
argument for the investors to buy the shares of OOCL. The reason why the investors needs to
invest in the shares can be said to be the debt-equity ratio which for OOCL is 0.47 (Ding, Peng
and Wang, 2019). Higher the debt the equity ratio the business is at higher risk. Thus, in
comparison to the market this ratio for OOCL is very low. This is the indication of low risk at the
business of the organization it can be considered to be the factor which influences the investment
decisions taken by the organization.
Other than than it is also very important for the investor to consider the gross profit and
net profit ratio of this organization which in comparison to its competitors is quite low. This
shows that the business is actually falling short of its actual capacity which impacts the growth of
the organization. For instance, it can be said that the investors needs to focus on areas which can
bring both value and earlier. The investment of the shares of OOCL can be said as a risk free
investment due to the financial feasibility it indicates.
CONCLUSION
In this project I was able to conclude that the performance of OOCL in the past 3 years
have improved significantly. I was able to identify this through the comparison of the non
financial and financial data of 2019 and 2020. My knowledge about the financial ratio
calculation was very handling in this situation for analysing the results and interpreting the
performance of the organization. I research about the competitors of this organization and was
able to find that CSL was one of the biggest competitors of this company and was the major
competitive threat to this organization. I was able to gather the information regarding the
financial viability of CSL and this allowed me to compare both the companies and find out the
areas in which OOCL had competitive advantage. In this project I focused on studying the
performance of OOCL and identify whether investors should invest in there shares or not.
financial viability of CSL and this allowed me to compare both the companies and find out the
areas in which OOCL had competitive advantage. In this project I focused on studying the
performance of OOCL and identify whether investors should invest in there shares or not.
⊘ This is a preview!⊘
Do you want full access?
Subscribe today to unlock all pages.
Trusted by 1+ million students worldwide
1 out of 13
Related Documents


Your All-in-One AI-Powered Toolkit for Academic Success.
+13062052269
info@desklib.com
Available 24*7 on WhatsApp / Email
![[object Object]](/_next/static/media/star-bottom.7253800d.svg)
Unlock your academic potential
Copyright © 2020–2026 A2Z Services. All Rights Reserved. Developed and managed by ZUCOL.