Financial Performance Analysis of Pfizer Inc. for Finance Managers
VerifiedAdded on 2023/01/09
|23
|6537
|49
Report
AI Summary
This report presents a comprehensive financial analysis of Pfizer Inc., targeting finance managers. It begins with an introduction to finance and its importance in managerial decision-making, followed by an evaluation of Pfizer's financial information using ratio analysis, including profitability, efficiency, liquidity, stability, and investor ratios. The analysis extends to examining financial documents like income statements, balance sheets, and cash flow statements to assess financial performance and meet stakeholder needs. Comparative analysis of Pfizer's financial data over three years, along with a comparison with GlaxoSmithKline, is conducted to identify trends and patterns. The report also delves into budget production, considering financial constraints and organizational objectives, as well as the assessment of a budget's effectiveness. Furthermore, the report evaluates expenditure proposals by identifying judgment criteria, analyzing viability, and providing feedback on financial proposals. The conclusion summarizes the key findings and insights from the analysis, offering a holistic view of Pfizer's financial health and strategies.

Finance for Managers
Paraphrase This Document
Need a fresh take? Get an instant paraphrase of this document with our AI Paraphraser
INTRODUCTION...........................................................................................................................1
MAIN BODY...................................................................................................................................1
TASK 1............................................................................................................................................1
1. Determined the financial information that needed and assess its validity ..............................1
2. Analyse different financial document and information which helps in formulating
conclusion about financial performance and need of stakeholders ..........................................4
3. Conduct comparative analysis of financial information and data ...........................................5
4. Critically review and question financial data and information..............................................10
TASK 2..........................................................................................................................................11
1. Identify how budget can be produced taking into account financial constraints and
achievement of targets and accounting conventions..................................................................11
2. Be able to assess a budget......................................................................................................12
2. Identify how a budget for a complex organization can support organizational objectives and
targets.........................................................................................................................................13
TASK 3..........................................................................................................................................14
1. Identify criteria by which proposals can be judged ..............................................................14
2. Critically analyse the viability of a proposal for expenditure ...............................................16
3. Identify the strengths and weaknesses of a proposal and give feedback on the financial
proposal .....................................................................................................................................17
4. Analyse the viability of a proposal for expenditure...............................................................17
CONCLUSION..............................................................................................................................18
REFERENCES .............................................................................................................................19
INTRODUCTION
Finance is the management matters about the administration, development, and analysis of
money and assets (Begkos, Llewellyn and Walshe, 2020). Basically, it addresses the issues of
how and why an person, corporation or state receives the funding necessary which is called
capital in the business sense as well as how it spend or start investing to maximise company's
earnings. Mangers of the company required each and every detail of company’s finances to make
effective decisions which helps in improving its operational efficiency as well as effectiveness.
Pfizer Inc Company is selected for better underrating and it is American based Pharmaceutical
Corporation and it does headquarter situated in New York. This assessment covers the several
topics such as evaluate financial information by using financial documents, evaluation method
and how budget prepared by using several financial constraints.
MAIN BODY
TASK 1
1. Determined the financial information that needed and assess its validity
Financial information of a company determined with the help of ratio analysis which help
the managers to evaluate data which allow them to make strategic decisions (Brealey and et.al.,
2018). By using financial information of Pfizer Inc, manager calculates the following ratios
which are as follow:
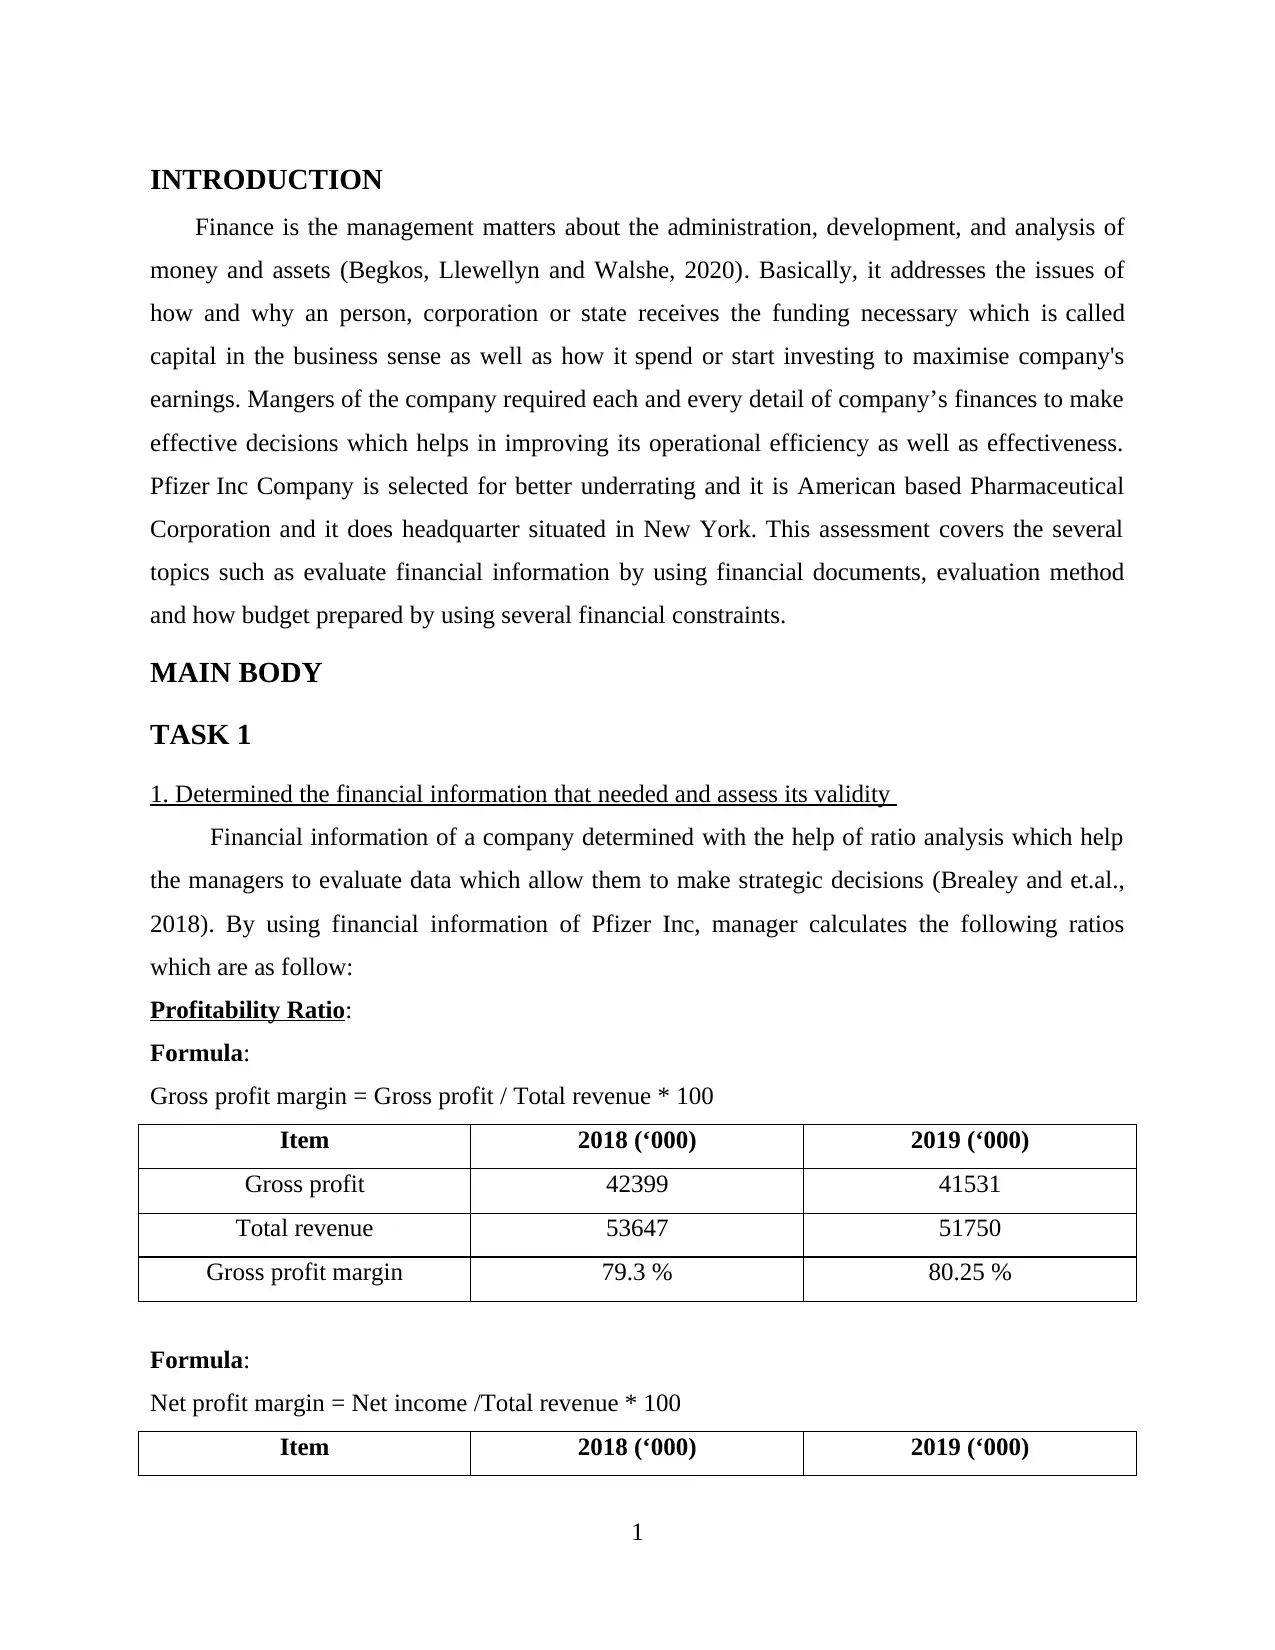
Profitability Ratio:
Formula:
Gross profit margin = Gross profit / Total revenue * 100
Item 2018 (‘000) 2019 (‘000)
Gross profit 42399 41531
Total revenue 53647 51750
Gross profit margin 79.3 % 80.25 %
Formula:
Net profit margin = Net income /Total revenue * 100
Item 2018 (‘000) 2019 (‘000)
1
Finance is the management matters about the administration, development, and analysis of
money and assets (Begkos, Llewellyn and Walshe, 2020). Basically, it addresses the issues of
how and why an person, corporation or state receives the funding necessary which is called
capital in the business sense as well as how it spend or start investing to maximise company's
earnings. Mangers of the company required each and every detail of company’s finances to make
effective decisions which helps in improving its operational efficiency as well as effectiveness.
Pfizer Inc Company is selected for better underrating and it is American based Pharmaceutical
Corporation and it does headquarter situated in New York. This assessment covers the several
topics such as evaluate financial information by using financial documents, evaluation method
and how budget prepared by using several financial constraints.
MAIN BODY
TASK 1
1. Determined the financial information that needed and assess its validity
Financial information of a company determined with the help of ratio analysis which help
the managers to evaluate data which allow them to make strategic decisions (Brealey and et.al.,
2018). By using financial information of Pfizer Inc, manager calculates the following ratios
which are as follow:
Profitability Ratio:
Formula:
Gross profit margin = Gross profit / Total revenue * 100
Item 2018 (‘000) 2019 (‘000)
Gross profit 42399 41531
Total revenue 53647 51750
Gross profit margin 79.3 % 80.25 %
Formula:
Net profit margin = Net income /Total revenue * 100
Item 2018 (‘000) 2019 (‘000)
1
⊘ This is a preview!⊘
Do you want full access?
Subscribe today to unlock all pages.
Trusted by 1+ million students worldwide
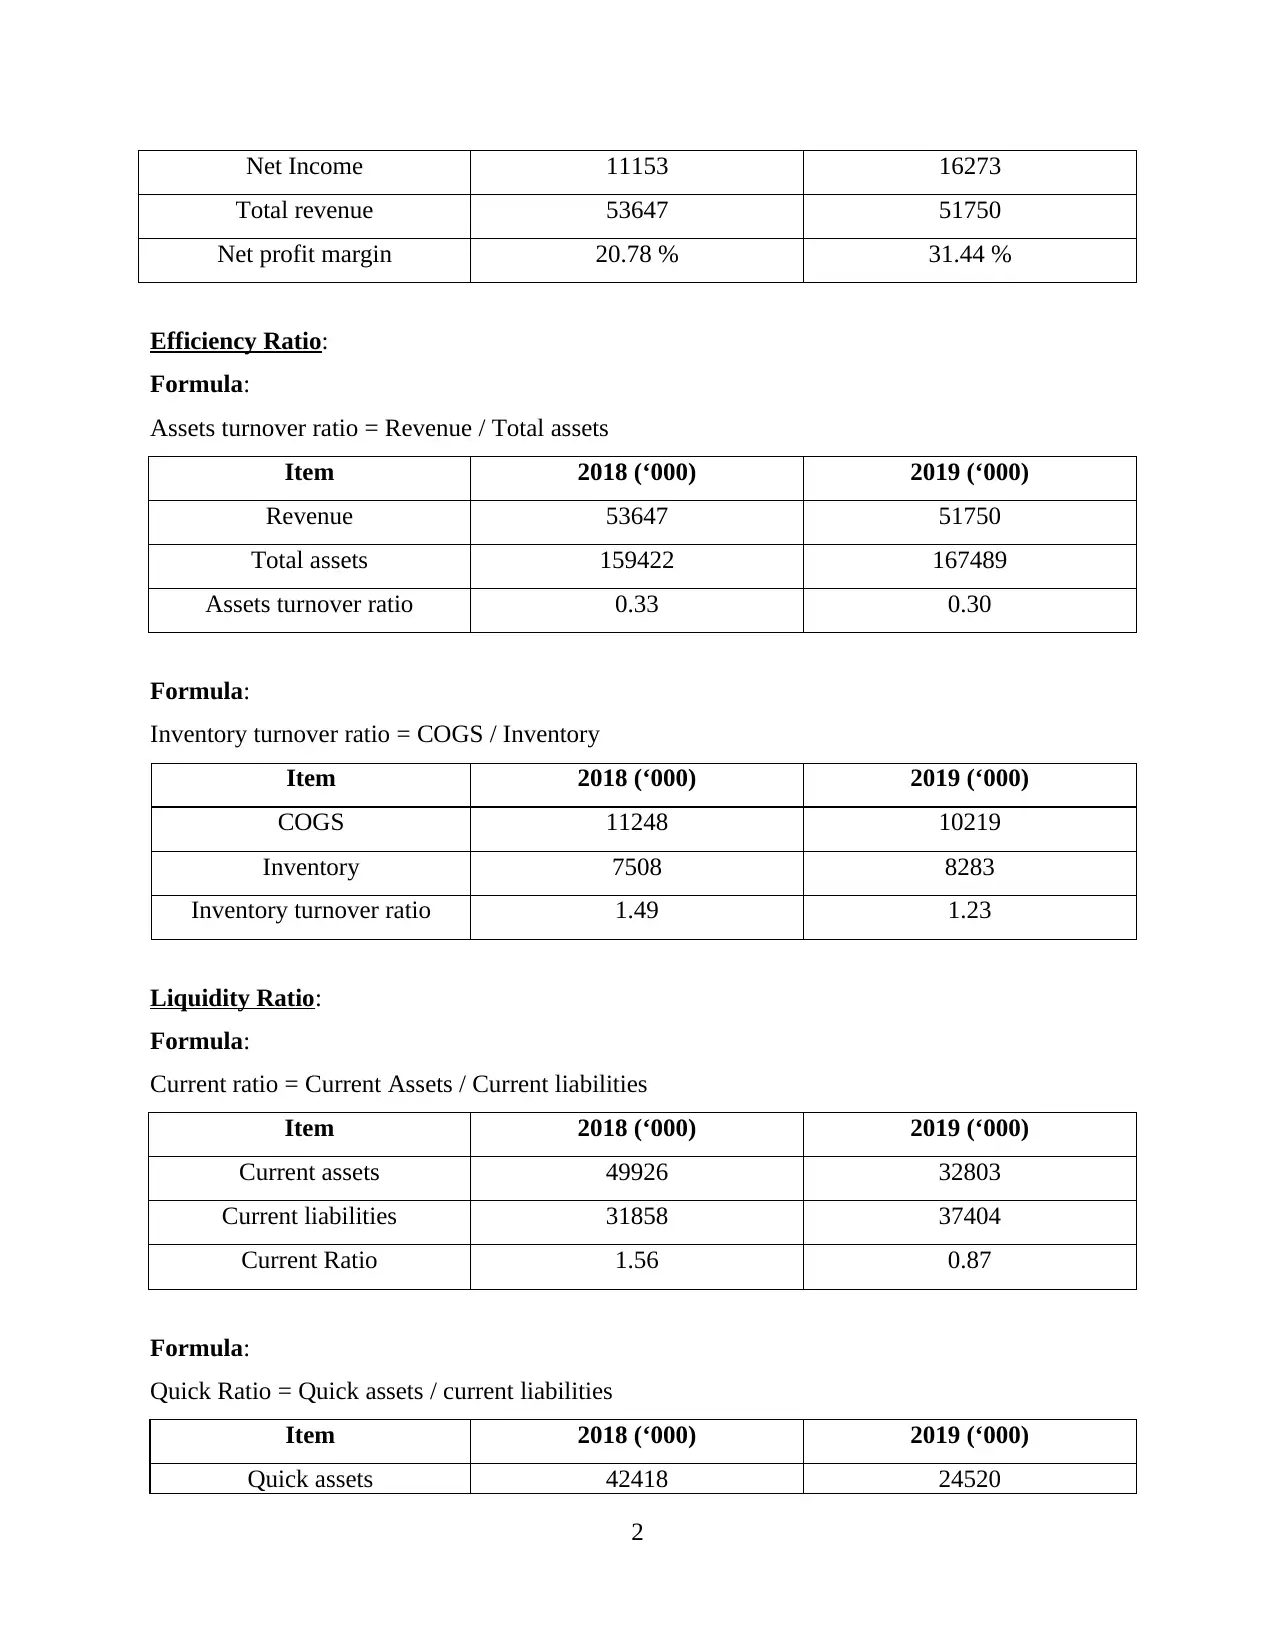
Net Income 11153 16273
Total revenue 53647 51750
Net profit margin 20.78 % 31.44 %
Efficiency Ratio:
Formula:
Assets turnover ratio = Revenue / Total assets
Item 2018 (‘000) 2019 (‘000)
Revenue 53647 51750
Total assets 159422 167489
Assets turnover ratio 0.33 0.30
Formula:
Inventory turnover ratio = COGS / Inventory
Item 2018 (‘000) 2019 (‘000)
COGS 11248 10219
Inventory 7508 8283
Inventory turnover ratio 1.49 1.23
Liquidity Ratio:
Formula:
Current ratio = Current Assets / Current liabilities
Item 2018 (‘000) 2019 (‘000)
Current assets 49926 32803
Current liabilities 31858 37404
Current Ratio 1.56 0.87
Formula:
Quick Ratio = Quick assets / current liabilities
Item 2018 (‘000) 2019 (‘000)
Quick assets 42418 24520
2
Paraphrase This Document
Need a fresh take? Get an instant paraphrase of this document with our AI Paraphraser
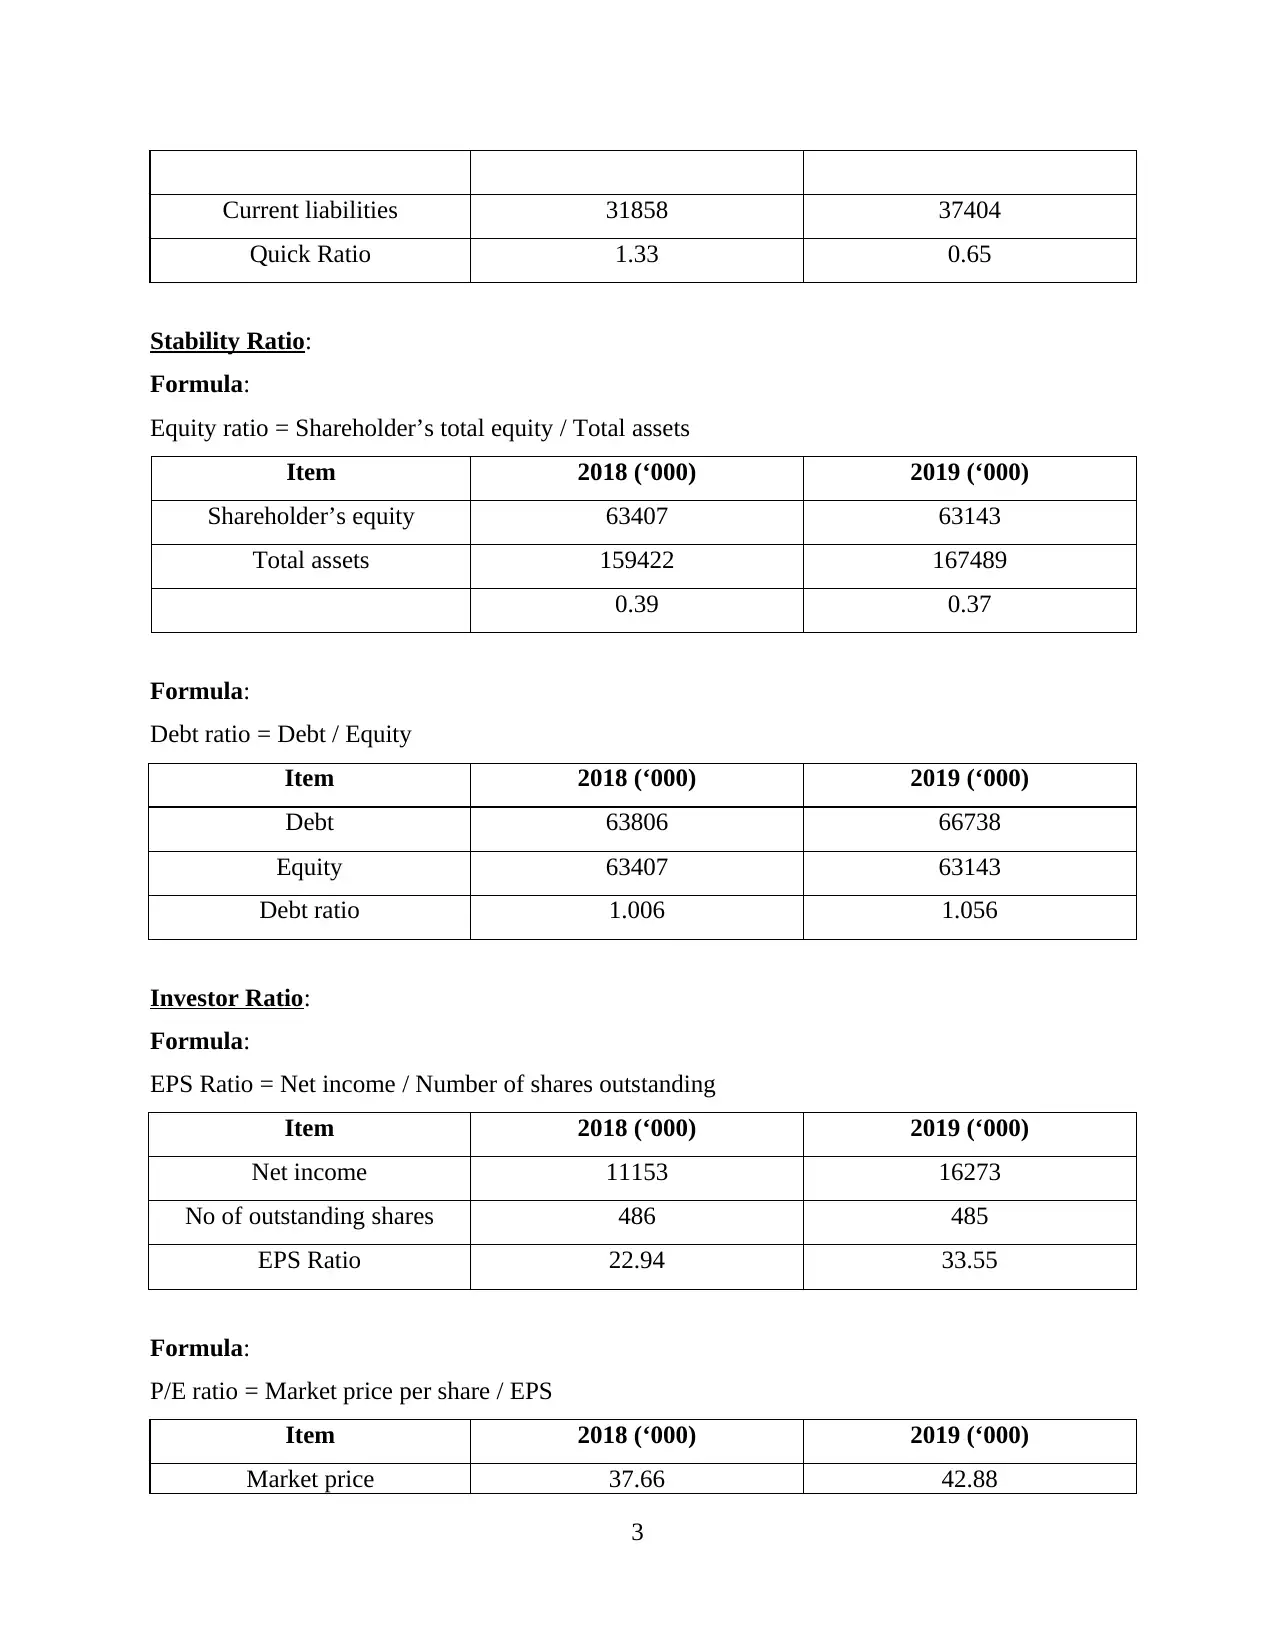
Current liabilities 31858 37404
Quick Ratio 1.33 0.65
Stability Ratio:
Formula:
Equity ratio = Shareholder’s total equity / Total assets
Item 2018 (‘000) 2019 (‘000)
Shareholder’s equity 63407 63143
Total assets 159422 167489
0.39 0.37
Formula:
Debt ratio = Debt / Equity
Item 2018 (‘000) 2019 (‘000)
Debt 63806 66738
Equity 63407 63143
Debt ratio 1.006 1.056
Investor Ratio:
Formula:
EPS Ratio = Net income / Number of shares outstanding
Item 2018 (‘000) 2019 (‘000)
Net income 11153 16273
No of outstanding shares 486 485
EPS Ratio 22.94 33.55
Formula:
P/E ratio = Market price per share / EPS
Item 2018 (‘000) 2019 (‘000)
Market price 37.66 42.88
3
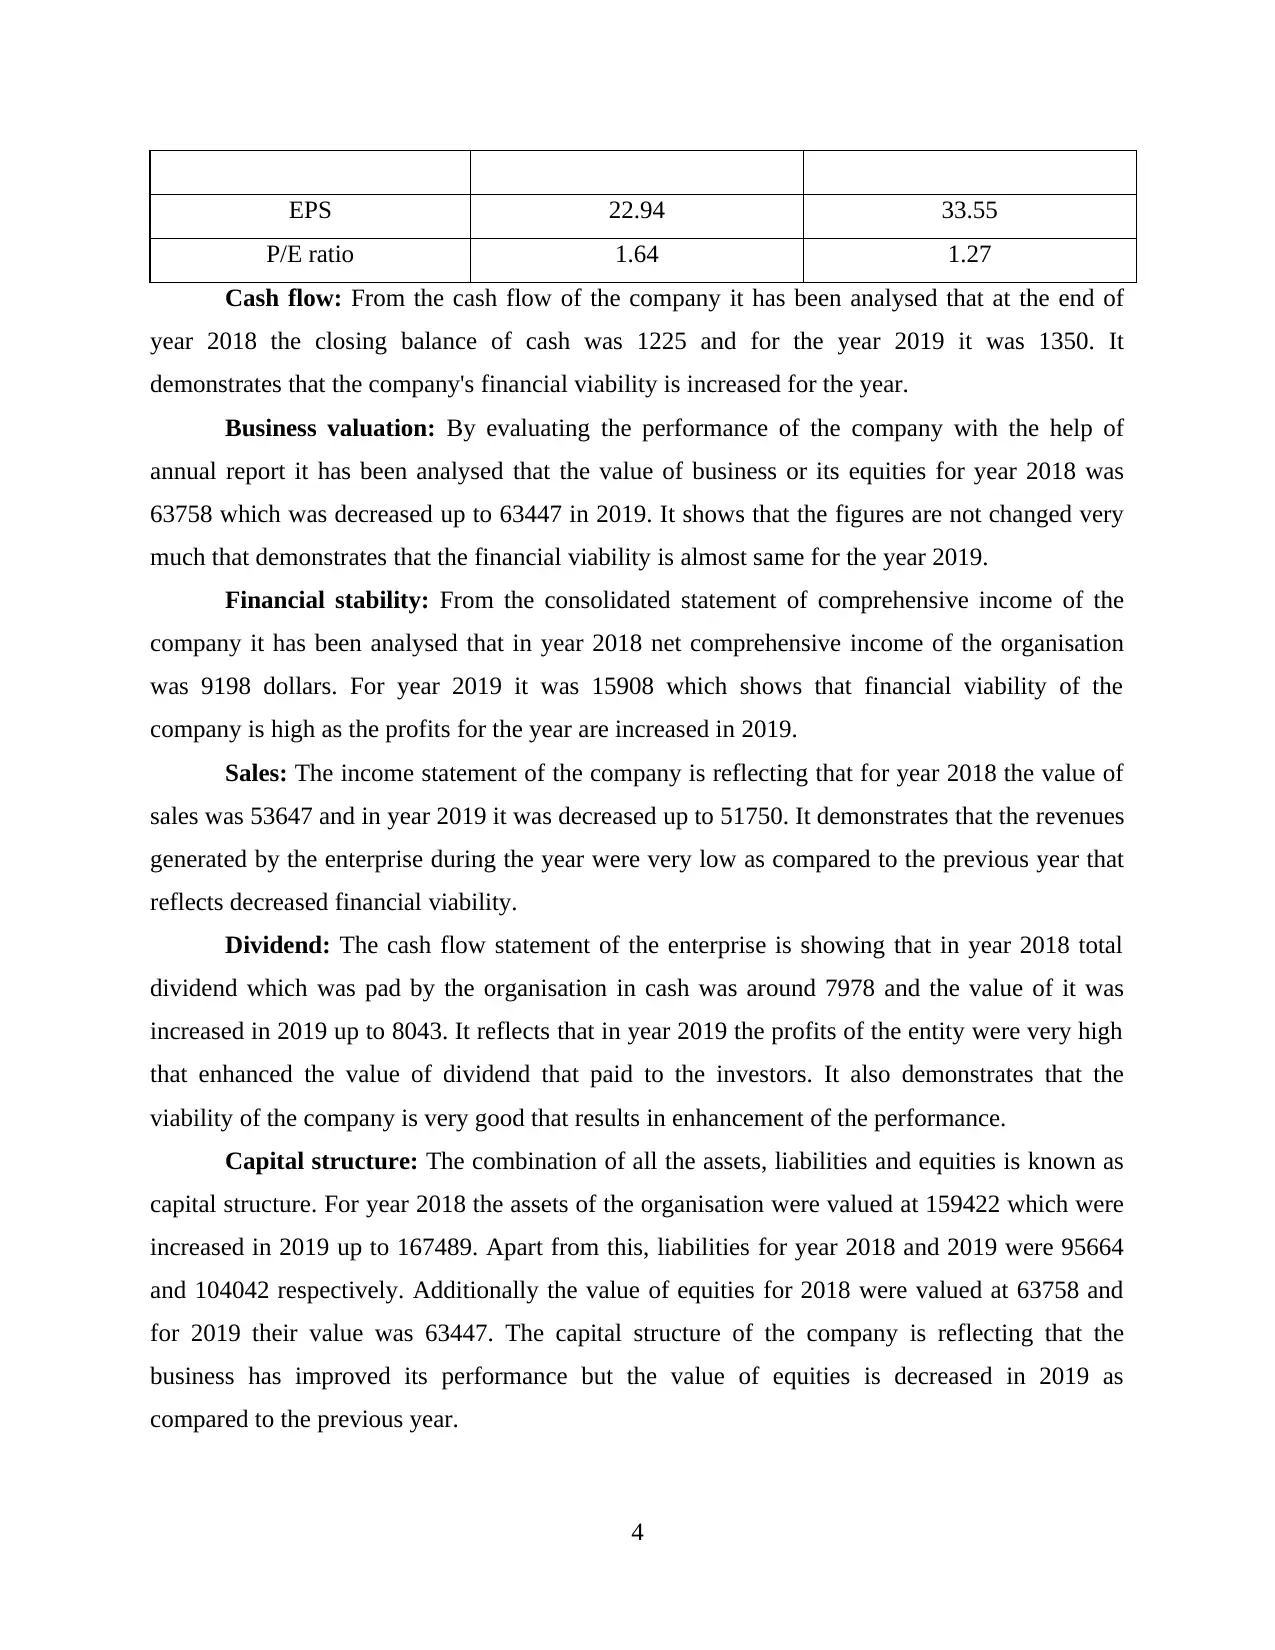
EPS 22.94 33.55
P/E ratio 1.64 1.27
Cash flow: From the cash flow of the company it has been analysed that at the end of
year 2018 the closing balance of cash was 1225 and for the year 2019 it was 1350. It
demonstrates that the company's financial viability is increased for the year.
Business valuation: By evaluating the performance of the company with the help of
annual report it has been analysed that the value of business or its equities for year 2018 was
63758 which was decreased up to 63447 in 2019. It shows that the figures are not changed very
much that demonstrates that the financial viability is almost same for the year 2019.
Financial stability: From the consolidated statement of comprehensive income of the
company it has been analysed that in year 2018 net comprehensive income of the organisation
was 9198 dollars. For year 2019 it was 15908 which shows that financial viability of the
company is high as the profits for the year are increased in 2019.
Sales: The income statement of the company is reflecting that for year 2018 the value of
sales was 53647 and in year 2019 it was decreased up to 51750. It demonstrates that the revenues
generated by the enterprise during the year were very low as compared to the previous year that
reflects decreased financial viability.
Dividend: The cash flow statement of the enterprise is showing that in year 2018 total
dividend which was pad by the organisation in cash was around 7978 and the value of it was
increased in 2019 up to 8043. It reflects that in year 2019 the profits of the entity were very high
that enhanced the value of dividend that paid to the investors. It also demonstrates that the
viability of the company is very good that results in enhancement of the performance.
Capital structure: The combination of all the assets, liabilities and equities is known as
capital structure. For year 2018 the assets of the organisation were valued at 159422 which were
increased in 2019 up to 167489. Apart from this, liabilities for year 2018 and 2019 were 95664
and 104042 respectively. Additionally the value of equities for 2018 were valued at 63758 and
for 2019 their value was 63447. The capital structure of the company is reflecting that the
business has improved its performance but the value of equities is decreased in 2019 as
compared to the previous year.
4
⊘ This is a preview!⊘
Do you want full access?
Subscribe today to unlock all pages.
Trusted by 1+ million students worldwide
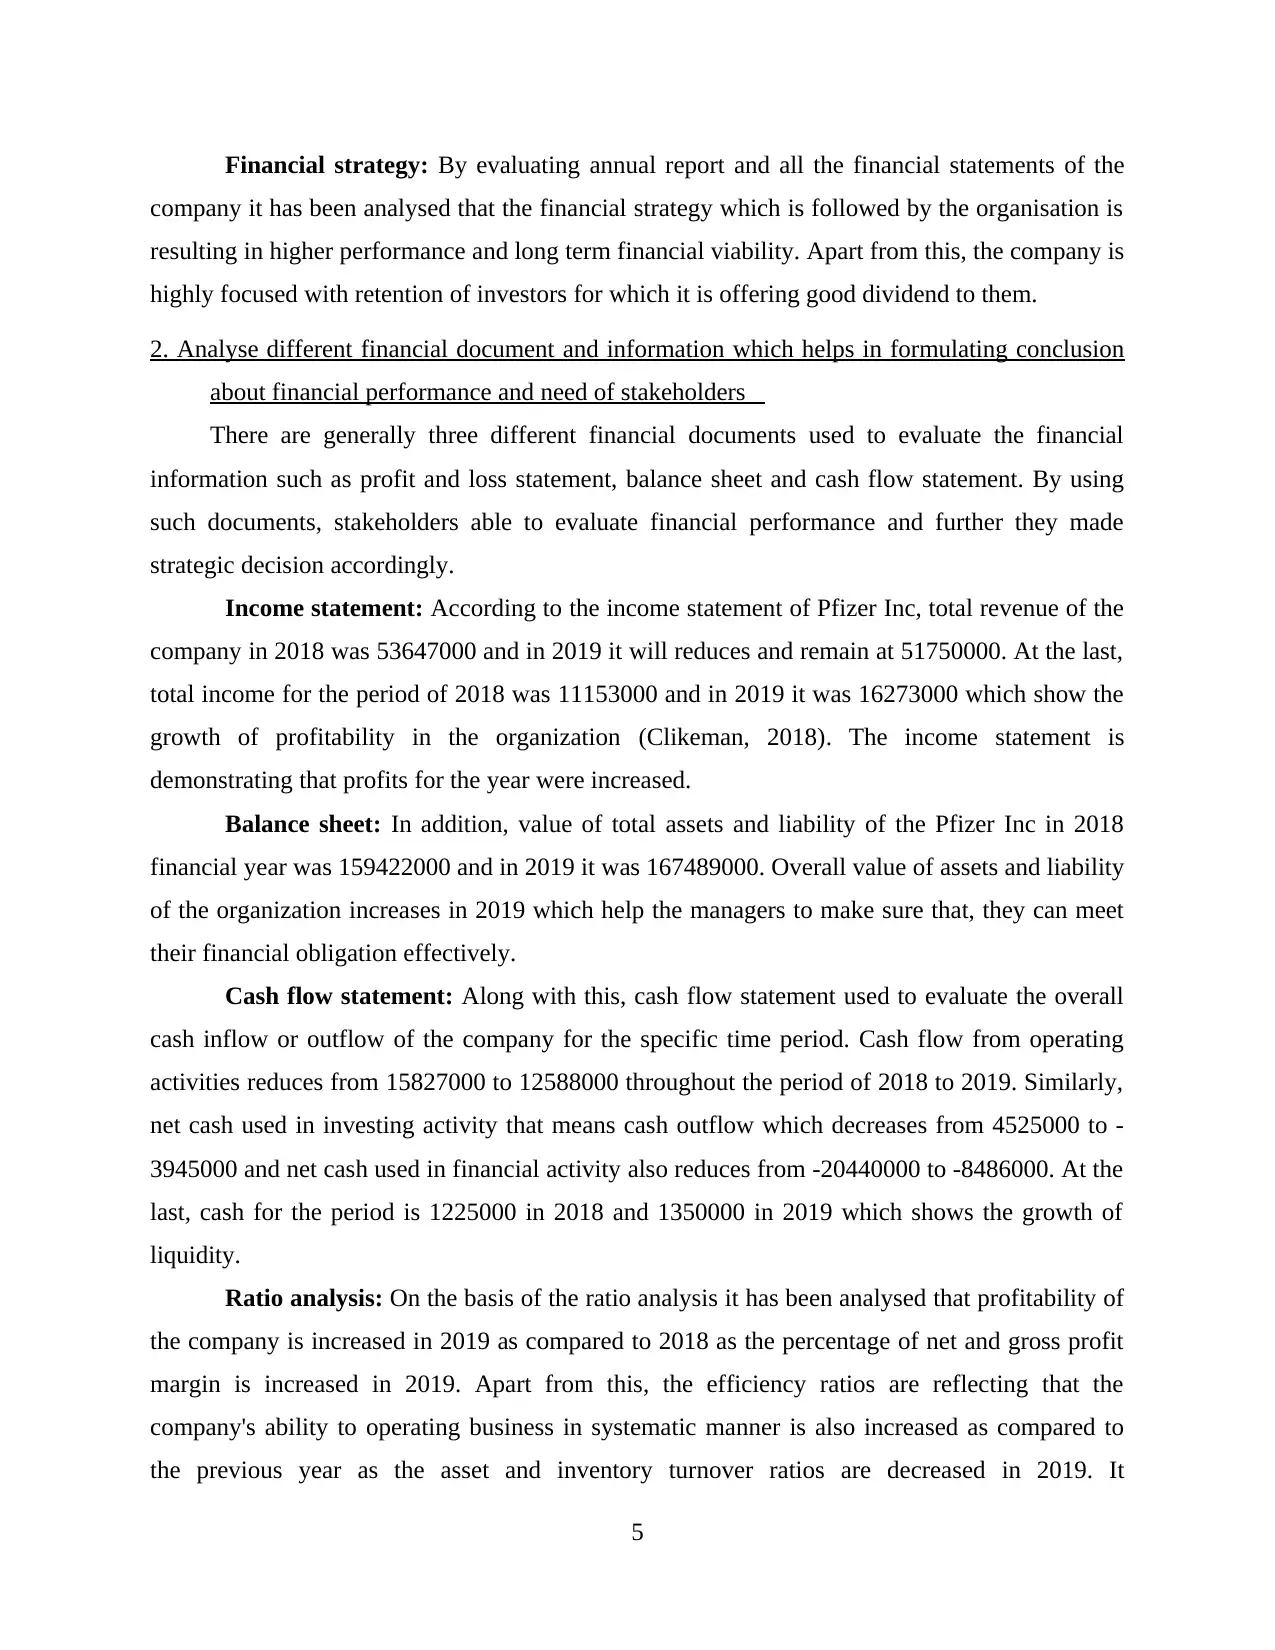
Financial strategy: By evaluating annual report and all the financial statements of the
company it has been analysed that the financial strategy which is followed by the organisation is
resulting in higher performance and long term financial viability. Apart from this, the company is
highly focused with retention of investors for which it is offering good dividend to them.
2. Analyse different financial document and information which helps in formulating conclusion
about financial performance and need of stakeholders
There are generally three different financial documents used to evaluate the financial
information such as profit and loss statement, balance sheet and cash flow statement. By using
such documents, stakeholders able to evaluate financial performance and further they made
strategic decision accordingly.
Income statement: According to the income statement of Pfizer Inc, total revenue of the
company in 2018 was 53647000 and in 2019 it will reduces and remain at 51750000. At the last,
total income for the period of 2018 was 11153000 and in 2019 it was 16273000 which show the
growth of profitability in the organization (Clikeman, 2018). The income statement is
demonstrating that profits for the year were increased.
Balance sheet: In addition, value of total assets and liability of the Pfizer Inc in 2018
financial year was 159422000 and in 2019 it was 167489000. Overall value of assets and liability
of the organization increases in 2019 which help the managers to make sure that, they can meet
their financial obligation effectively.
Cash flow statement: Along with this, cash flow statement used to evaluate the overall
cash inflow or outflow of the company for the specific time period. Cash flow from operating
activities reduces from 15827000 to 12588000 throughout the period of 2018 to 2019. Similarly,
net cash used in investing activity that means cash outflow which decreases from 4525000 to -
3945000 and net cash used in financial activity also reduces from -20440000 to -8486000. At the
last, cash for the period is 1225000 in 2018 and 1350000 in 2019 which shows the growth of
liquidity.
Ratio analysis: On the basis of the ratio analysis it has been analysed that profitability of
the company is increased in 2019 as compared to 2018 as the percentage of net and gross profit
margin is increased in 2019. Apart from this, the efficiency ratios are reflecting that the
company's ability to operating business in systematic manner is also increased as compared to
the previous year as the asset and inventory turnover ratios are decreased in 2019. It
5
Paraphrase This Document
Need a fresh take? Get an instant paraphrase of this document with our AI Paraphraser
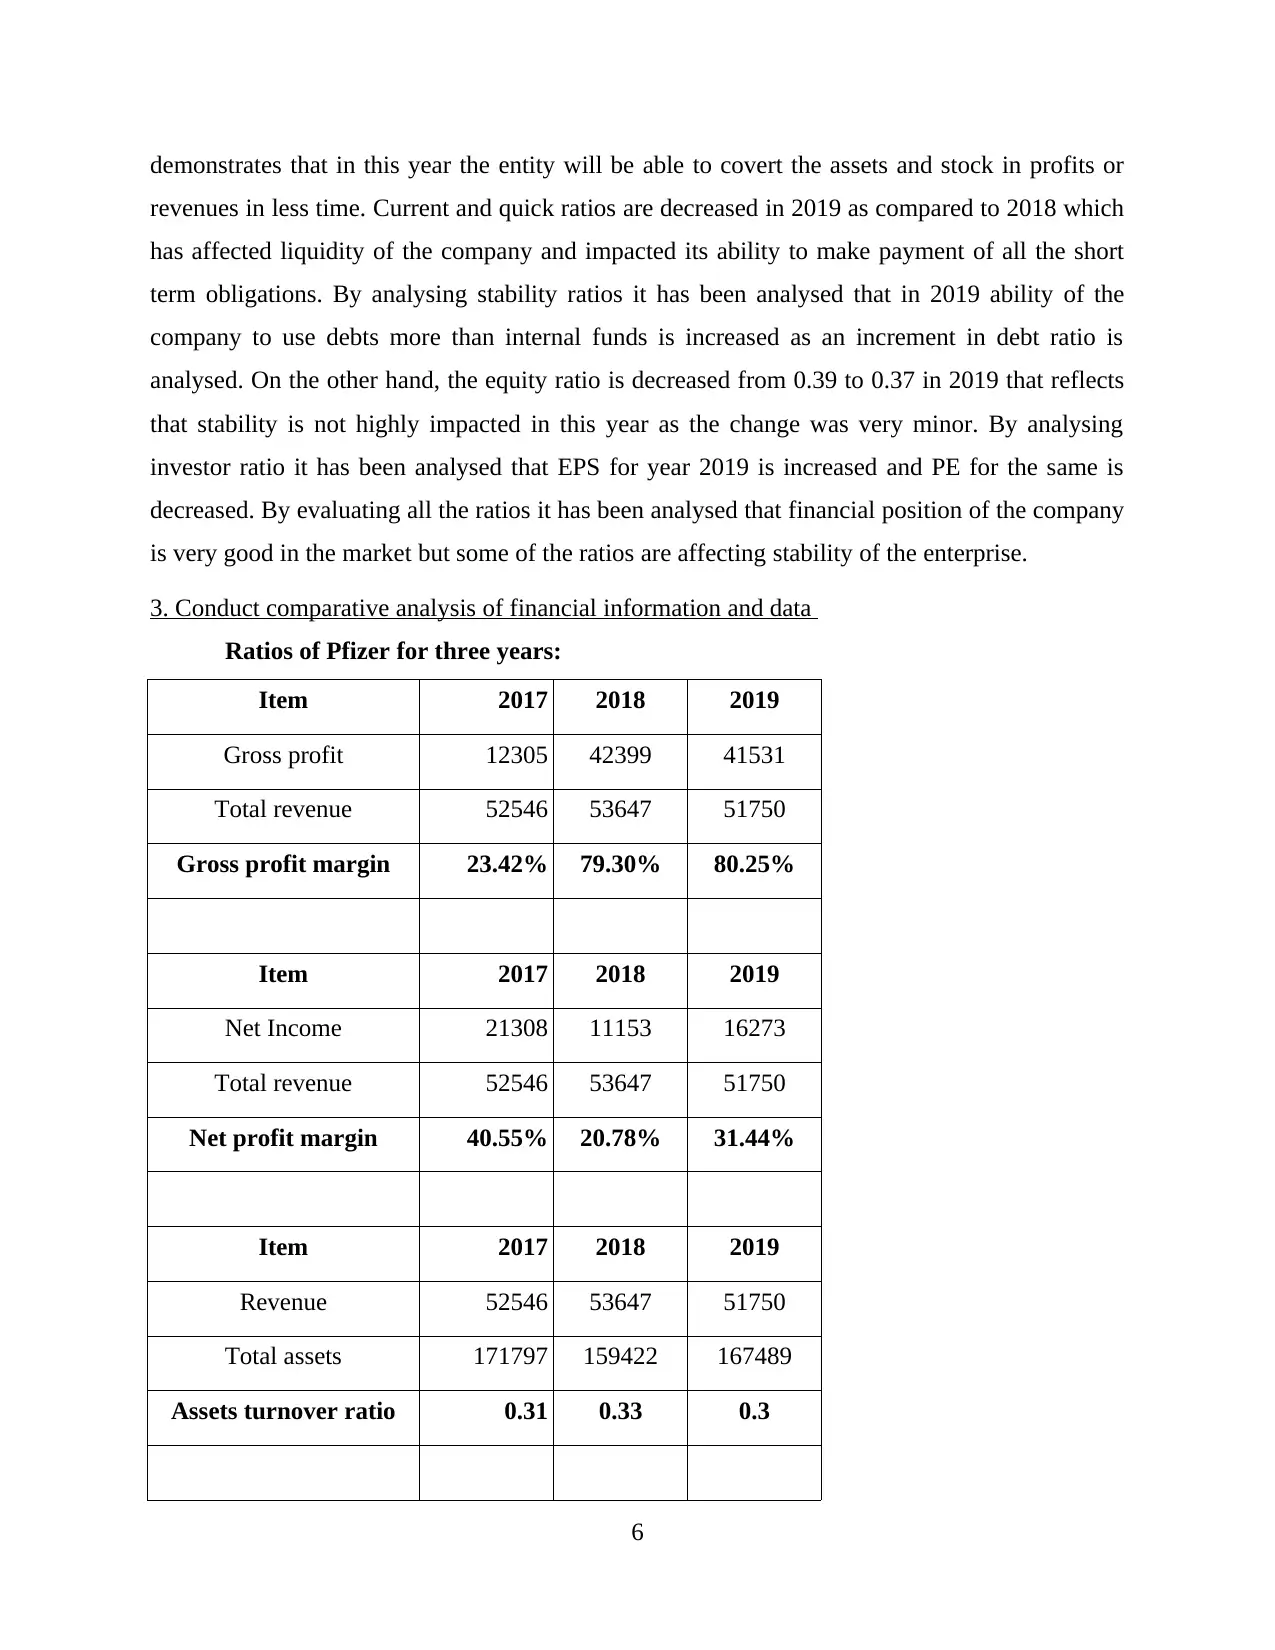
demonstrates that in this year the entity will be able to covert the assets and stock in profits or
revenues in less time. Current and quick ratios are decreased in 2019 as compared to 2018 which
has affected liquidity of the company and impacted its ability to make payment of all the short
term obligations. By analysing stability ratios it has been analysed that in 2019 ability of the
company to use debts more than internal funds is increased as an increment in debt ratio is
analysed. On the other hand, the equity ratio is decreased from 0.39 to 0.37 in 2019 that reflects
that stability is not highly impacted in this year as the change was very minor. By analysing
investor ratio it has been analysed that EPS for year 2019 is increased and PE for the same is
decreased. By evaluating all the ratios it has been analysed that financial position of the company
is very good in the market but some of the ratios are affecting stability of the enterprise.
3. Conduct comparative analysis of financial information and data
Ratios of Pfizer for three years:
Item 2017 2018 2019
Gross profit 12305 42399 41531
Total revenue 52546 53647 51750
Gross profit margin 23.42% 79.30% 80.25%
Item 2017 2018 2019
Net Income 21308 11153 16273
Total revenue 52546 53647 51750
Net profit margin 40.55% 20.78% 31.44%
Item 2017 2018 2019
Revenue 52546 53647 51750
Total assets 171797 159422 167489
Assets turnover ratio 0.31 0.33 0.3
6
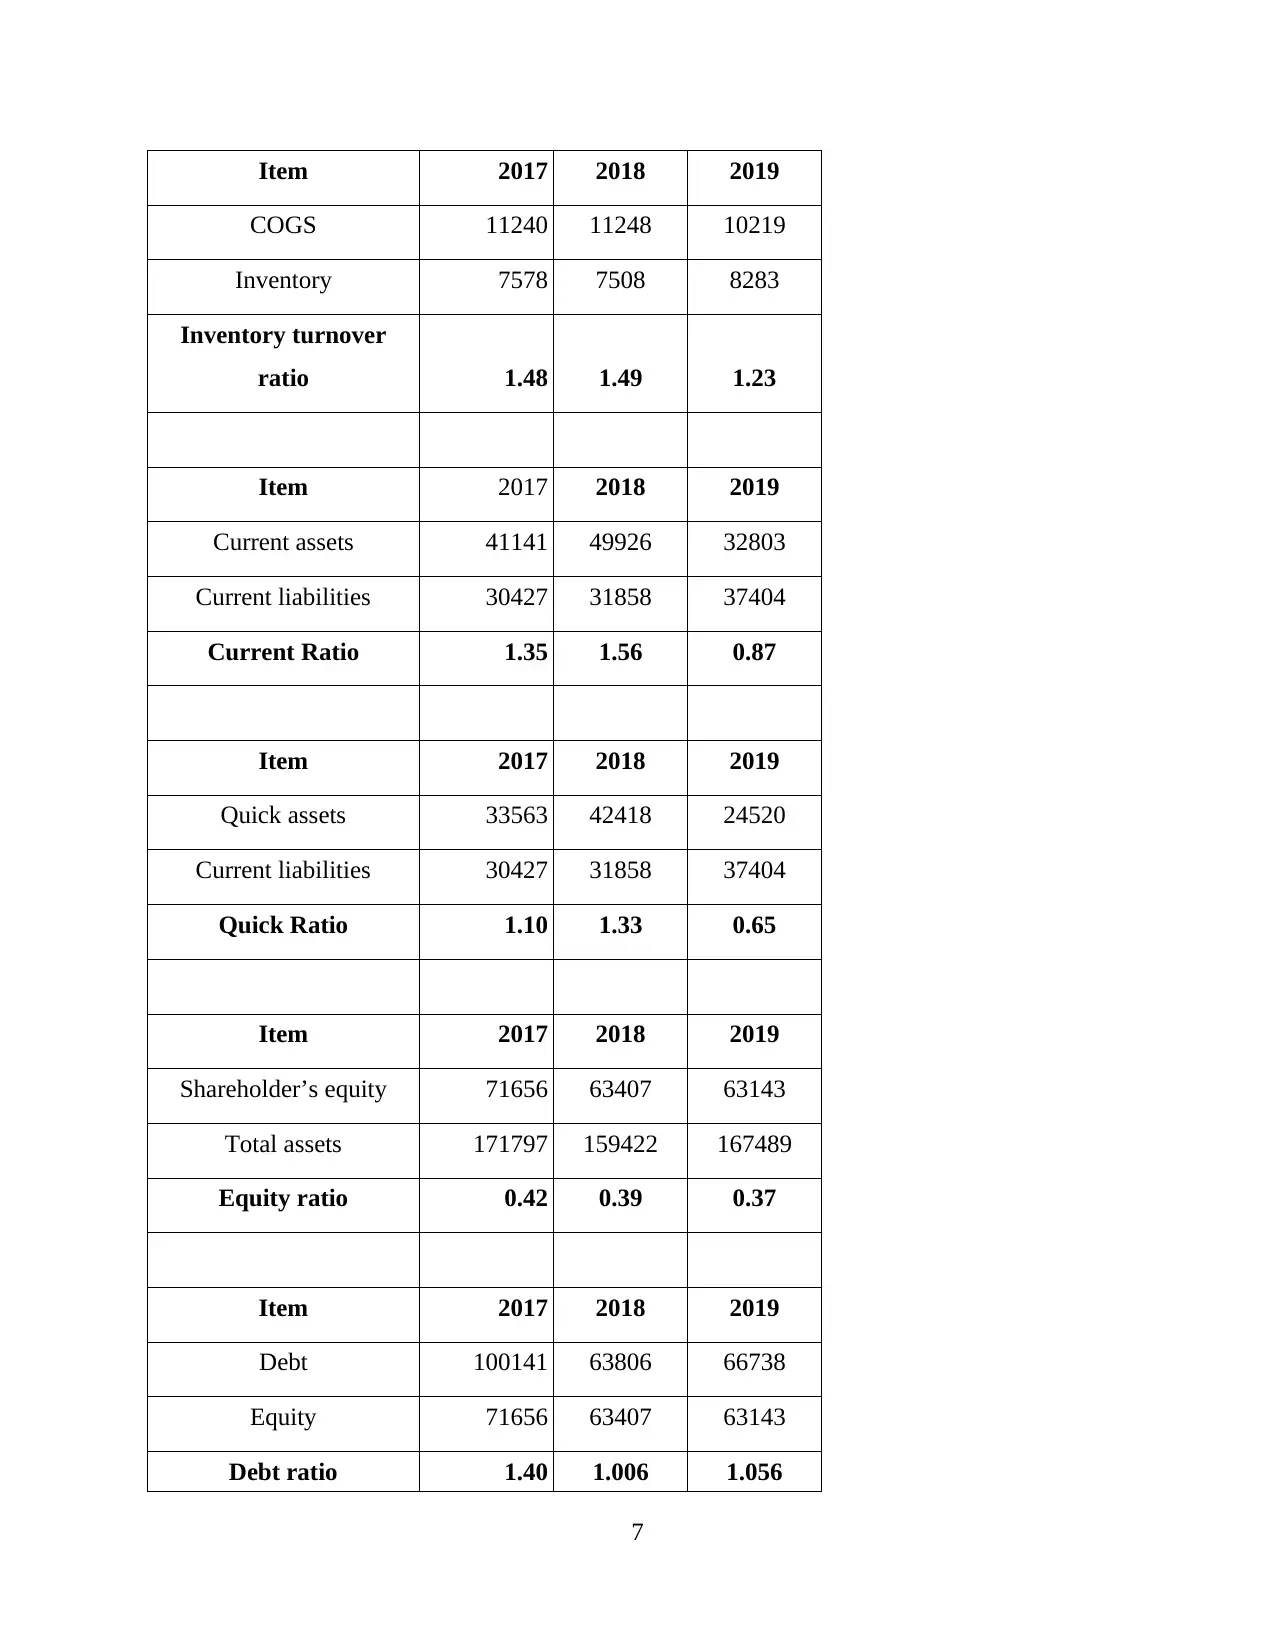
Item 2017 2018 2019
COGS 11240 11248 10219
Inventory 7578 7508 8283
Inventory turnover
ratio 1.48 1.49 1.23
Item 2017 2018 2019
Current assets 41141 49926 32803
Current liabilities 30427 31858 37404
Current Ratio 1.35 1.56 0.87
Item 2017 2018 2019
Quick assets 33563 42418 24520
Current liabilities 30427 31858 37404
Quick Ratio 1.10 1.33 0.65
Item 2017 2018 2019
Shareholder’s equity 71656 63407 63143
Total assets 171797 159422 167489
Equity ratio 0.42 0.39 0.37
Item 2017 2018 2019
Debt 100141 63806 66738
Equity 71656 63407 63143
Debt ratio 1.40 1.006 1.056
7
⊘ This is a preview!⊘
Do you want full access?
Subscribe today to unlock all pages.
Trusted by 1+ million students worldwide
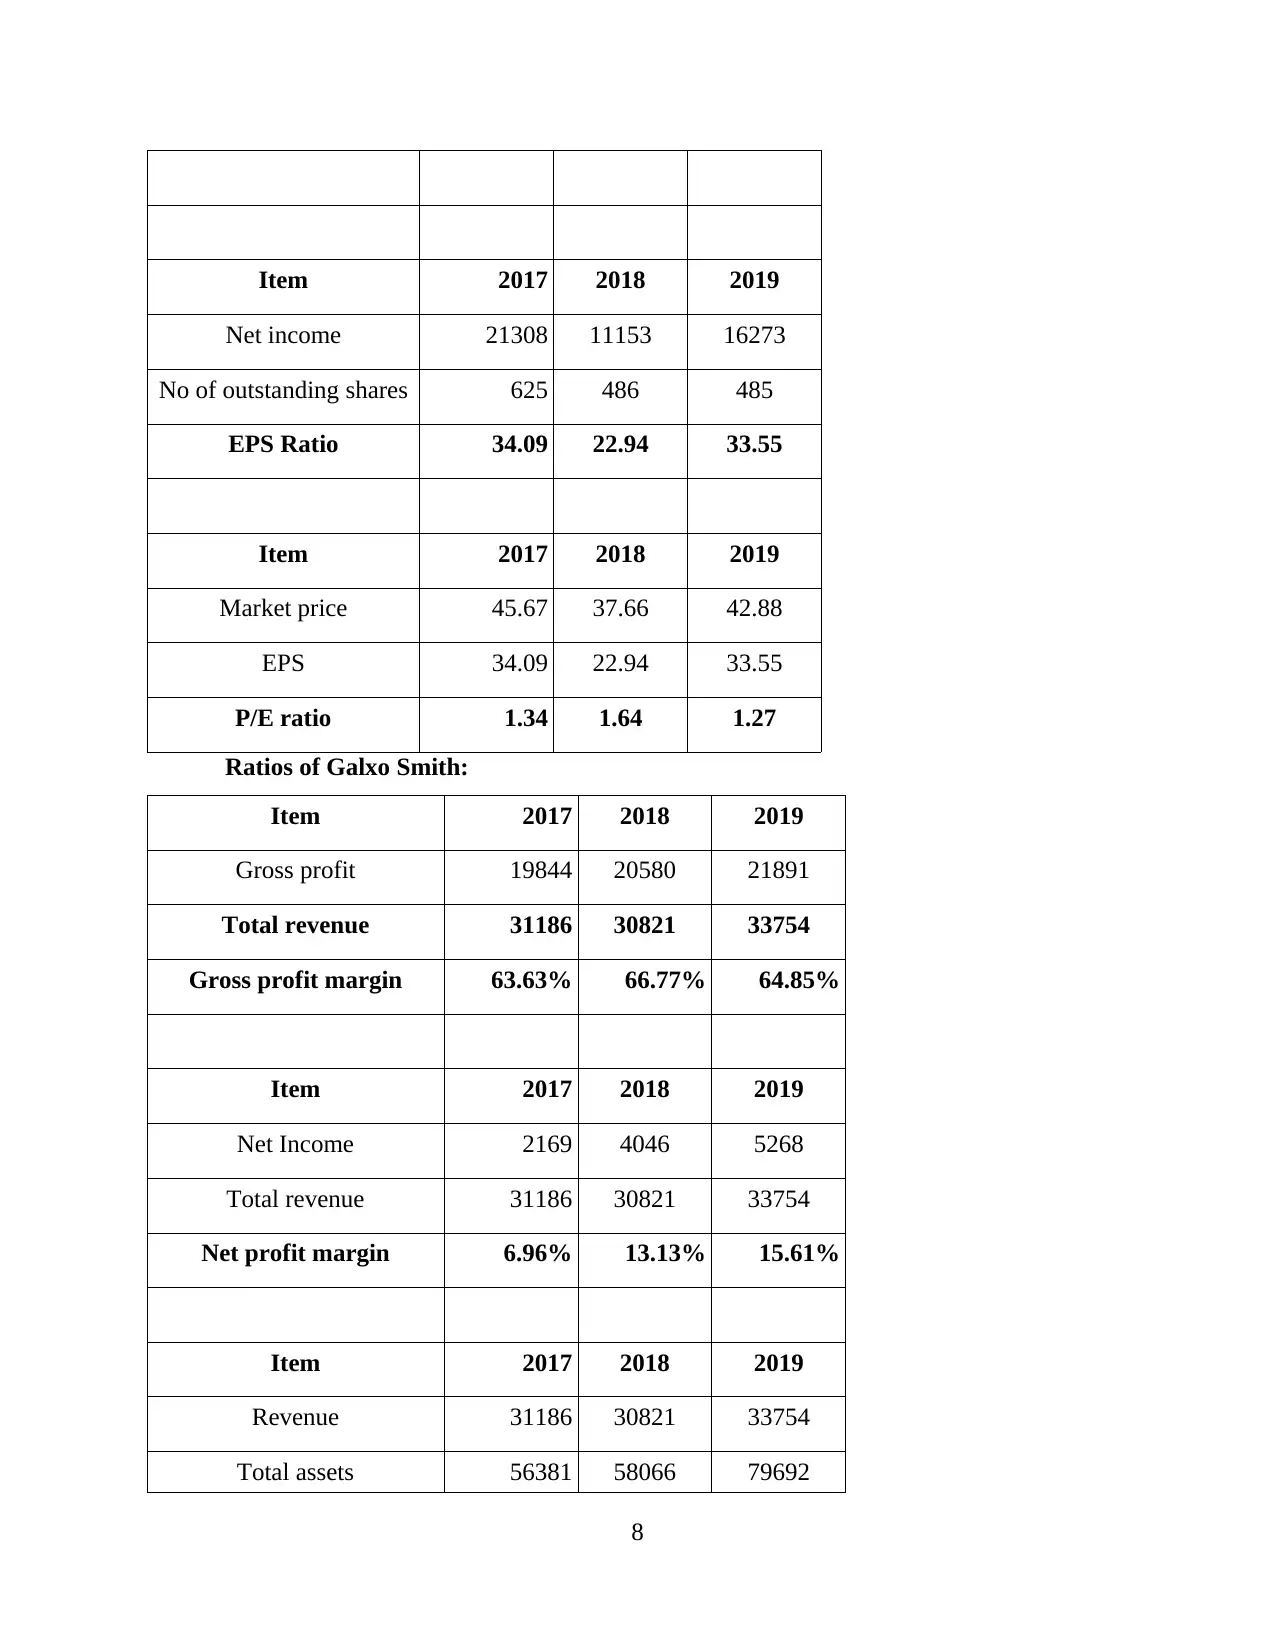
Item 2017 2018 2019
Net income 21308 11153 16273
No of outstanding shares 625 486 485
EPS Ratio 34.09 22.94 33.55
Item 2017 2018 2019
Market price 45.67 37.66 42.88
EPS 34.09 22.94 33.55
P/E ratio 1.34 1.64 1.27
Ratios of Galxo Smith:
Item 2017 2018 2019
Gross profit 19844 20580 21891
Total revenue 31186 30821 33754
Gross profit margin 63.63% 66.77% 64.85%
Item 2017 2018 2019
Net Income 2169 4046 5268
Total revenue 31186 30821 33754
Net profit margin 6.96% 13.13% 15.61%
Item 2017 2018 2019
Revenue 31186 30821 33754
Total assets 56381 58066 79692
8
Paraphrase This Document
Need a fresh take? Get an instant paraphrase of this document with our AI Paraphraser
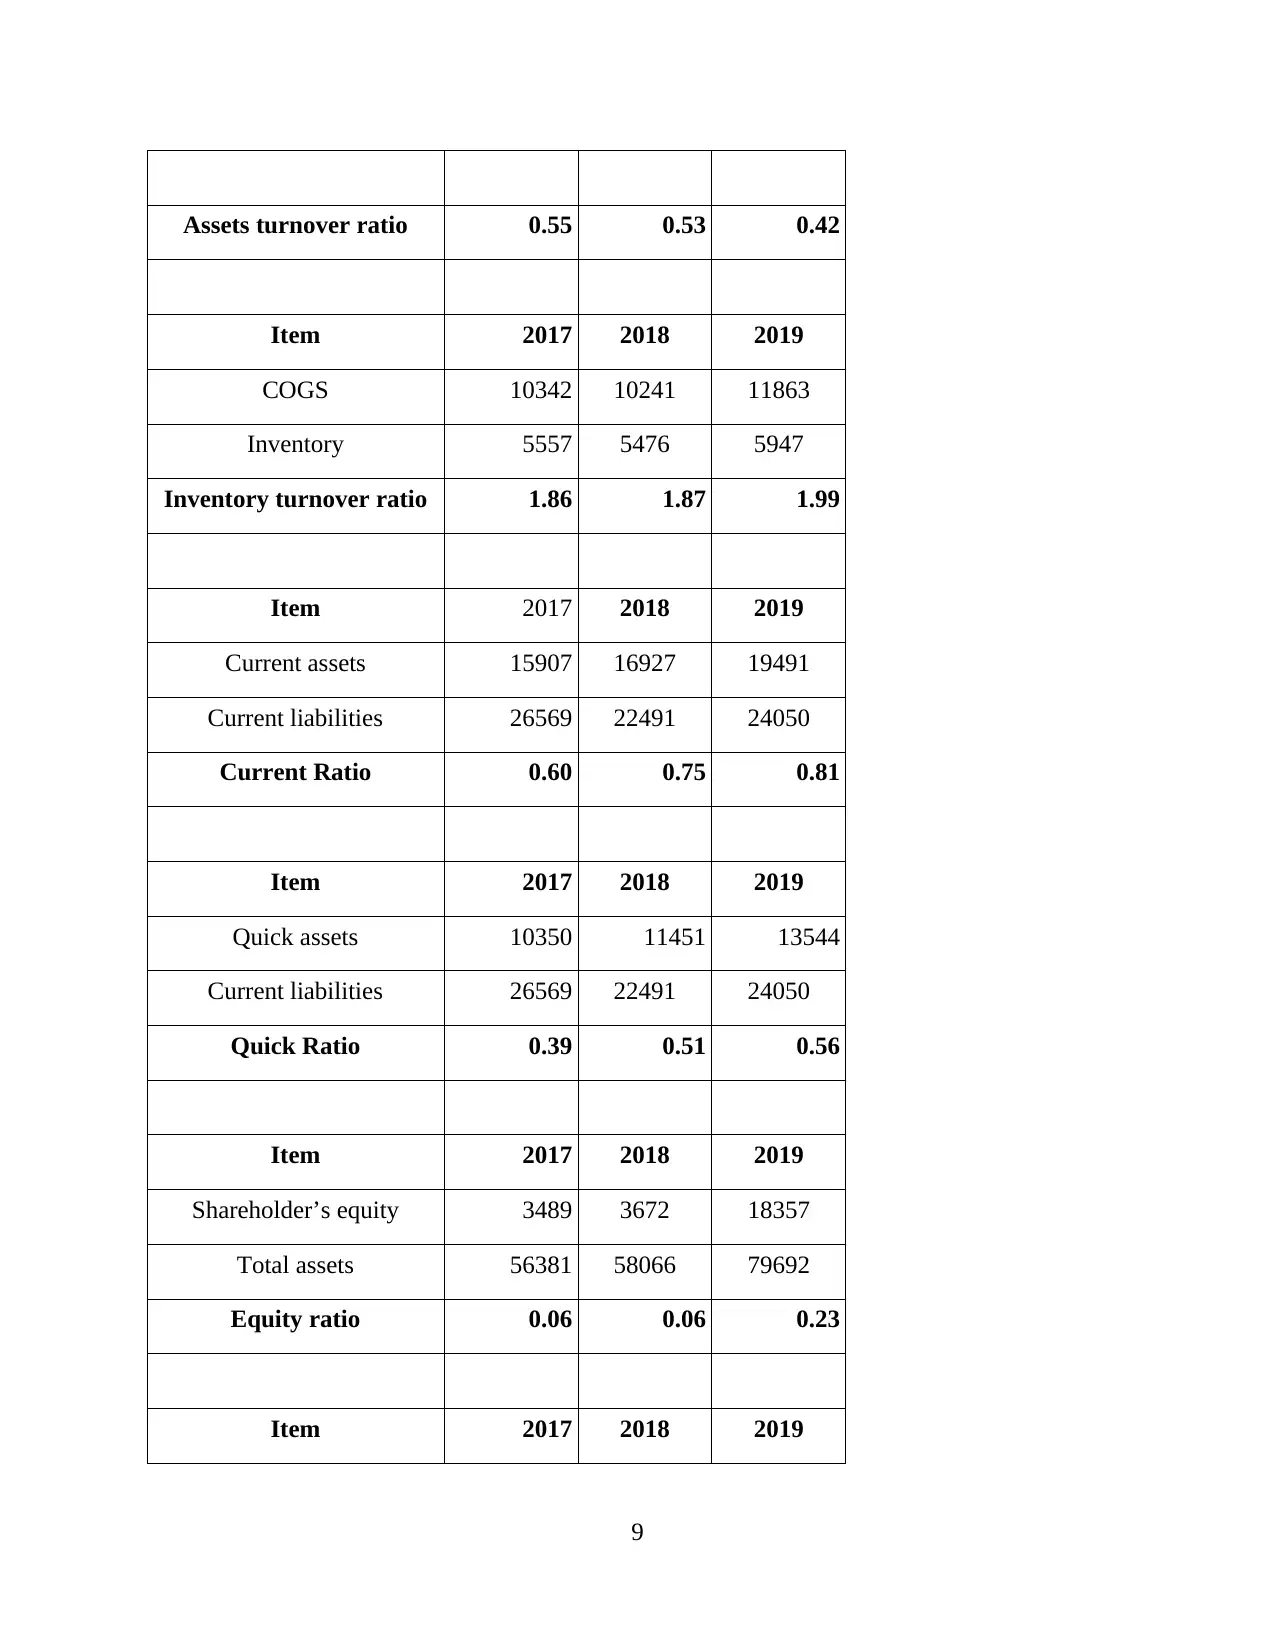
Assets turnover ratio 0.55 0.53 0.42
Item 2017 2018 2019
COGS 10342 10241 11863
Inventory 5557 5476 5947
Inventory turnover ratio 1.86 1.87 1.99
Item 2017 2018 2019
Current assets 15907 16927 19491
Current liabilities 26569 22491 24050
Current Ratio 0.60 0.75 0.81
Item 2017 2018 2019
Quick assets 10350 11451 13544
Current liabilities 26569 22491 24050
Quick Ratio 0.39 0.51 0.56
Item 2017 2018 2019
Shareholder’s equity 3489 3672 18357
Total assets 56381 58066 79692
Equity ratio 0.06 0.06 0.23
Item 2017 2018 2019
9
Item 2017 2018 2019
COGS 10342 10241 11863
Inventory 5557 5476 5947
Inventory turnover ratio 1.86 1.87 1.99
Item 2017 2018 2019
Current assets 15907 16927 19491
Current liabilities 26569 22491 24050
Current Ratio 0.60 0.75 0.81
Item 2017 2018 2019
Quick assets 10350 11451 13544
Current liabilities 26569 22491 24050
Quick Ratio 0.39 0.51 0.56
Item 2017 2018 2019
Shareholder’s equity 3489 3672 18357
Total assets 56381 58066 79692
Equity ratio 0.06 0.06 0.23
Item 2017 2018 2019
9
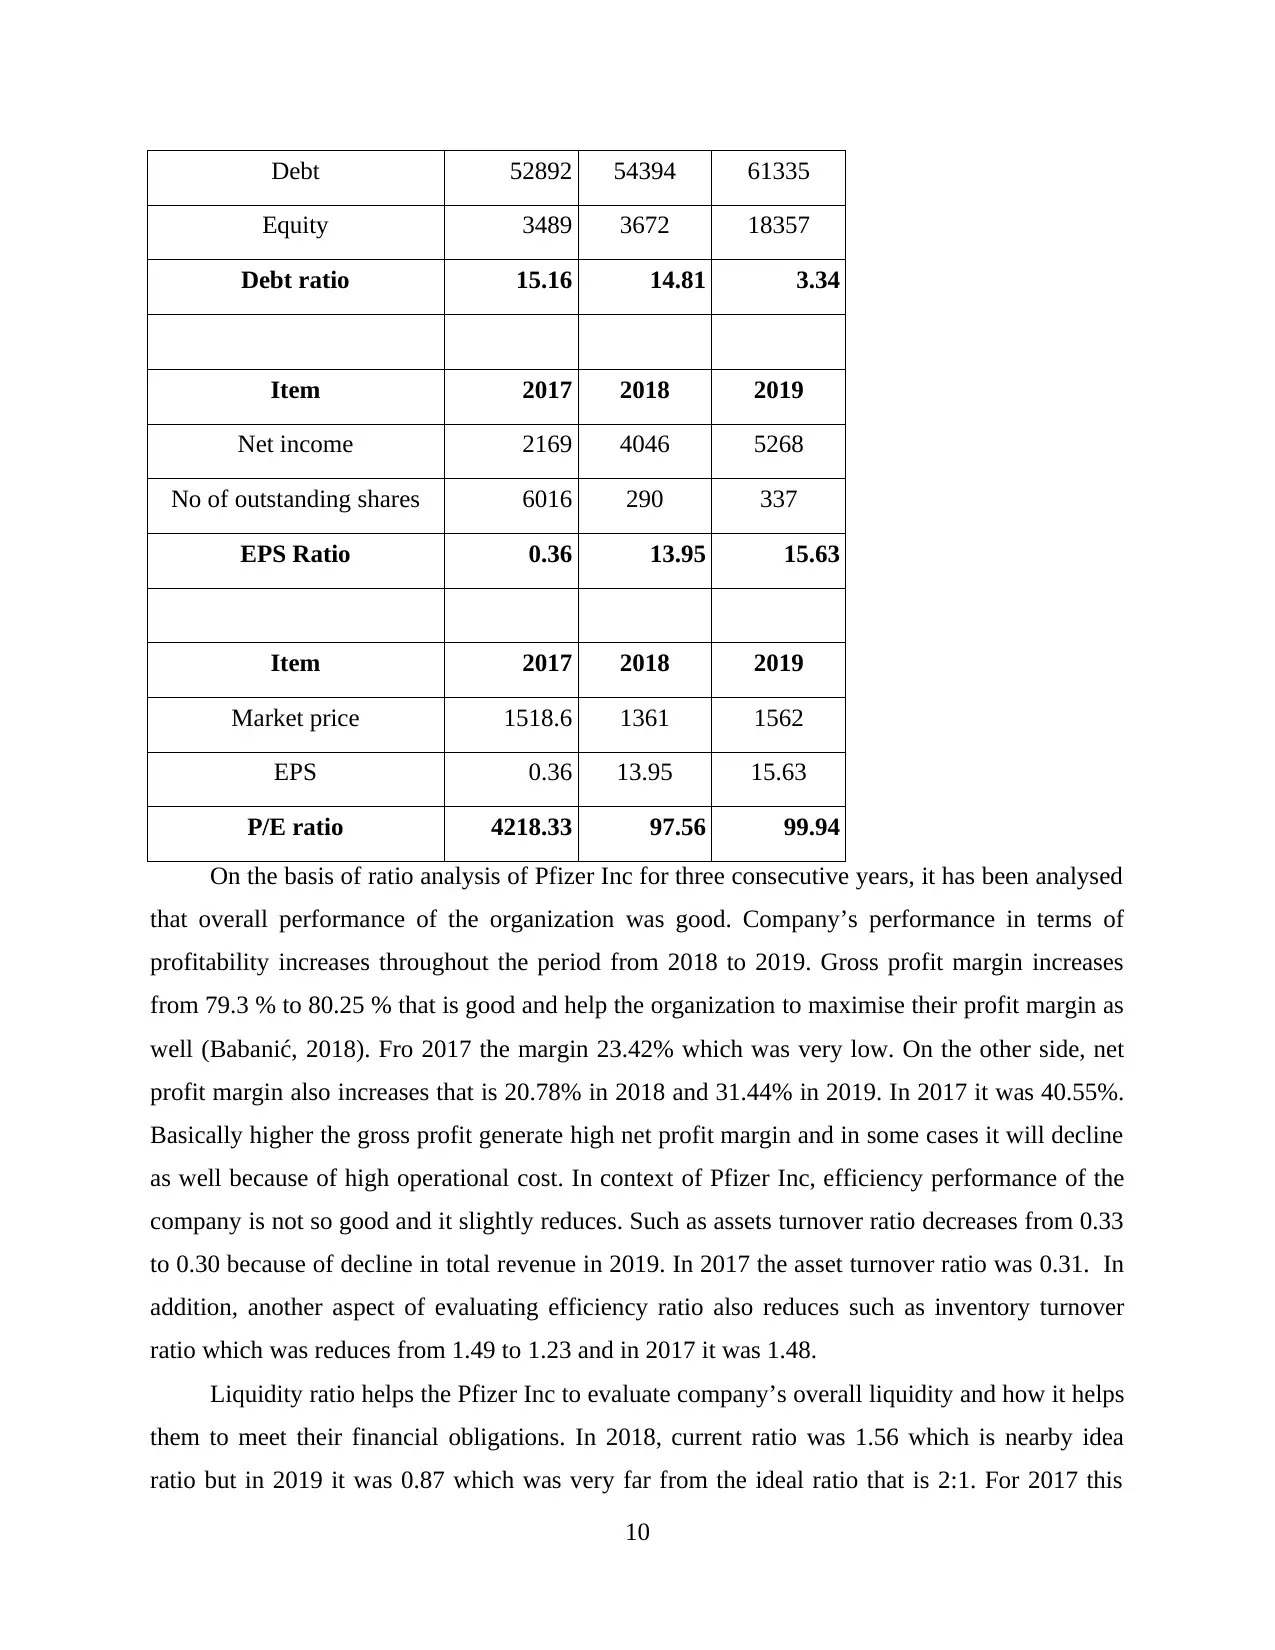
Debt 52892 54394 61335
Equity 3489 3672 18357
Debt ratio 15.16 14.81 3.34
Item 2017 2018 2019
Net income 2169 4046 5268
No of outstanding shares 6016 290 337
EPS Ratio 0.36 13.95 15.63
Item 2017 2018 2019
Market price 1518.6 1361 1562
EPS 0.36 13.95 15.63
P/E ratio 4218.33 97.56 99.94
On the basis of ratio analysis of Pfizer Inc for three consecutive years, it has been analysed
that overall performance of the organization was good. Company’s performance in terms of
profitability increases throughout the period from 2018 to 2019. Gross profit margin increases
from 79.3 % to 80.25 % that is good and help the organization to maximise their profit margin as
well (Babanić, 2018). Fro 2017 the margin 23.42% which was very low. On the other side, net
profit margin also increases that is 20.78% in 2018 and 31.44% in 2019. In 2017 it was 40.55%.
Basically higher the gross profit generate high net profit margin and in some cases it will decline
as well because of high operational cost. In context of Pfizer Inc, efficiency performance of the
company is not so good and it slightly reduces. Such as assets turnover ratio decreases from 0.33
to 0.30 because of decline in total revenue in 2019. In 2017 the asset turnover ratio was 0.31. In
addition, another aspect of evaluating efficiency ratio also reduces such as inventory turnover
ratio which was reduces from 1.49 to 1.23 and in 2017 it was 1.48.
Liquidity ratio helps the Pfizer Inc to evaluate company’s overall liquidity and how it helps
them to meet their financial obligations. In 2018, current ratio was 1.56 which is nearby idea
ratio but in 2019 it was 0.87 which was very far from the ideal ratio that is 2:1. For 2017 this
10
⊘ This is a preview!⊘
Do you want full access?
Subscribe today to unlock all pages.
Trusted by 1+ million students worldwide
1 out of 23
Related Documents


Your All-in-One AI-Powered Toolkit for Academic Success.
+13062052269
info@desklib.com
Available 24*7 on WhatsApp / Email
![[object Object]](/_next/static/media/star-bottom.7253800d.svg)
Unlock your academic potential
Copyright © 2020–2026 A2Z Services. All Rights Reserved. Developed and managed by ZUCOL.