Financial Management and Control: Primetown Plc Performance Report

Verified

Added on  2020/01/07

|25
|5462
|190
Report
AI Summary
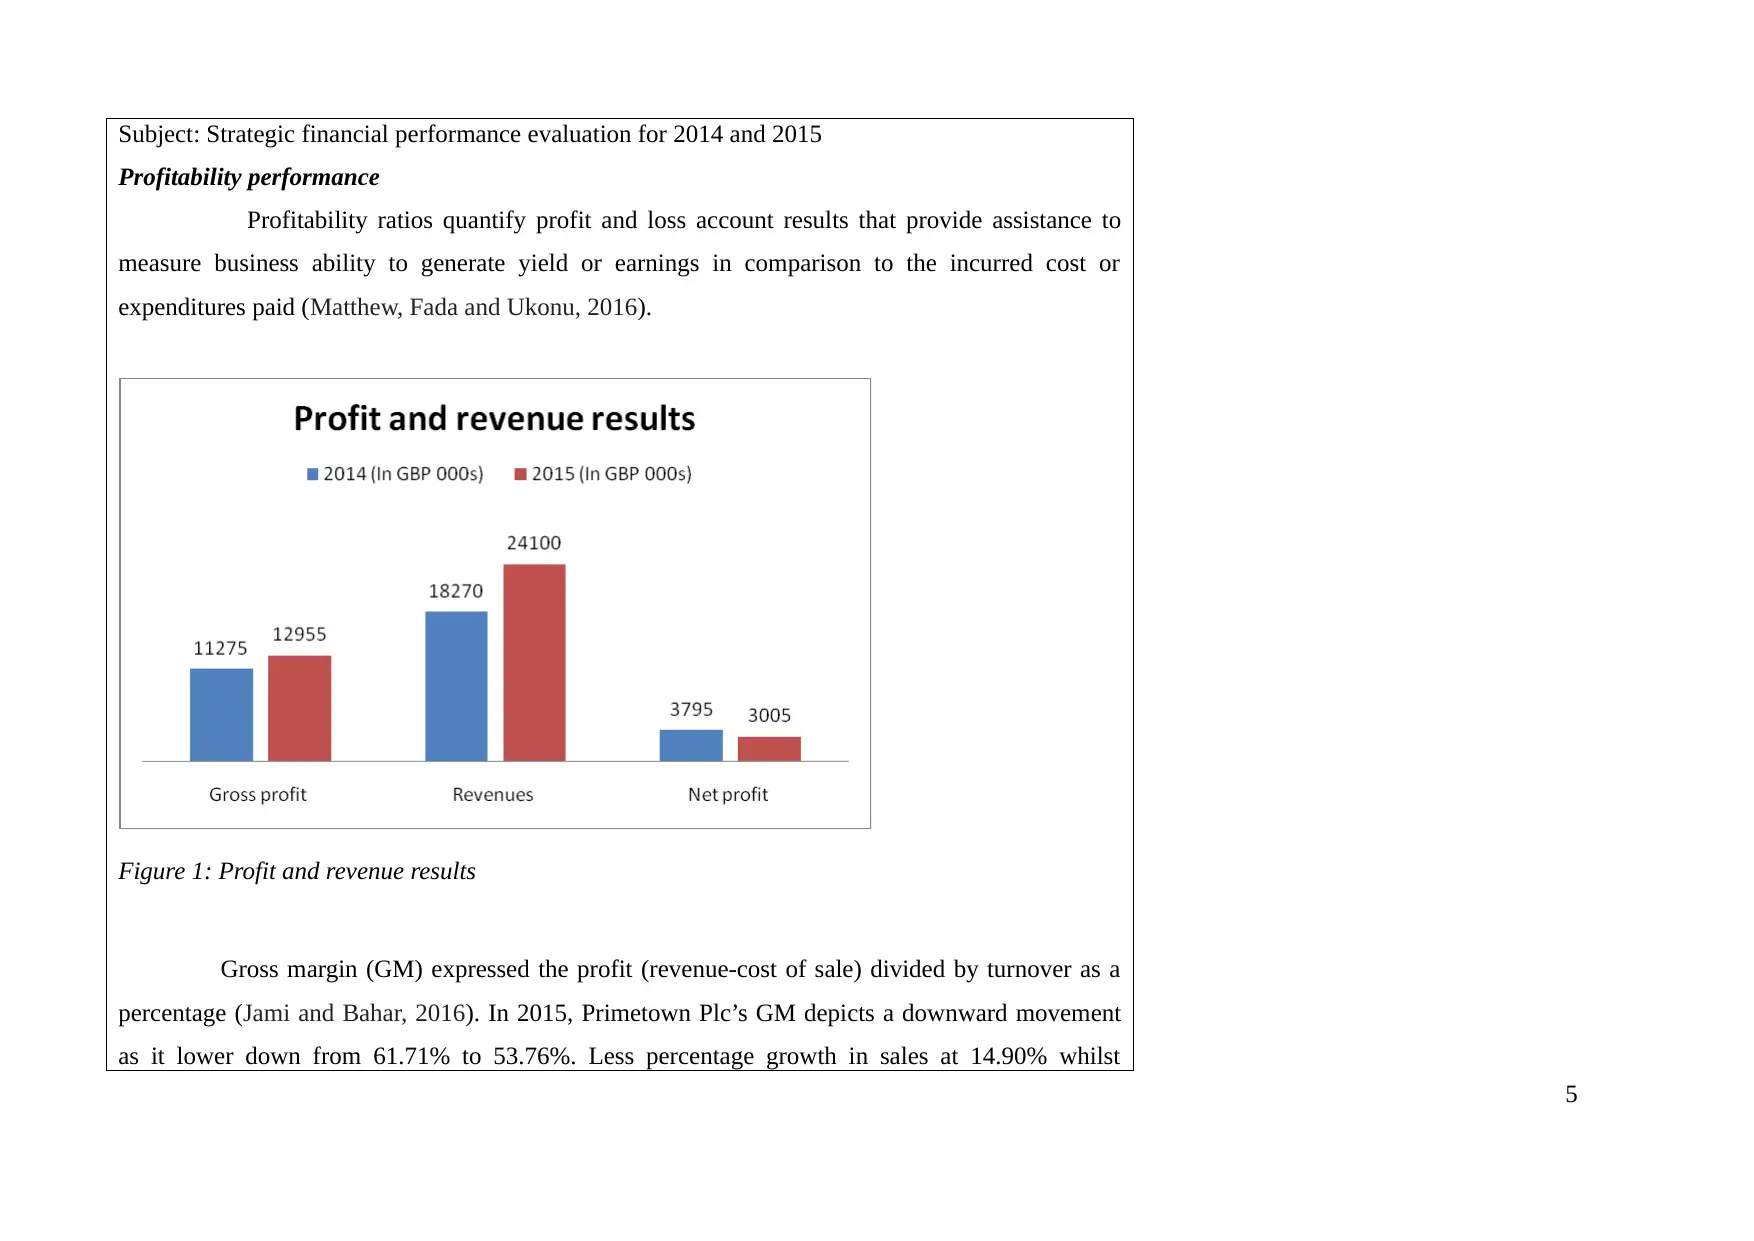
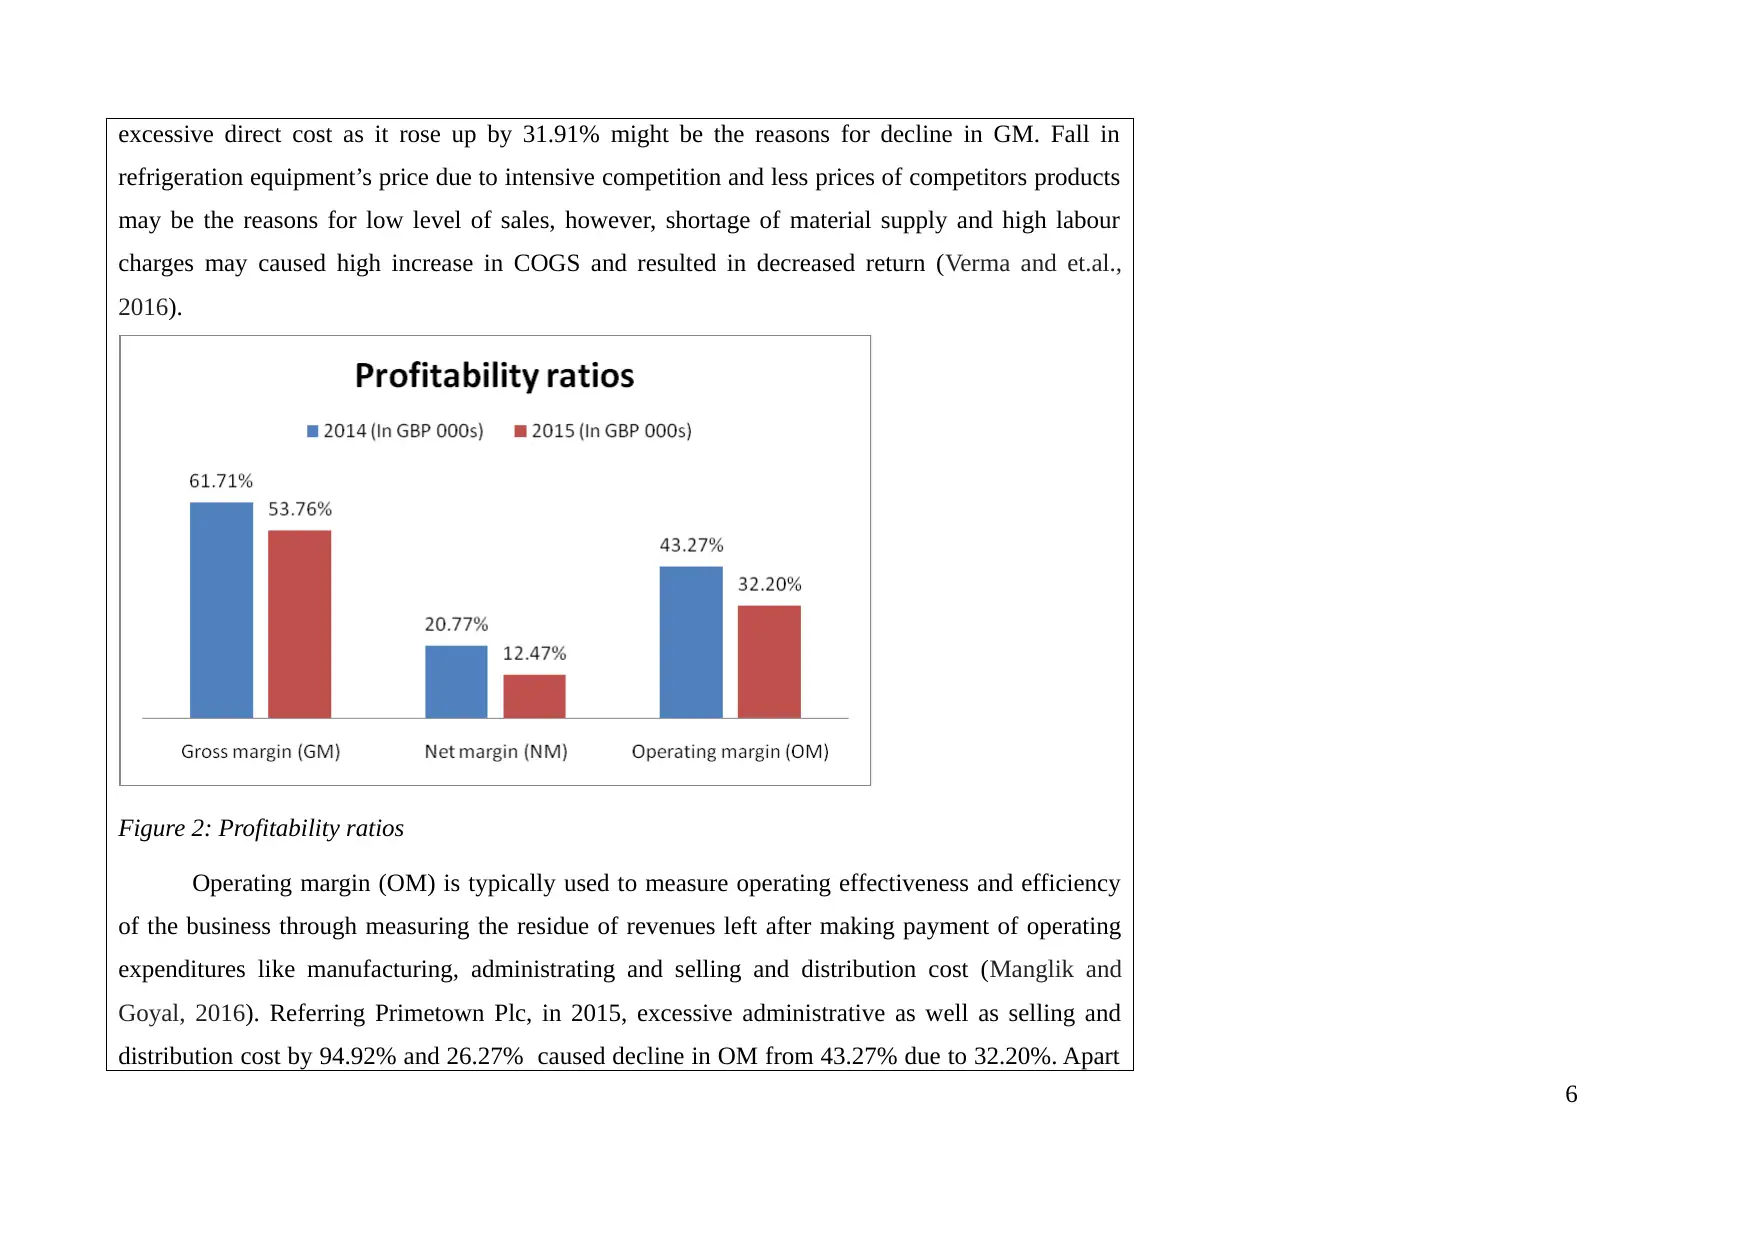
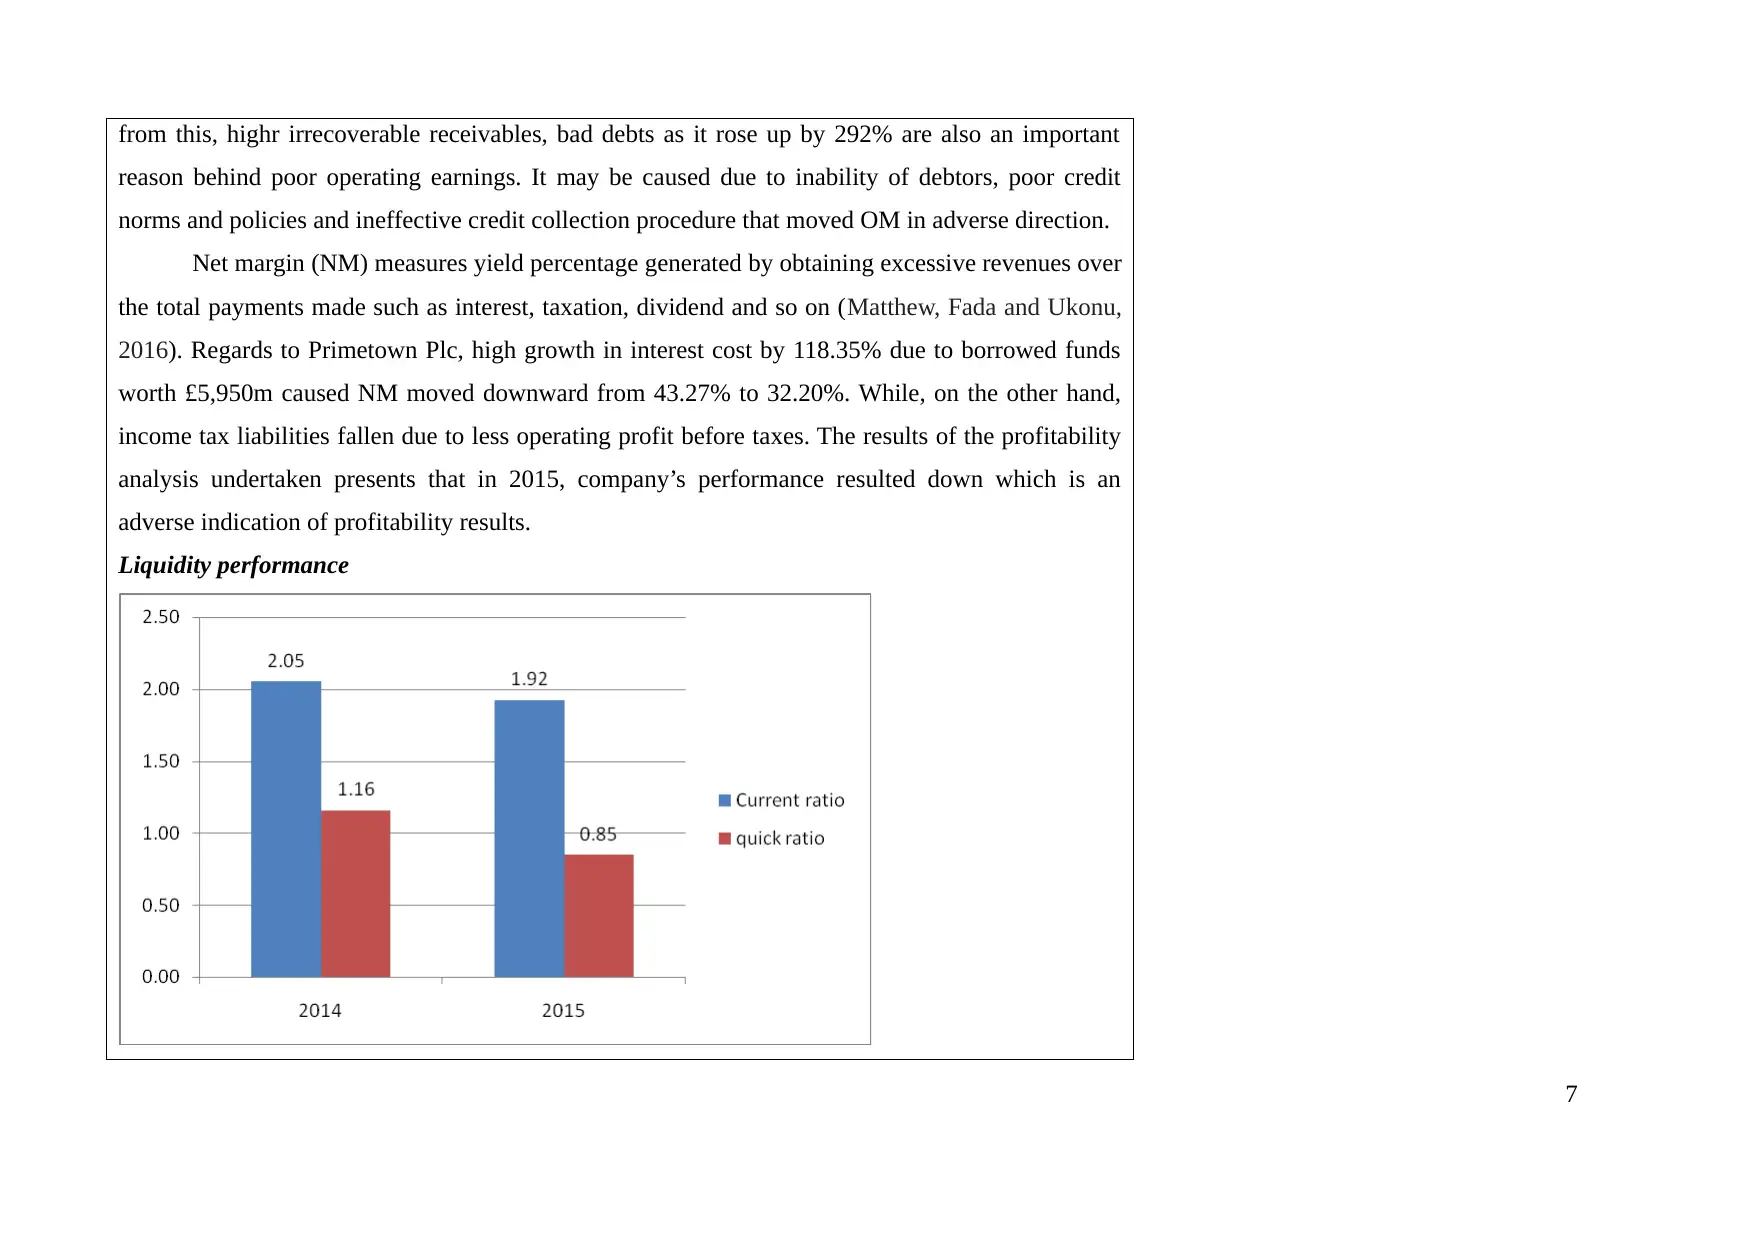
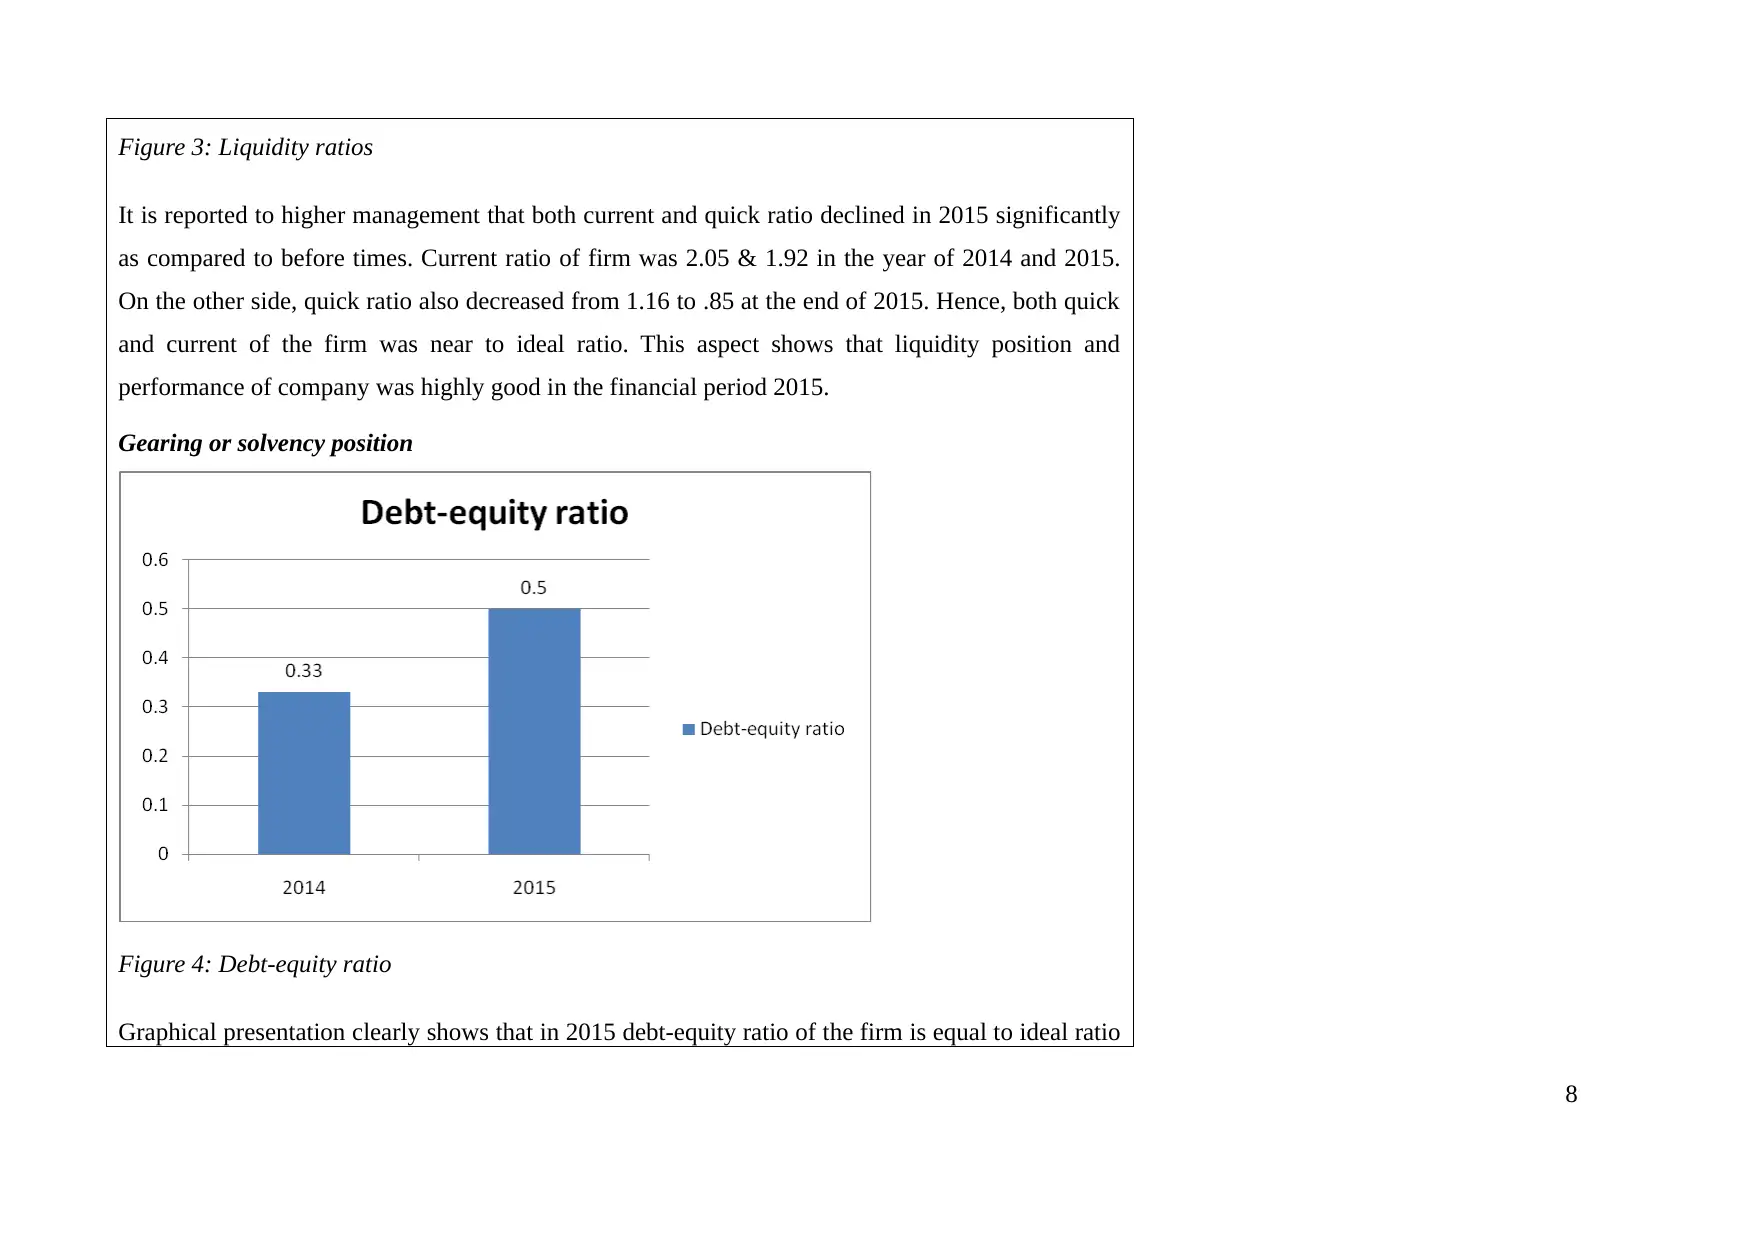
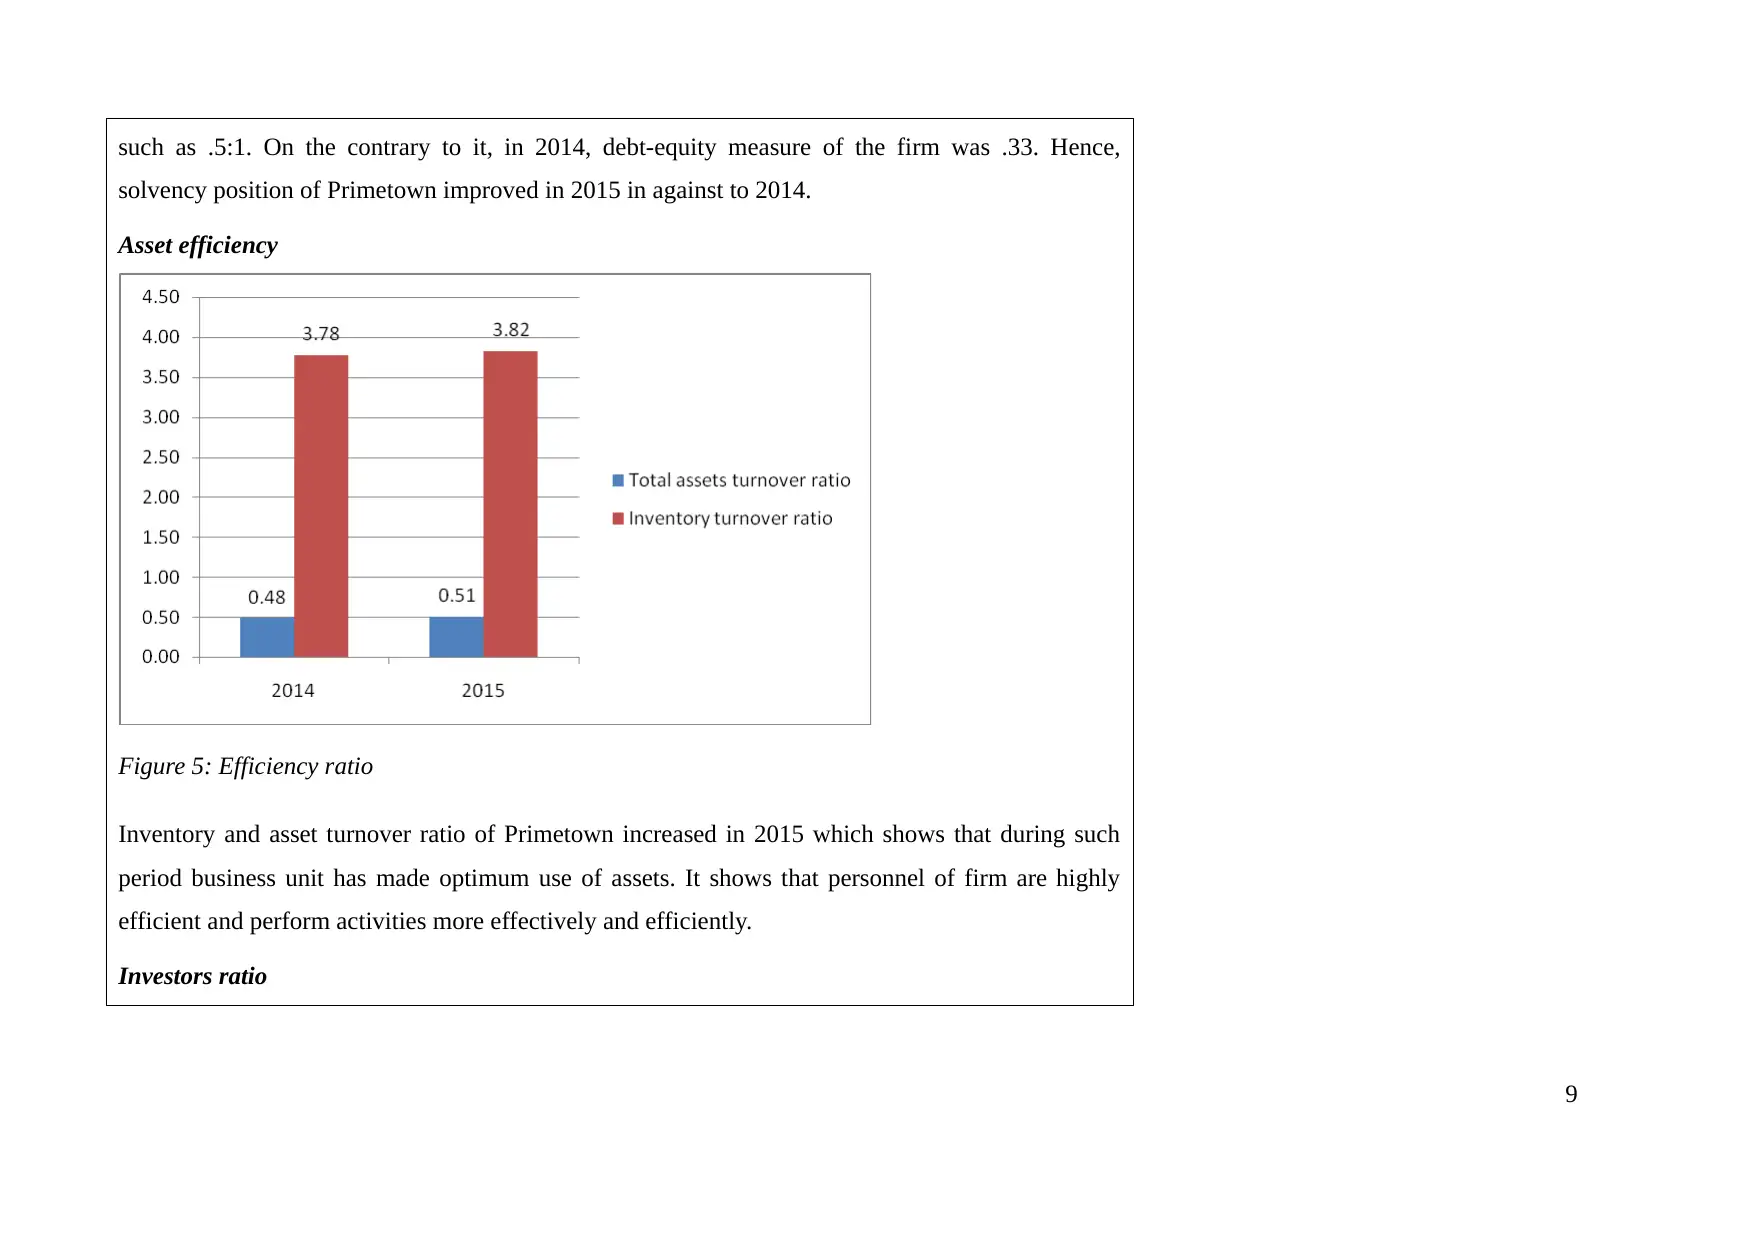
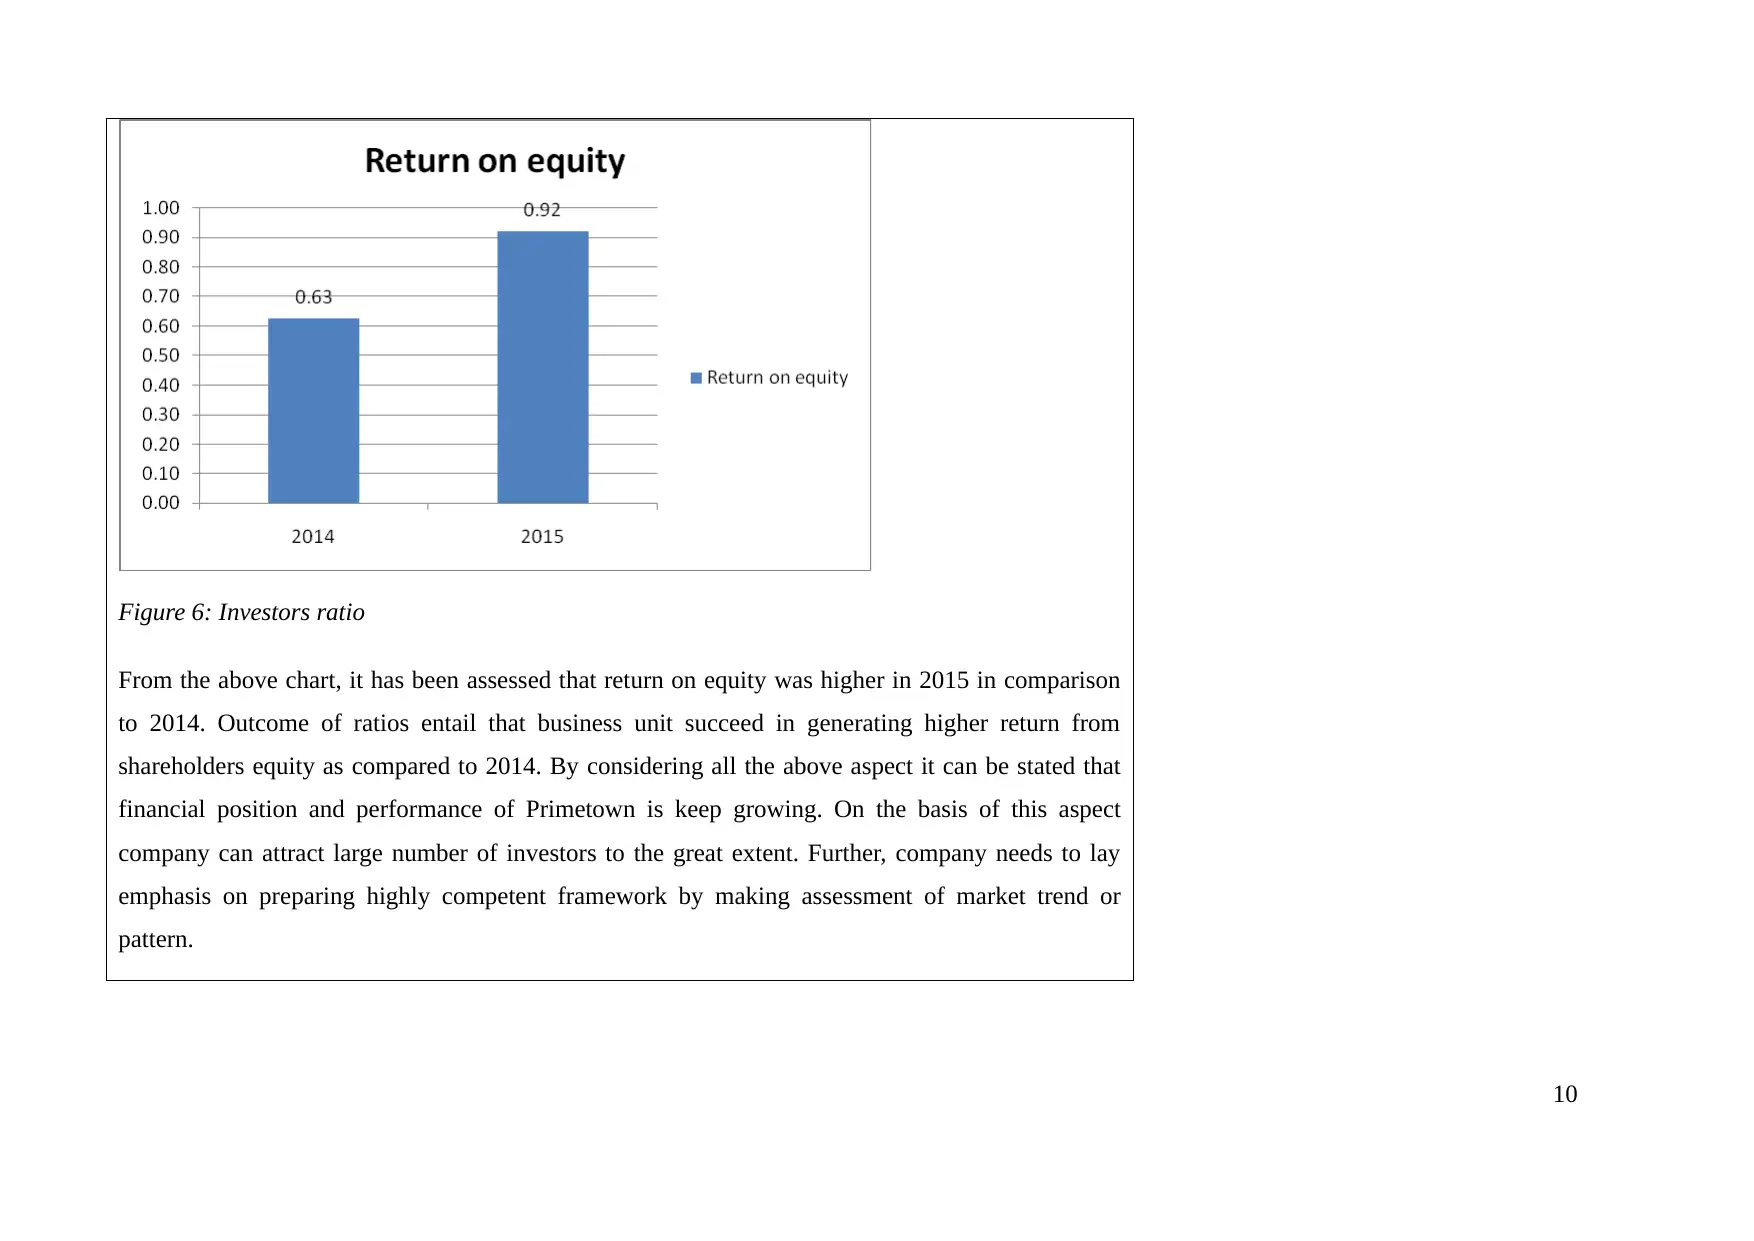
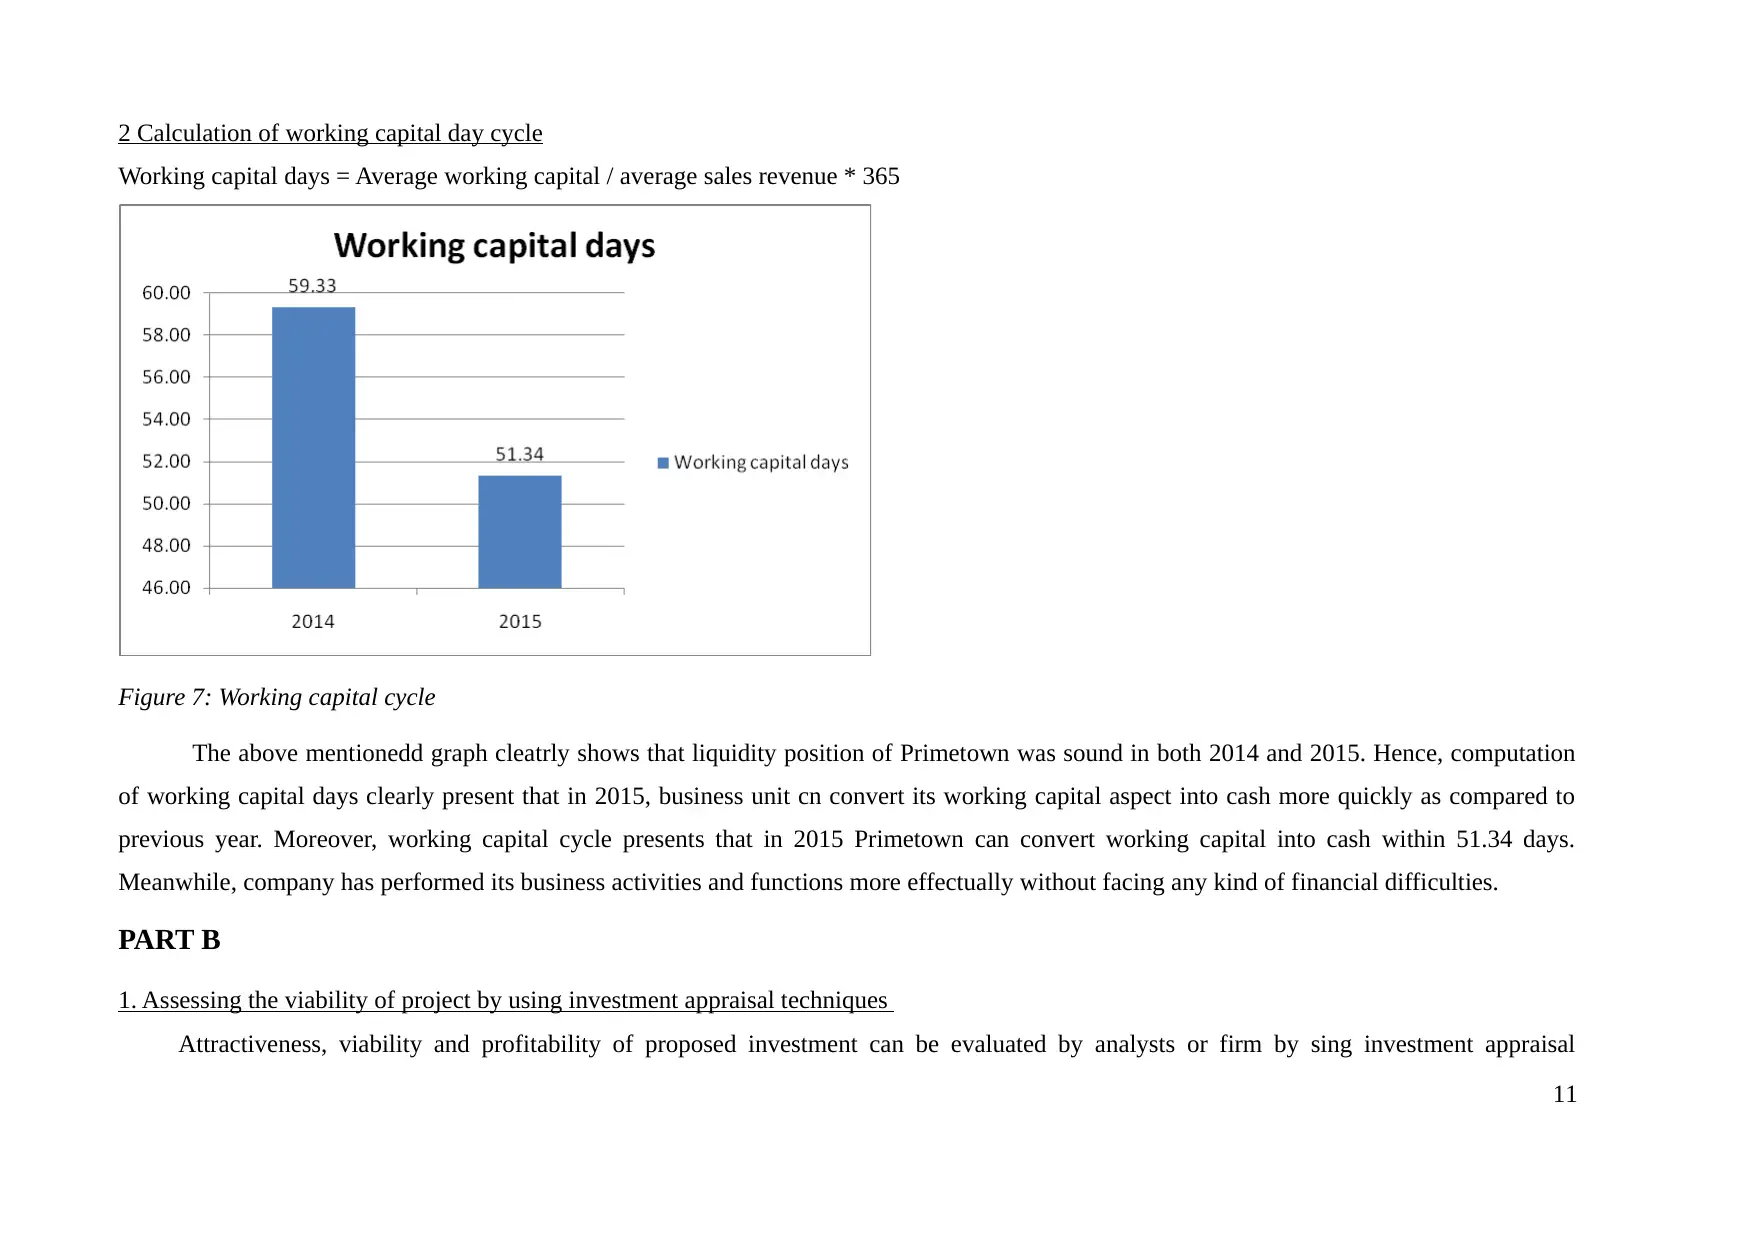
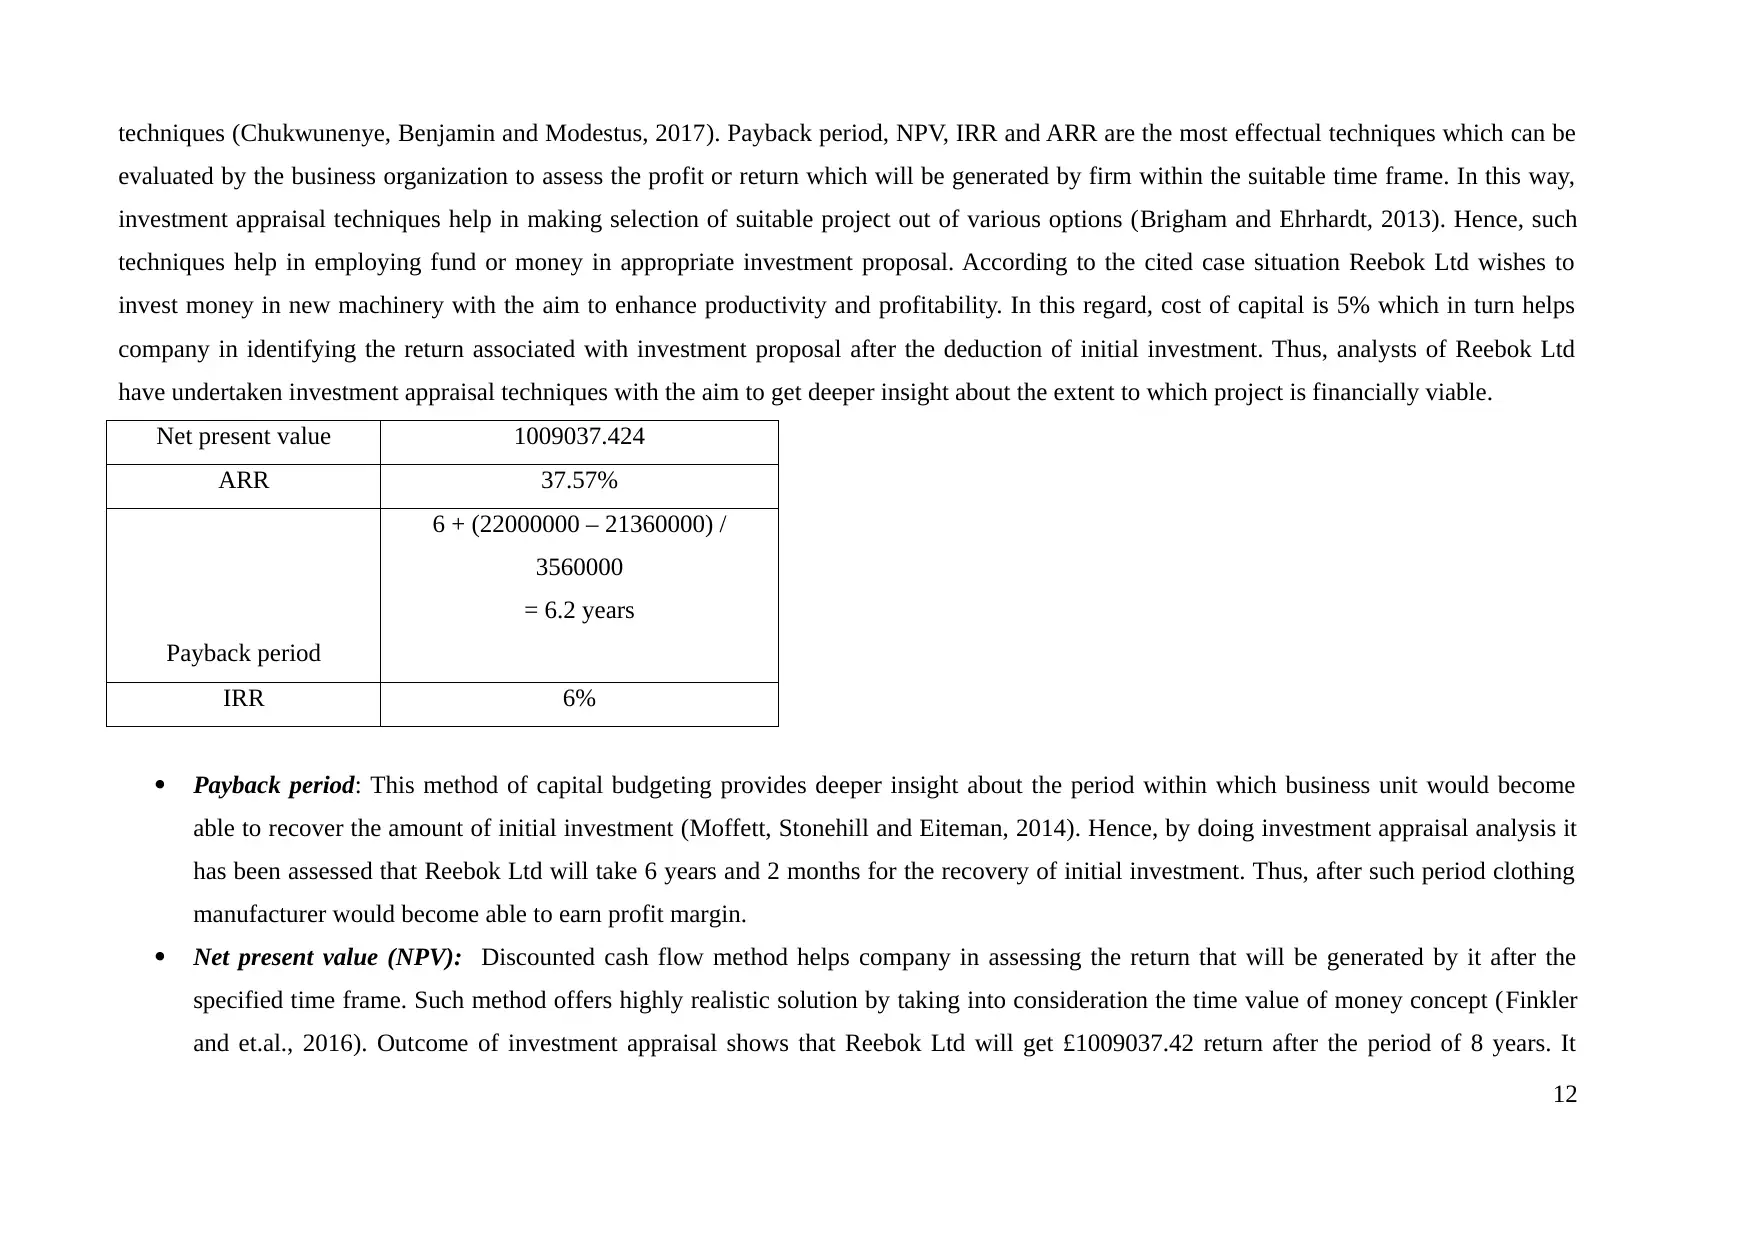
This report provides a comprehensive financial analysis of Primetown Plc, examining its performance from 2014 to 2015. It begins with an introduction to financial management and control, emphasizing the importance of capital for business operations. The report then presents a detailed analysis of Primetown Plc's financial statements using ratio analysis to assess profitability, liquidity, gearing, asset efficiency, and investor ratios. A key component is the calculation and interpretation of the working capital day cycle. Furthermore, the report delves into investment appraisal techniques, evaluating the viability of potential projects using methods such as Payback Period, Net Present Value (NPV), Average Rate of Return (ARR), and Internal Rate of Return (IRR). The merits and limitations of these appraisal techniques are critically assessed. The report also explores the role of budgeting in short-term decision-making and evaluates the practical implications of break-even analysis. The analysis uses figures and tables to support the findings, providing a clear picture of Primetown Plc's financial health and investment opportunities.
tabler-icon-diamond-filled.svg

Contribute Materials

Your contribution can guide someone’s learning journey. Share your documents today.
Document Page
Financial Management and Control
1
tabler-icon-diamond-filled.svg

Secure Best Marks with AI Grader

Need help grading? Try our AI Grader for instant feedback on your assignments.
Document Page
Table of Contents
INTRODUCTION................................................................................................................................4
TASK 1.................................................................................................................................................4
1 Report to the Primetown Plc’s board.............................................................................................4
2 Calculation of working capital day cycle....................................................................................11
PART B...............................................................................................................................................12
1. Assessing the viability of project by using investment appraisal techniques.............................12
2. Evaluating the merits and limitations of investment appraisal techniques.................................15
TASK 3...............................................................................................................................................17
1. Evaluating the manner in which budget helps in making short-term decisions.........................17
2. Critical evaluation and practical implications of break-even analysis (BEA)............................18
CONCLUSION..................................................................................................................................19
REFERENCES...................................................................................................................................21
APPENDIX........................................................................................................................................24
Figure 1: Profit and revenue results..............................................................................................................................................................................5
Figure 2: Profitability ratios..........................................................................................................................................................................................6
Figure 3: Liquidity ratios...............................................................................................................................................................................................8
Figure 4: Debt-equity ratio............................................................................................................................................................................................9
2
Document Page
Figure 5: Efficiency ratio............................................................................................................................................................................................10
Figure 6: Investors ratio..............................................................................................................................................................................................11
Figure 7: Working capital cycle..................................................................................................................................................................................12
3
Document Page
INTRODUCTION
In the current times, each and every business establishments regardless their size and geographical or worldwide presence need required
capital for the smooth functioning and competitive success. Certified Financial Manager (CFO) not only have to gather money but also have to
put restriction and control over its utilization to effectively manage their monetary sources. Thus, the target of this research study is to investigate
and apply various strategic financial analysis tools and methods like ratio analysis and capital budgeting to meet set financial targets. Apart from
this, now-a-days, forecasting or projection also considers as an important facet of financial management and controlling, therefore, the report will
critically analyze the use of budgeting. Despite this, break-even model and investment appraisal techniques covering both discounting and non-
discounting will be critically examined supporting necessarily evidences. It will enable managers to identify the most appropriate method and
apply the same to accept the most beneficial and viable project.
TASK 1
Primetown Plc is a public limited organization that produces top-quality refrigeration equipments exactly as per the user specifications.
Recently, board of directors raised the concern towards business return and creditworthiness, therefore, they wants to analyse the financial
accounts for the recent two years, 2014 and 2015. Ratio analysis is considered as a great method that provides a quick idea about the performance
of the business through quantifying the results in the terms of different ratios.
1 Report to the Primetown Plc’s board
To: Primetown Plc’s board members
From: Financial analyst
Date: 2017, January 17
4
tabler-icon-diamond-filled.svg

Secure Best Marks with AI Grader

Need help grading? Try our AI Grader for instant feedback on your assignments.
Document Page
Subject: Strategic financial performance evaluation for 2014 and 2015
Profitability performance
Profitability ratios quantify profit and loss account results that provide assistance to
measure business ability to generate yield or earnings in comparison to the incurred cost or
expenditures paid (Matthew, Fada and Ukonu, 2016).
Figure 1: Profit and revenue results
Gross margin (GM) expressed the profit (revenue-cost of sale) divided by turnover as a
percentage (Jami and Bahar, 2016). In 2015, Primetown Plc’s GM depicts a downward movement
as it lower down from 61.71% to 53.76%. Less percentage growth in sales at 14.90% whilst
5
Document Page
excessive direct cost as it rose up by 31.91% might be the reasons for decline in GM. Fall in
refrigeration equipment’s price due to intensive competition and less prices of competitors products
may be the reasons for low level of sales, however, shortage of material supply and high labour
charges may caused high increase in COGS and resulted in decreased return (Verma and et.al.,
2016).
Figure 2: Profitability ratios
Operating margin (OM) is typically used to measure operating effectiveness and efficiency
of the business through measuring the residue of revenues left after making payment of operating
expenditures like manufacturing, administrating and selling and distribution cost (Manglik and
Goyal, 2016). Referring Primetown Plc, in 2015, excessive administrative as well as selling and
distribution cost by 94.92% and 26.27% caused decline in OM from 43.27% due to 32.20%. Apart
6
Document Page
from this, highr irrecoverable receivables, bad debts as it rose up by 292% are also an important
reason behind poor operating earnings. It may be caused due to inability of debtors, poor credit
norms and policies and ineffective credit collection procedure that moved OM in adverse direction.
Net margin (NM) measures yield percentage generated by obtaining excessive revenues over
the total payments made such as interest, taxation, dividend and so on (Matthew, Fada and Ukonu,
2016). Regards to Primetown Plc, high growth in interest cost by 118.35% due to borrowed funds
worth £5,950m caused NM moved downward from 43.27% to 32.20%. While, on the other hand,
income tax liabilities fallen due to less operating profit before taxes. The results of the profitability
analysis undertaken presents that in 2015, company’s performance resulted down which is an
adverse indication of profitability results.
Liquidity performance
7
tabler-icon-diamond-filled.svg

Paraphrase This Document

Need a fresh take? Get an instant paraphrase of this document with our AI Paraphraser
Document Page
Figure 3: Liquidity ratios
It is reported to higher management that both current and quick ratio declined in 2015 significantly
as compared to before times. Current ratio of firm was 2.05 & 1.92 in the year of 2014 and 2015.
On the other side, quick ratio also decreased from 1.16 to .85 at the end of 2015. Hence, both quick
and current of the firm was near to ideal ratio. This aspect shows that liquidity position and
performance of company was highly good in the financial period 2015.
Gearing or solvency position
Figure 4: Debt-equity ratio
Graphical presentation clearly shows that in 2015 debt-equity ratio of the firm is equal to ideal ratio
8
Document Page
such as .5:1. On the contrary to it, in 2014, debt-equity measure of the firm was .33. Hence,
solvency position of Primetown improved in 2015 in against to 2014.
Asset efficiency
Figure 5: Efficiency ratio
Inventory and asset turnover ratio of Primetown increased in 2015 which shows that during such
period business unit has made optimum use of assets. It shows that personnel of firm are highly
efficient and perform activities more effectively and efficiently.
Investors ratio
9
Document Page
Figure 6: Investors ratio
From the above chart, it has been assessed that return on equity was higher in 2015 in comparison
to 2014. Outcome of ratios entail that business unit succeed in generating higher return from
shareholders equity as compared to 2014. By considering all the above aspect it can be stated that
financial position and performance of Primetown is keep growing. On the basis of this aspect
company can attract large number of investors to the great extent. Further, company needs to lay
emphasis on preparing highly competent framework by making assessment of market trend or
pattern.
10
tabler-icon-diamond-filled.svg

Secure Best Marks with AI Grader

Need help grading? Try our AI Grader for instant feedback on your assignments.
Document Page
2 Calculation of working capital day cycle
Working capital days = Average working capital / average sales revenue * 365
Figure 7: Working capital cycle
The above mentionedd graph cleatrly shows that liquidity position of Primetown was sound in both 2014 and 2015. Hence, computation
of working capital days clearly present that in 2015, business unit cn convert its working capital aspect into cash more quickly as compared to
previous year. Moreover, working capital cycle presents that in 2015 Primetown can convert working capital into cash within 51.34 days.
Meanwhile, company has performed its business activities and functions more effectually without facing any kind of financial difficulties.
PART B
1. Assessing the viability of project by using investment appraisal techniques
Attractiveness, viability and profitability of proposed investment can be evaluated by analysts or firm by sing investment appraisal
11
Document Page
techniques (Chukwunenye, Benjamin and Modestus, 2017). Payback period, NPV, IRR and ARR are the most effectual techniques which can be
evaluated by the business organization to assess the profit or return which will be generated by firm within the suitable time frame. In this way,
investment appraisal techniques help in making selection of suitable project out of various options (Brigham and Ehrhardt, 2013). Hence, such
techniques help in employing fund or money in appropriate investment proposal. According to the cited case situation Reebok Ltd wishes to
invest money in new machinery with the aim to enhance productivity and profitability. In this regard, cost of capital is 5% which in turn helps
company in identifying the return associated with investment proposal after the deduction of initial investment. Thus, analysts of Reebok Ltd
have undertaken investment appraisal techniques with the aim to get deeper insight about the extent to which project is financially viable.
Net present value 1009037.424
ARR 37.57%
Payback period
6 + (22000000 – 21360000) /
3560000
= 6.2 years
IRR 6%
Payback period: This method of capital budgeting provides deeper insight about the period within which business unit would become
able to recover the amount of initial investment (Moffett, Stonehill and Eiteman, 2014). Hence, by doing investment appraisal analysis it
has been assessed that Reebok Ltd will take 6 years and 2 months for the recovery of initial investment. Thus, after such period clothing
manufacturer would become able to earn profit margin.
Net present value (NPV): Discounted cash flow method helps company in assessing the return that will be generated by it after the
specified time frame. Such method offers highly realistic solution by taking into consideration the time value of money concept (Finkler
and et.al., 2016). Outcome of investment appraisal shows that Reebok Ltd will get £1009037.42 return after the period of 8 years. It
12
Document Page
presents that after the recovery of initial investment company will generate higher return. This aspect shows that by investing money in
new machinery Reebok Ltd can maximize both productivity and profit margin (Li and Trutnevyte, 2017).
Average rate of return (ARR): This investment appraisal method implies the average return that will be earned by Reebok Ltd from
proposal. ARR of machinery investment proposal is 37.57% which is neither too high nor too lower. By considering this, it can be said
that such investment will help in getting enough return.
Internal rate of return (IRR): By using such method business organization can get information about return in the percentage form.
Hence, this method helps in determining output through the means of time value of money concept (McKinney, 2015). The above table
shows that Reebok Ltd will get 6% return from investment proposal. Thus, IRR of investment proposal is lower than standard limit which
is not a good indicator. Thus, company needs to make focus on finding other projects which offer high return to them.
Recommendation: By taking into consideration all the above mentioned aspects it can be said that Reebok Ltd should invest money in fixed
assets such as machinery. Thus, by manufacturing and offering highly designer clothes company can enhances its sales revenue and profit
margin. In this way, proposed proposal will make contribution in the attainment of organizational goals and objectives.
2. Evaluating the merits and limitations of investment appraisal techniques
Payback period
Merits: Simplicity is one of the main benefits that help investors or business organization in making comparison of different projects. In
the recent times, earning high amount of profit is one of the main objectives of company by recovering the amount of initial investment as
quickly as possible (Eliasson and Börjesson, 2014). In this situation, payback period helps company in identifying the period within which it
become able to recover the amount of initial investment (Abanis and et.al., 2013). By conducting such analysis business organization can take
decision whether they need to invest money in investment or not.
Drawbacks: Payback method completely ignores time value of money concept which has high level of importance in the dynamic
business environment. Further, it does not serve information about return or cash inflow that business unit will attain after the specific time
frame. This aspect closely influences the significance of such method (Payback period, 2017). Moreover, profit or cash flow is the significant
13
tabler-icon-diamond-filled.svg

Paraphrase This Document

Need a fresh take? Get an instant paraphrase of this document with our AI Paraphraser
Document Page
aspect that is considered by company for decision making.
Net present value
Advantages: NPV method helps analysts and company in making assessment of future value through the means of time value of money
concept. Moreover, value of an investment will not be the same as it is today due to fluctuations take place in economy, market trend and other
factors. In this, by taking into account such method business unit can assess the profit that will be generated by it over the initial investment.
Thus, such method helps company in determining that proposed investment will make value addition in money or not (Togashi and et.al., 2015).
Further, it also helps in assessing and evaluating the inherent to the great extent. This in turn facilitates better projection and thereby helps in
making profitable business decisions.
Disadvantages: This method is highly based on guesswork which is one of the major drawbacks of NPV. Moreover, to determine the final
outcome business unit is required to estimate suitable cost of capital. The reason behind this when analysts consider too low cost of capital then it
may result into suboptimal investment (Advantages and Disadvantages of the Net Present Value Method, 2017). On the other side, high cost of
capital also negatively influences the decision making aspects. Besides this, NPV tool is not highly suitable for projects which vary according to
size. In this way, it creates difficulty in evacuating the proposals and making appropriate decisions.
Internal rate of return
Advantages: In this, cash flow of each year is evaluated by the firm on the basis of discounting factor. Thus, it follows time value of
money concept to the significant level. Hence, it provides investors or company with a snapshot that clearly entails whether capital project will
offer suitable cash flow or not (Tsai and et.al., 2016). By keeping in mind the outcome of IRR business unit can take decision either they need to
purchase new equipment or repairing the old one. It shows that IRR technique of investment appraisal helps in making decisions.
Disadvantages: With the help of such method company cannot make effective comparison of two different projects whose initial outlay is
highly differs from each other. Thus, IRR method highly influences the importance of outcome that is determined through IRR (Advantages and
Disadvantages of IRR, 2017). Further, in this, analysts have to assess two cost of capital for generating the outcome. In this, if business unit
failed to identify suitable present value factor then it may result into unrealistic decision making framework.
14
Document Page
Average rate of return
Advantages: Analysts can calculate ARR without facing high level of difficulties. This aspect encourages investor or firm to undertake such
method and thereby takes decision (Sugimoto and et.al., 2015). Along with this, by using such method investors can assess and get information
about average rate of return.
Disadvantages: Ignorance of time value of money concept is the major limitation of such method. In addition to this, it undertakes profit
factor rather than cash flows (Baum and Crosby, 2014). It is also not possible that ARR will similar during the whole life of project. Thus, all
these aspects have major impact on the growth and profitability aspect of firm in a positive manner.
TASK 3
1. Evaluating the manner in which budget helps in making short-term decisions
In an organization, managers not only have to create and design plan and set policies, but also, have to make projection about future. A
budget is a summarized statement that forecast or predicts income and expenditures for a particular time period. It helps to determine net balance
whether surplus or deficit. Surplus is a sign that indicates that revenues will exceed expenditures, whilst, deficit or shortfall shows company will
make overspending in future. According to Rubin (2016), financial managers prepare their monetary plan through constructing budget and use it
as a short-term decision-making device. It is because, with the help of this, managers can forecast their potential incoming and outgoing and
ascertain net results that whether they will have sufficient fund or may face difficulties due to shortage. Such projection will enable business to
make policies and decisions for the optimum allocation of resources in various business functions such as marketing, advertisement &
production, which in turn, helps to maintain adequate cash resources at every point of time.
Likewise, in the opinion of Hope and Fraser (2013), it has been stated that budgeting is of great significance for the organization to create an
excellent spending plan and ensure cash surplus to overcome monetary risk may incur due to market volatility and dynamic environment. In the
practical corporate world, managers make a projection to estimate the results of future course of action through budgetary tool. If the net result
15
Document Page
indicates deficit balance, then policymakers can make plans and strategic decisions to curtail overspending, eliminate wastage and encourage
saving also.
However, it has been critically argued by Sehgal (2017), on the basis, that budget are just the estimates hence, it cannot be assured that
actual results will be exact to the set targets revenue or spending. More importantly, in the dynamic and changing corporate world where
market, it cannot be used as a planning and controlling device mainly due to its inflexibility and inaccurate estimation. Apart from this, Rauf
(2017), commented that the reliability of the budgeted result depends upon the type of budgeting technique such as incremental and zero-
based. ZBB is considered more appropriate, but still, required huge effort, time and cost of the organization. Furthermore, drastic and sudden
change in the external market forces does not enable managers to adjust their budgeted plan accordingly and limits the objective of
managers.
Despite this, in the study of Bogsnes (2016), it has been assessed that consistent monitoring of the actual performance through defined
targets enables executives to put restrictions and control over personnel to minimize excessive spending and ensure effective and optimum
utilization of funds in the establishment. Thus, it can be said that budgetary tool allows managers to keep control over financing functions to
reduce wasteful and unnecessary spending for maintaining enough balance. Further, after the completion of budgetary period, they can
examine and evaluate the actual results through comparison with the targets to determine variances whether favourable or unfavourable, so
that, smarter decisions can be made for the getting desired output.
2. Critical evaluation and practical implications of break-even analysis (BEA)
In the marginal costing, break-even model is greatly used by the entrepreneurs to ascertain the level of sales and units which equates both
the income and incurred payment, hence, indicates neither any return nor loss. As per the views of Zhao and Yuan (2016) it is important for the
establishments to determine the point of optimum resource utilization, it can be known through measuring BEP point. With this, managers and
policy makers can make policies and smarter choice to generate sales at-least to the BEP, so that, business resources can be utilized maximum.
Exceeding the sales volume and value beyond such point encourage and drive favourable return to the business, however, sales below BEP
16
tabler-icon-diamond-filled.svg

Secure Best Marks with AI Grader

Need help grading? Try our AI Grader for instant feedback on your assignments.
Document Page
indicates loss.
De Laporte, Weersink and McKenney (2014) commented that the model although this model was extensively used by the companies,
however, with the changing period of drastic and sudden movement, the importance and practical uses of the model dropped down. It only
happens because of its invalid and unreliable assumptions such as segregation of total cost between fixed and variable cost, fixed variable cost
each unit and others. In the present times, prices took changes very frequently and rapidly. Thus, the assumption of the model proves untrue and
not in line with the actual market conditions.
Furthermore, Xu and Yuan (2015) argued that companies can estimate and forecast their cost accurately, whereas, it is not right because
now-a-days, extreme volatility in the external environment makes it too difficult for the organizations to predict their cost accurately, hence, it
may goes upward or downward as per the changing conditions. Unlike this, Morgan and et.al., (2015) favoured the model by explaining that yet
the model has several drawbacks, but still, it is widely and extensively used by corporations operating in distinctive industries. Thus, the practical
application and importance of the model cannot be ignored. Companies uses break-even analysis for different purpose, such as determining the
sales level to generate target or desired yield, analysis of safety margin and so on. With the help of this costing method, managers, executives and
other policy makers frame set of policies, strategies and decisions to quickly and promptly reach at the point of maximum capacity utilization.
Achieving BEP earlier assist firms to obtain favourable return in the terms of profit and achieve long-run stability and growth targets.
Despite this, in the study of Huang and Chan (2014) it has been assessed that BEP only analyses cost and tells nothing to the business
about what revenues they can generated through selling their products and services at distinctive prices. Moreover, it relies that firms does not
change their prices by keeping into considering a constant charges. However, over the years, this assumption seems unrealistic, because, now-a-
days, pricing mechanism is used by the organization as a way to gain competitive success through audience traffic. Apart from this, ……….
Criticized the technique by arguing that BEP assumes that fixed cost remains constant, however, it is also not true because, no-doubt fixed
expenditures are regardless the production output, but still, it changes with the time duration hence may be increase in future period. Considering
the results, it can be said that now-a-days, the practical application and importance of BEP model has been decreased.
17
Document Page
CONCLUSION
From the above report, it has been concluded that profitability position of Primetown Plc was not sound in the period of 2015. Moreover,
both gross and net profitability aspect of the firm decreased in 2015 as compared to before years. Thus, Board of Directors needs to make
competent strategic and policy framework which in turn makes high level of control on expenses. In this way, by reducing the level of direct and
indirect expenses business unit improve its financial position and performance. Besides this, it can be revealed from the report that Reebok Ltd
should select proposed investment proposal which in turn helps company in achieving success to the large extent. Further, it can be inferred that
business unit can increase its capacity in relation to producing sportswear and thereby become able to increase profit margin. In addition to this, it
has been articulated that by using budgeting tools and techniques business unit can make optimum use of financial resources.
18
Document Page
REFERENCES
Books and Journals
Abanis, T. and et.al., 2013. Financial Management Practices In Small And Medium Enterprises in Selected Districts In Western
Uganda. Financial Management. 4(2).
Baum, A.E. and Crosby, N., 2014. Property investment appraisal. John Wiley & Sons.
Bogsnes, B., 2016. Implementing beyond budgeting: unlocking the performance potential. John Wiley & Sons.
Brigham, E. F. and Ehrhardt, M. C., 2013. Financial management: Theory & practice. Cengage Learning.
Chukwunenye, O., Benjamin, E. and Modestus, O., 2017. Engineering an Investment; A Financial Approach to Engineering
Businesses. International journal of scientific research in information systems and engineering. 1(2).
De Laporte, A. V., Weersink, A. J. and McKenney, D. W., 2014. A spatial model of climate change effects on yields and breakeven prices of
switchgrass and miscanthus in Ontario, Canada. Gcb Bioenergy. 6(4). pp. 390-400.
Eliasson, J. and Börjesson, M., 2014. On timetable assumptions in railway investment appraisal. Transport Policy. 36. pp.118-126.
Finkler, S.A. and et.al., 2016. Financial management for public, health, and not-for-profit organizations. CQ Press.
Hope, J. and Fraser, R., 2013. Beyond budgeting: how managers can break free from the annual performance trap. Harvard Business Press.
Huang, Y. C. and Chan, S. H., 2014. The house money and break-even effects for different types of traders: Evidence from Taiwan futures
markets. Pacific-Basin Finance Journal. 26(3). pp. 1-13.
Jami, M. and Bahar, M. N., 2016. Analysis of Profitability Ratios to Evaluation of Performance of Indian Automobile Industry. Journal of
Current Research in Science. 1(1). pp. 747-769.
Li, F. G. and Trutnevyte, E., 2017. Investment appraisal of cost-optimal and near-optimal pathways for the UK electricity sector transition to
2050. Applied Energy. 189. pp.89-109.
Manglik, M. and Goyal, A., 2016. Operating Margin Ratio (A Comparative Study of Selected Public and Private Sector Companies). PARIPEX-
Indian Journal of Research. 5(5). pp. 12-75.
19
tabler-icon-diamond-filled.svg

Paraphrase This Document

Need a fresh take? Get an instant paraphrase of this document with our AI Paraphraser
Document Page
Matthew, D. A. A., Fada, A. and Ukonu, I. C., 2016. ROLE OF FINANCIAL RATIO ANALYSIS IN ASSESSING BUSINESS
PERFORMANCE IN THE HOSPITALITY AND TOURISM OPERATIONS. Development. 4(4). pp. 15-63.
McKinney, J. B., 2015. Effective financial management in public and nonprofit agencies. ABC-CLIO.
Moffett, M. H., Stonehill, A. I. and Eiteman, D. K., 2014. Fundamentals of multinational finance. Pearson.
Morgan, R. O. and et.al., 2015. A break-even analysis for dementia care collaboration: Partners in Dementia Care. Journal of general internal
medicine. 30(6). pp. 804-809.
Rauf, T., 2017. Funding and Budgeting. Academic Librarianship Today. 3(1).pp. 47-59.
Rubin, I. S., 2016. The politics of public budgeting: Getting and spending, borrowing and balancing. CQ Press.
Sehgal, J. K., 2017. Zero-Based Budgeting. PARIPEX-Indian Journal of Research. 5(10). pp. 16-34.
Sugimoto, K. and et.al., 2015. Proposal of new classification for stage III colon cancer based on the lymph node ratio: analysis of 4,172 patients
from multi-institutional database in Japan. Annals of surgical oncology. 22(2). pp.528-534.
Togashi, H. F. and et.al., 2015. Morphological and moisture availability controls of the leaf areatosapwood area ratio: analysis of measurements
on Australian trees. Ecology and evolution. 5(6). pp.1263-1270.
Tsai, J. and et.al., 2016. Lymph node ratio analysis after neoadjuvant chemotherapy is prognostic in hormone receptor-positive and triple-
negative breast cancer.Annals of Surgical Oncology. 23(10). pp.3310-3316.
Verma, S., and et.al., 2016. A GrossMargin Model for Defining Technoeconomic Benchmarks in the Electroreduction of CO2. ChemSusChem.
9(15). pp.1972-1979.
Xu, C. and Yuan, S., 2015. An analogue of break-even concentration in a simple stochastic chemostat model. Applied Mathematics Letters. 48.
pp. 62-68.
Zhao, D. and Yuan, S., 2016. Critical result on the break-even concentration in a single-species stochastic chemostat model. Journal of
Mathematical Analysis and Applications. 434(2). pp. 1336-1345.
Online
20
Document Page
Advantages and Disadvantages of IRR. 2017. Online. Available through: < http://smallbusiness.chron.com/advantages-disadvantages-internal-
rate-return-method-60935.html>. [Accessed on 21th January 2017].
Advantages and Disadvantages of the Net Present Value Method. 2017. Online. Available through: < advantages-and-disadvantages-of-net-
present-value>. [Accessed on 21th January 2017].
Payback period. 2017. Online. Available through: < http://smallbusiness.chron.com/advantages-disadvantages-payback-capital-budgeting-
method-14206.html>. [Accessed on 21th January 2017].
21
Document Page
APPENDIX
1.1 Ratio analysis
Profitability ratios
Liquidity ratio
Particulars 2014 2015
Current assets 5795 7070
Inventory 2520 3950
Current liabilities 2825 3680
Current ratio 2.05 1.92
quick ratio 1.16 0.85
Gearing ratio
Particulars 2014 2015
Debt 14650 8700
22
tabler-icon-diamond-filled.svg

Secure Best Marks with AI Grader

Need help grading? Try our AI Grader for instant feedback on your assignments.
Document Page
Shareholders
equity 29165 26160
Debt-equity ratio 0.33 0.5
Asset utilization
Particulars 2014 2015
Net sales 18270 24100
cost of sales 9515 15095
total assets 37685 47495
Inventory 2520 3950
Total assets turnover
ratio 0.48 0.51
Inventory turnover ratio 3.78 3.82
Investor’s potential
Particulars 2014 2015
Net sales 18270 24100
Sharehoders equity 29165 26160
Return on equity 0.63 0.92
1.2 Working capital cycle
Particulars 2014 2015
Current assets 5795 7070
Current liabilities 2825 3680
working capital 2970 3390
Sales revenue 18270 24100
Working capital days 59.33 51.34
23
Document Page
2.1 capital budgeting
Computation of cash inflow
Year Cash inflow Cash outflow Depreciation Profit before tax Tax profit after tax Annual cash inflow
1 6500000 2475000 2475000 1550000 465000 1085000 3560000
2 6500000 2475000 2475000 1550000 465000 1085000 3560000
3 6500000 2475000 2475000 1550000 465000 1085000 3560000
4 6500000 2475000 2475000 1550000 465000 1085000 3560000
5 6500000 2475000 2475000 1550000 465000 1085000 3560000
6 6500000 2475000 2475000 1550000 465000 1085000 3560000
7 6500000 2475000 2475000 1550000 465000 1085000 3560000
8 6500000 2475000 2475000 1550000 465000 1085000 3560000
Calculation of payback period, NPV, ARR and IRR
Year Annual cash inflow
Cumulative cash
inflow PV factor @ 5%
Discounted cash
inflow
1 3560000 3560000 0.95 3390476.19
2 3560000 7120000 0.91 3229024.943
3 3560000 10680000 0.86 3075261.851
4 3560000 14240000 0.82 2928820.81
5 3560000 17800000 0.78 2789353.153
24
Document Page
6 3560000 21360000 0.75 2656526.812
7 3560000 24920000 0.71 2530025.535
8 3560000 28480000 0.68 2409548.129
Total discounted cash inflow 23009037.42
Initial investment 22000000
Net present value 1009037.424
ARR 37.57%
IRR 6%
25
chevron_up_icon
1 out of 25
circle_padding
hide_on_mobile
zoom_out_icon
logo.png

Your All-in-One AI-Powered Toolkit for Academic Success.

Available 24*7 on WhatsApp / Email

[object Object]