Financial Performance and Ratio Analysis of Rangemaster Plc Report

Verified

Added on  2023/01/09

|9
|714
|27
Report
AI Summary
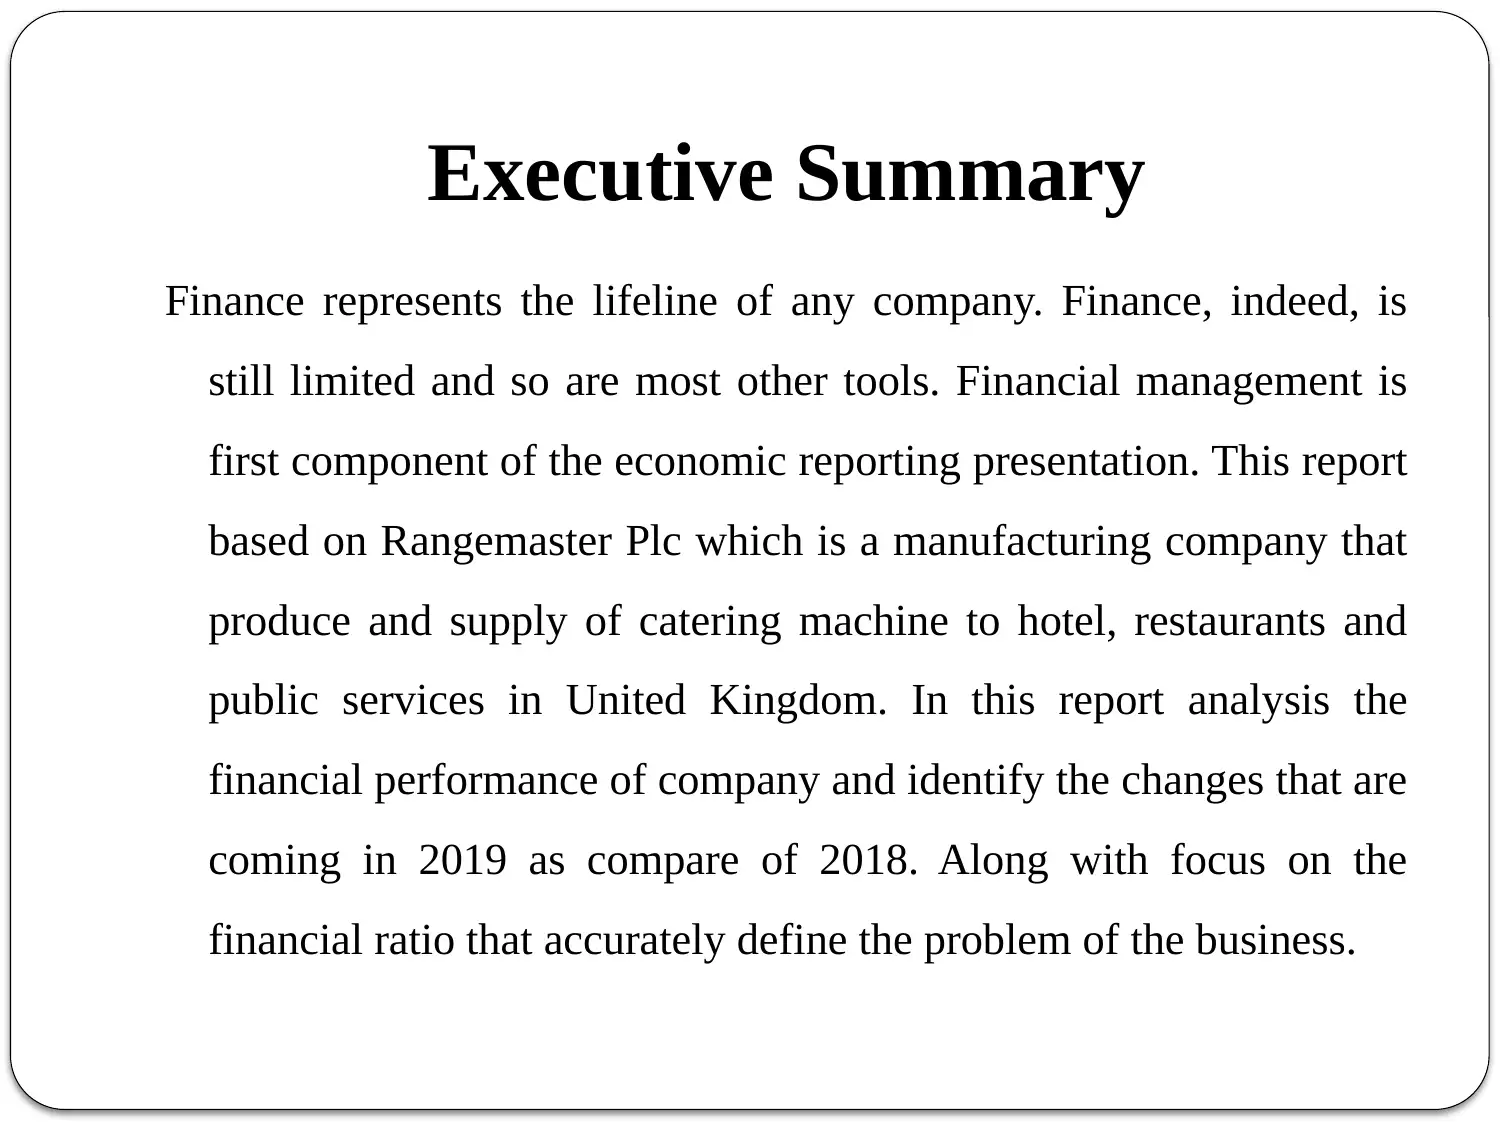
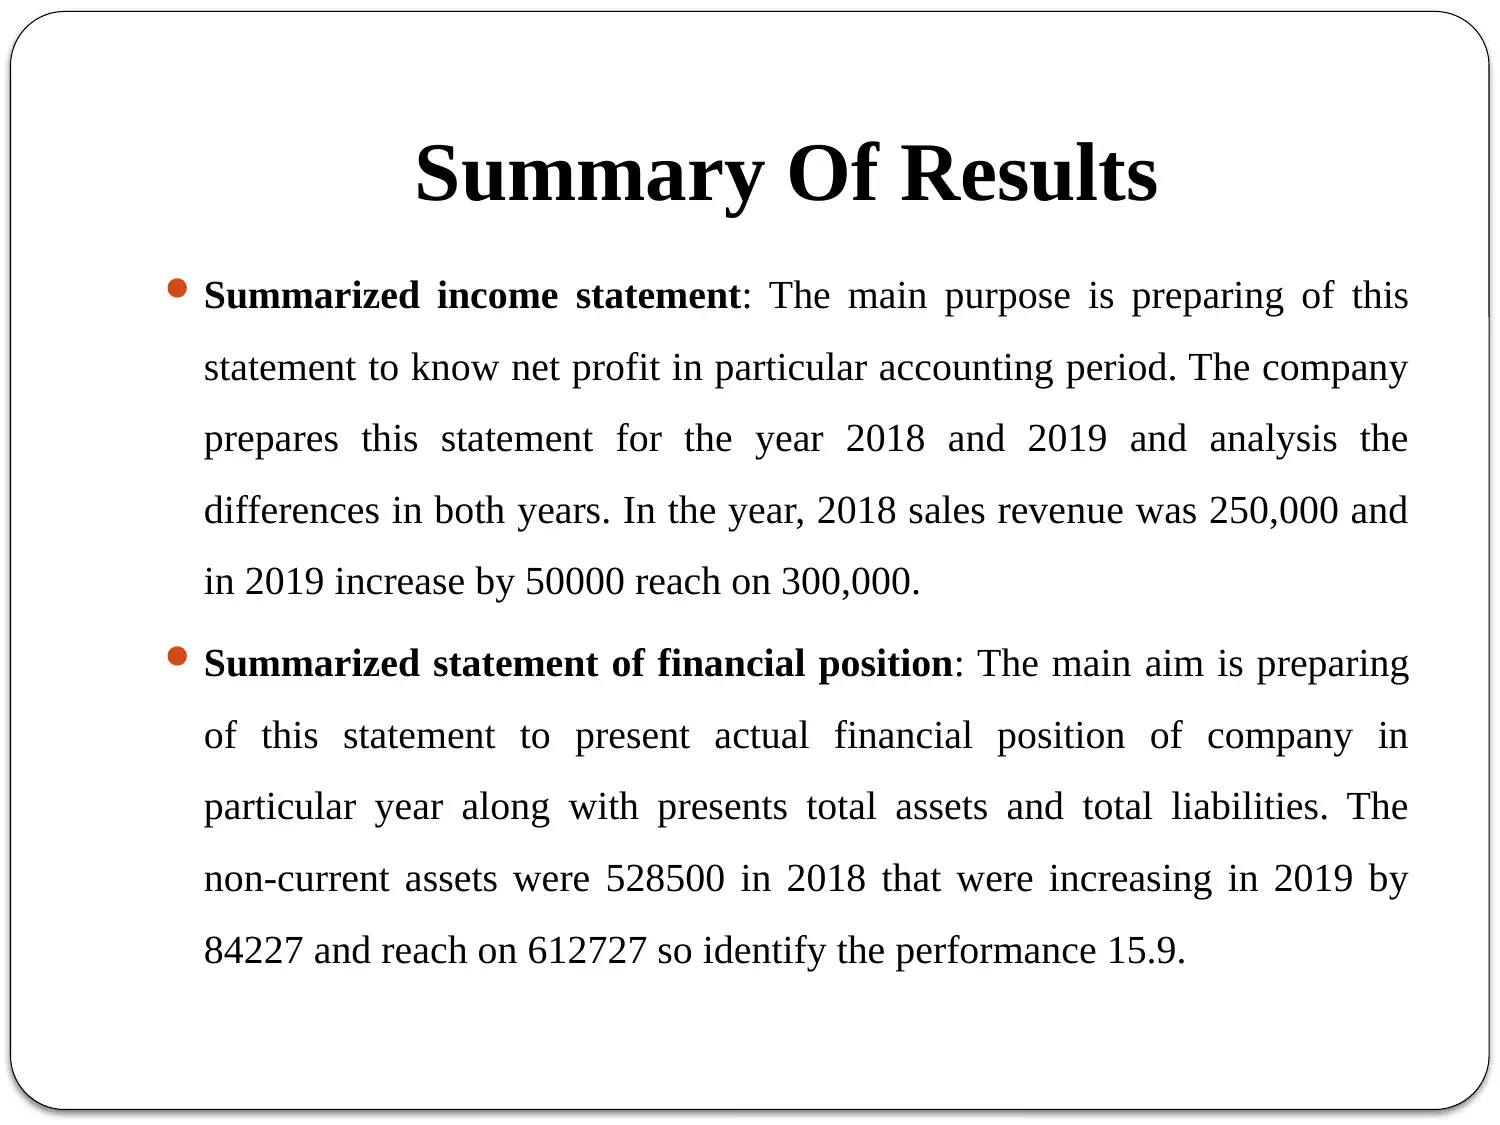
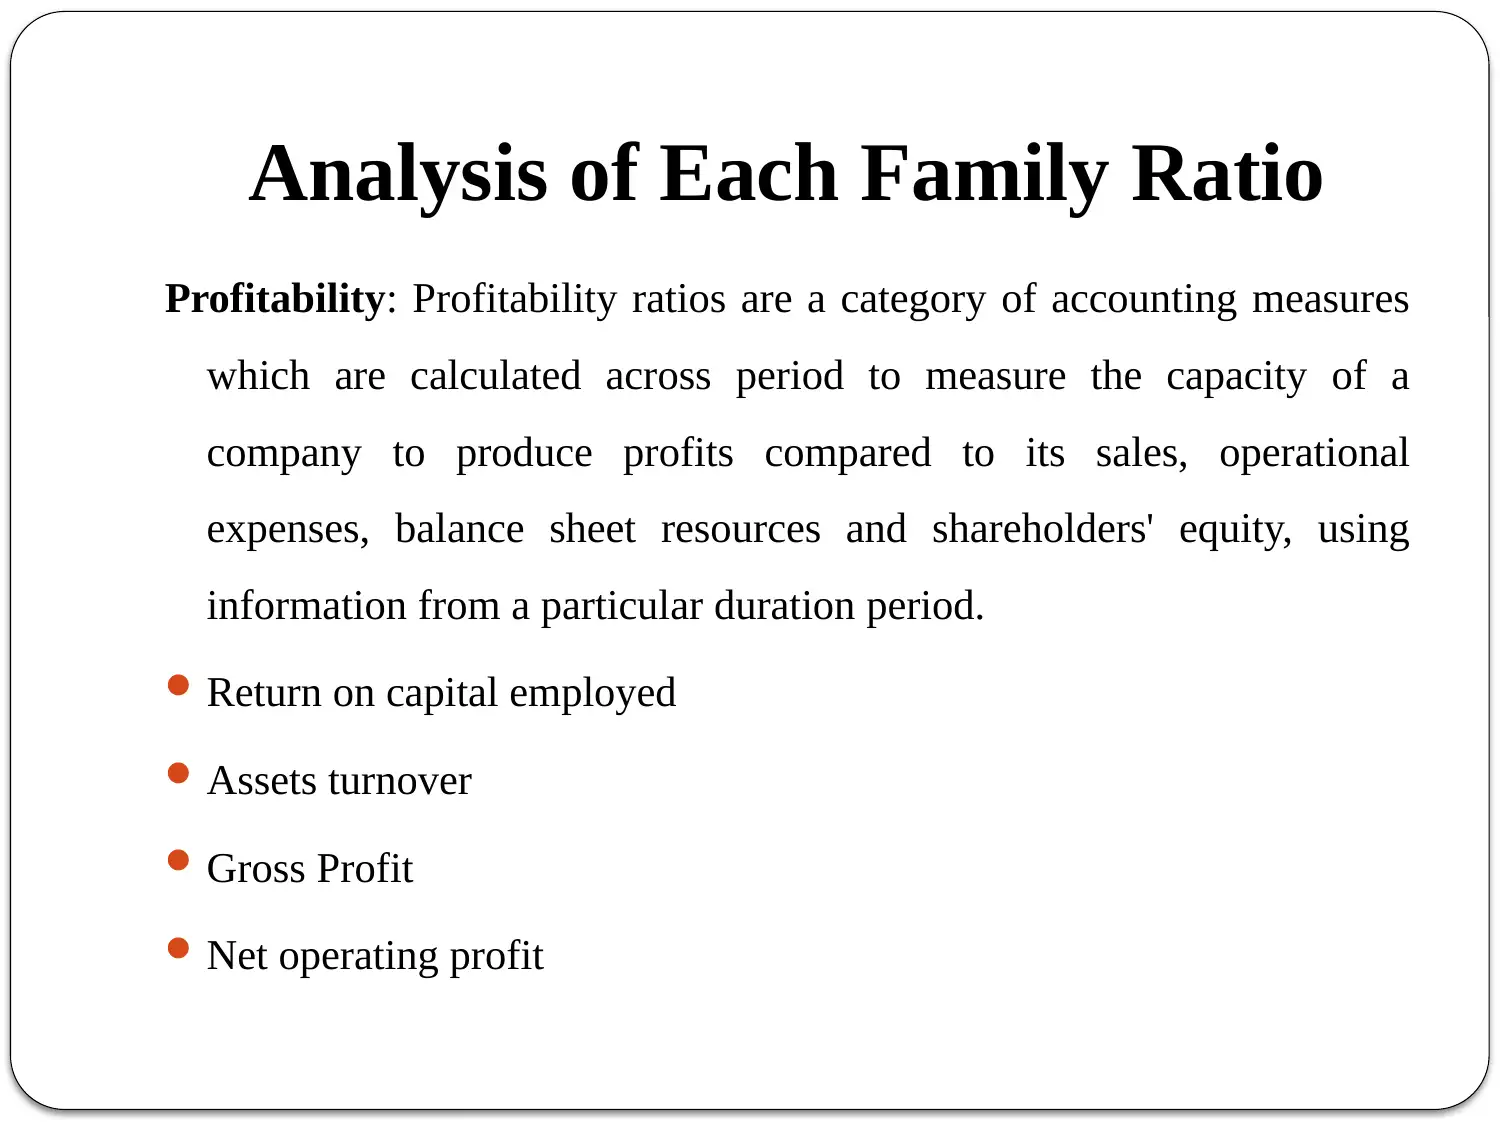
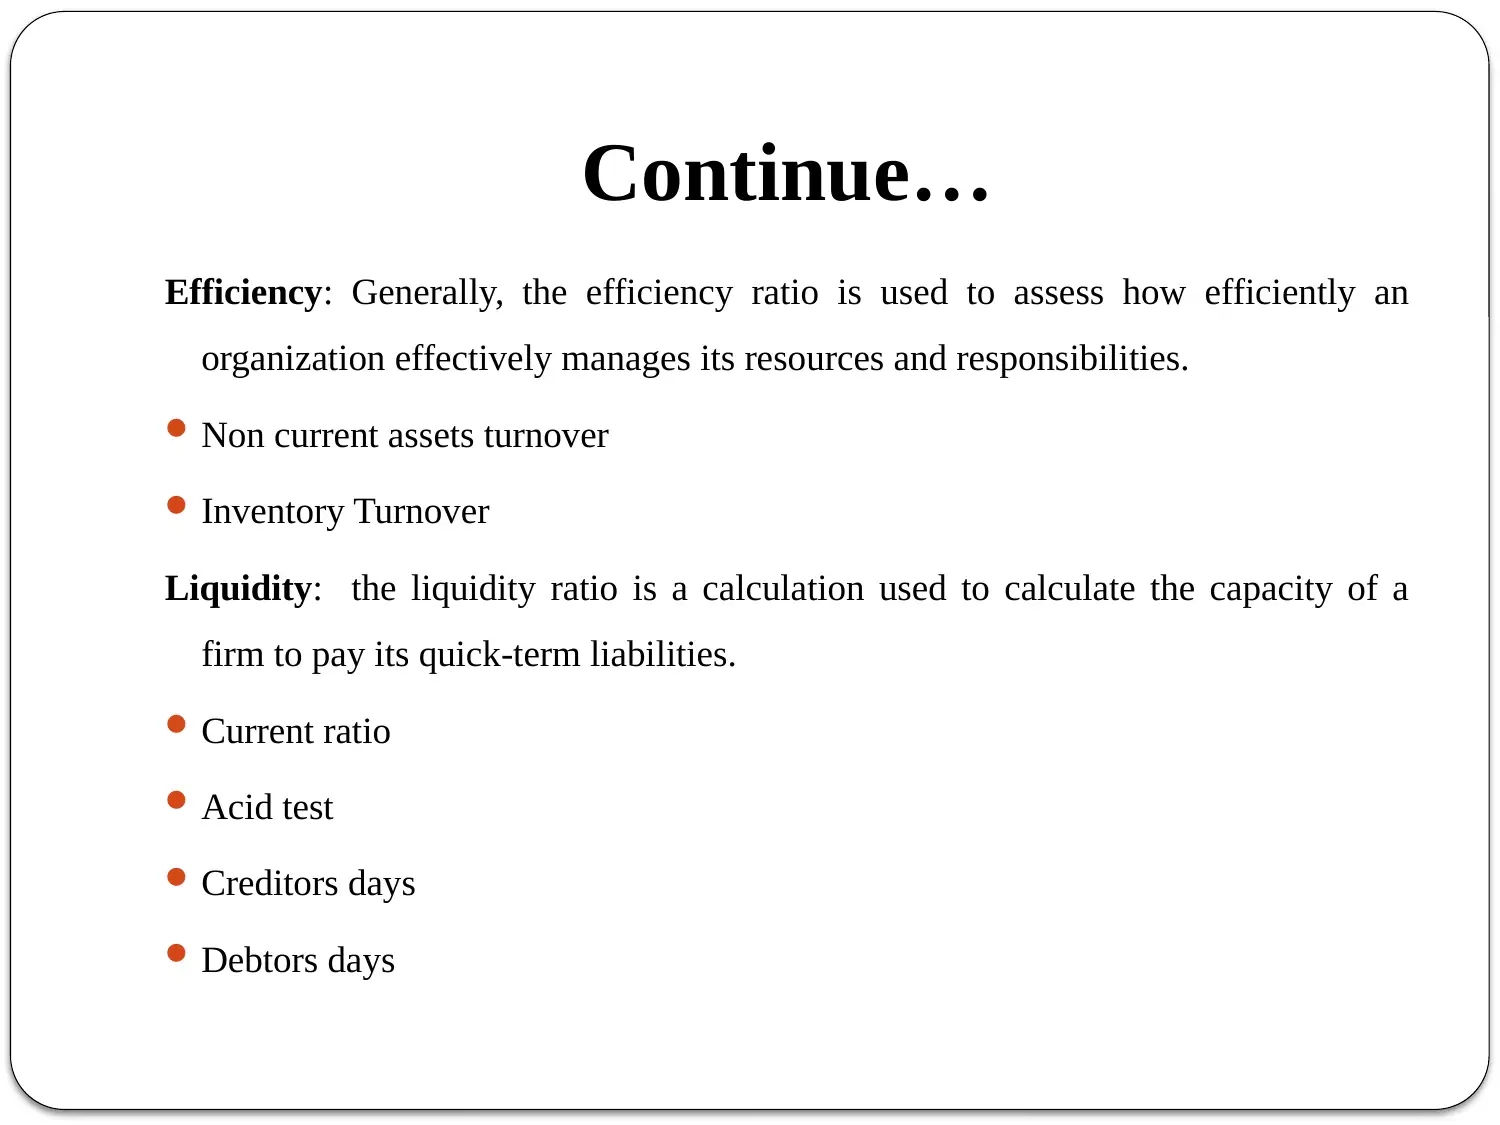
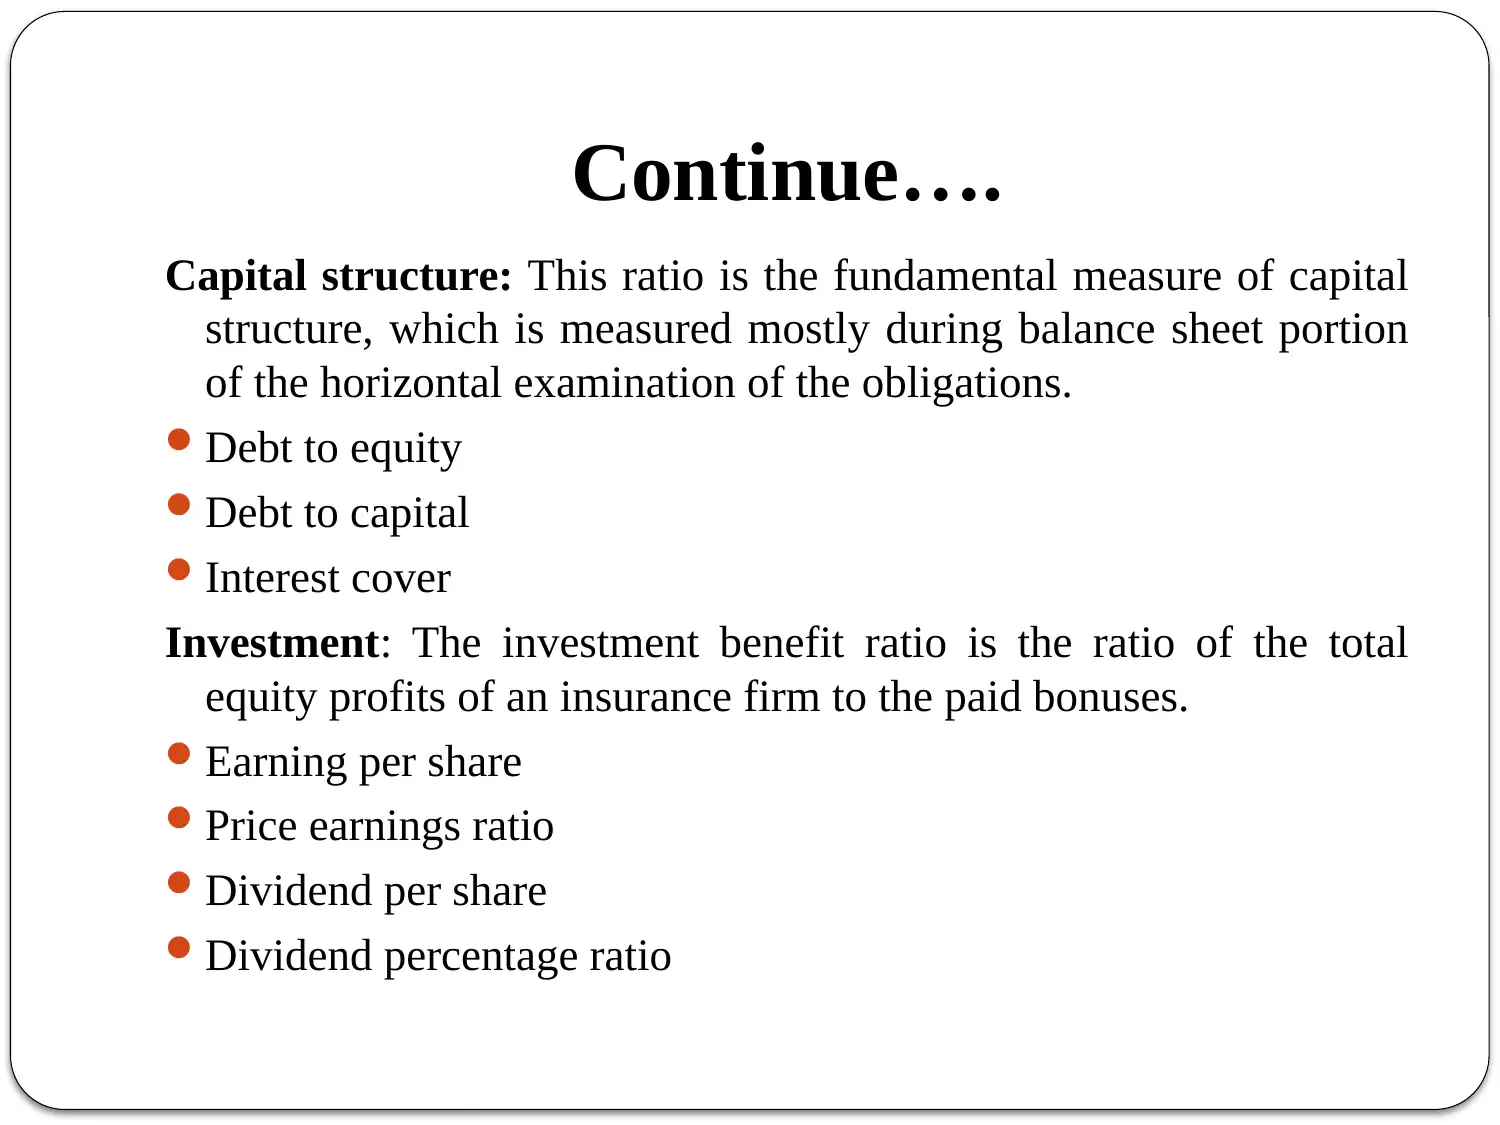
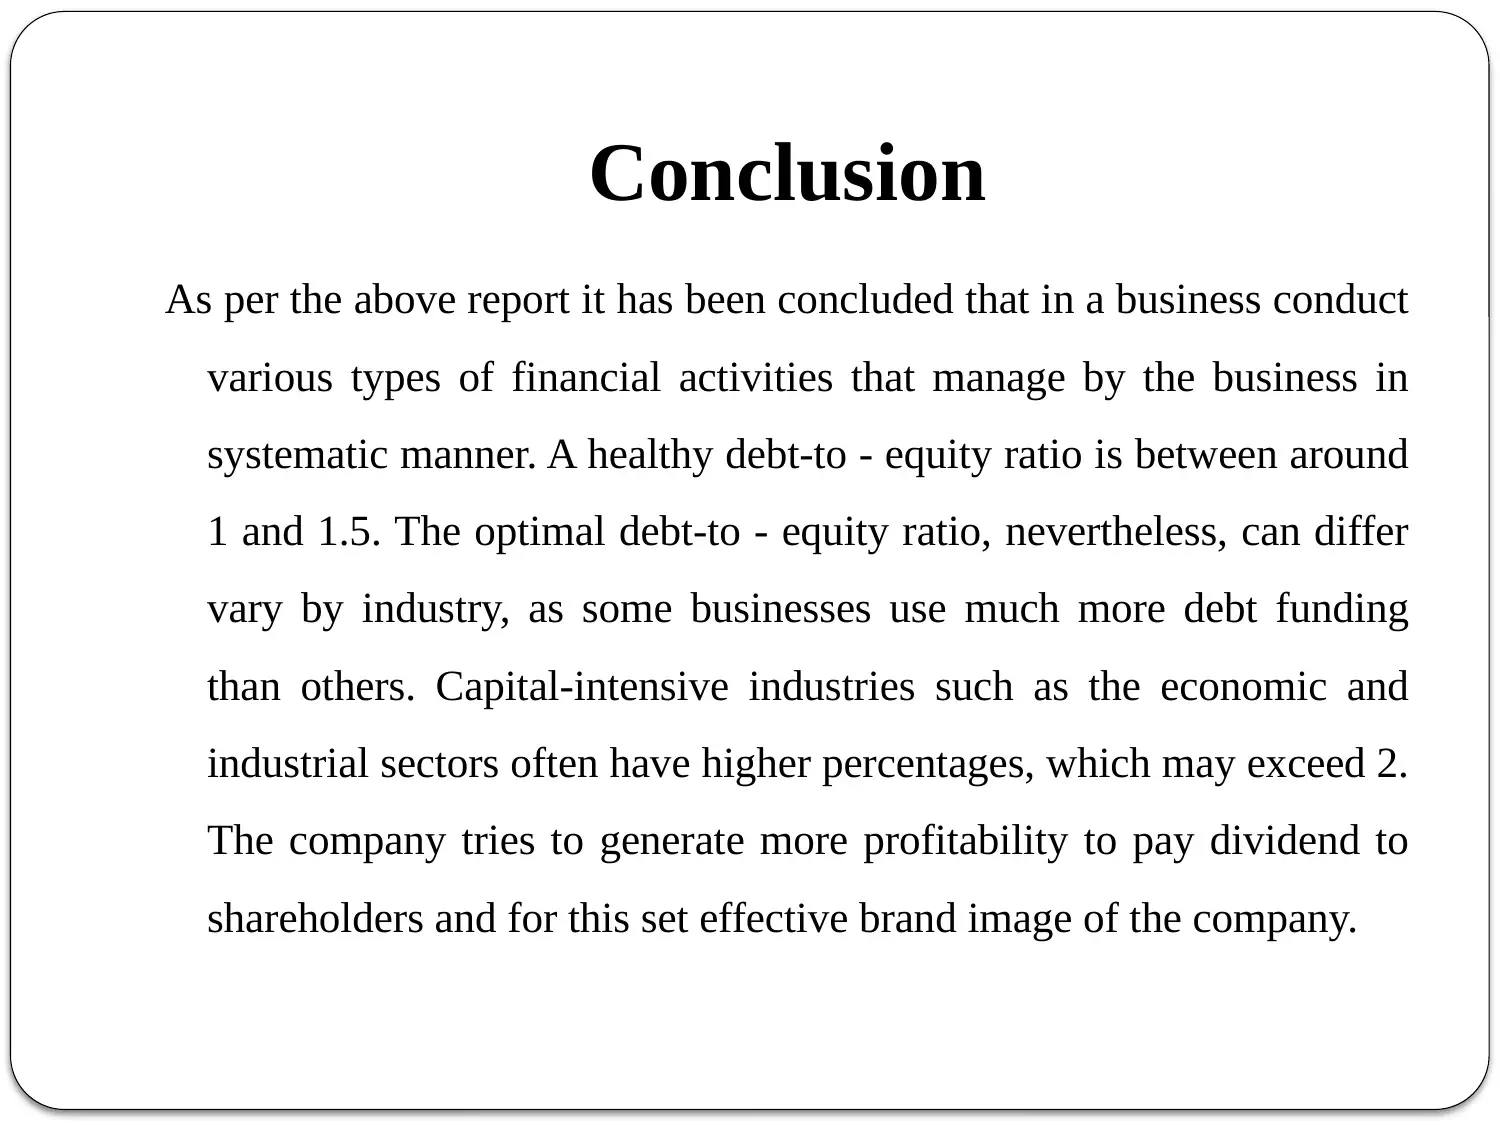
This report provides a comprehensive financial analysis of Rangemaster Plc, a manufacturing company supplying catering equipment to the hotel and restaurant industry in the United Kingdom. The analysis focuses on the company's financial performance, comparing the years 2018 and 2019, with an emphasis on key financial ratios. The report includes an executive summary, a summary of results, and detailed analyses of various ratio families, including profitability, efficiency, liquidity, capital structure, and investment ratios. It examines the income statement and statement of financial position to assess the company's financial health and performance. The conclusion highlights the importance of financial management in business and provides insights into the company's financial strategies and goals, such as generating profitability to pay dividends and build a strong brand image. References to relevant academic sources are also included.
Document Page
Financial Management For Hotel
Industry
tabler-icon-diamond-filled.svg

Paraphrase This Document

Need a fresh take? Get an instant paraphrase of this document with our AI Paraphraser
Document Page
Table Of Content
Executive Summary
Summary of results
Analysis of each family ratio
Conclusion
References
Document Page
Executive Summary
Finance represents the lifeline of any company. Finance, indeed, is
still limited and so are most other tools. Financial management is
first component of the economic reporting presentation. This report
based on Rangemaster Plc which is a manufacturing company that
produce and supply of catering machine to hotel, restaurants and
public services in United Kingdom. In this report analysis the
financial performance of company and identify the changes that are
coming in 2019 as compare of 2018. Along with focus on the
financial ratio that accurately define the problem of the business.
Document Page
Summary Of Results
Summarized income statement: The main purpose is preparing of this
statement to know net profit in particular accounting period. The company
prepares this statement for the year 2018 and 2019 and analysis the
differences in both years. In the year, 2018 sales revenue was 250,000 and
in 2019 increase by 50000 reach on 300,000.
Summarized statement of financial position: The main aim is preparing
of this statement to present actual financial position of company in
particular year along with presents total assets and total liabilities. The
non-current assets were 528500 in 2018 that were increasing in 2019 by
84227 and reach on 612727 so identify the performance 15.9.
tabler-icon-diamond-filled.svg

Paraphrase This Document

Need a fresh take? Get an instant paraphrase of this document with our AI Paraphraser
Document Page
Analysis of Each Family Ratio
Profitability: Profitability ratios are a category of accounting measures
which are calculated across period to measure the capacity of a
company to produce profits compared to its sales, operational
expenses, balance sheet resources and shareholders' equity, using
information from a particular duration period.
Return on capital employed
Assets turnover
Gross Profit
Net operating profit
Document Page
Continue…
Efficiency: Generally, the efficiency ratio is used to assess how efficiently an
organization effectively manages its resources and responsibilities.
Non current assets turnover
Inventory Turnover
Liquidity: the liquidity ratio is a calculation used to calculate the capacity of a
firm to pay its quick-term liabilities.
Current ratio
Acid test
Creditors days
Debtors days
Document Page
Continue….
Capital structure: This ratio is the fundamental measure of capital
structure, which is measured mostly during balance sheet portion
of the horizontal examination of the obligations.
Debt to equity
Debt to capital
Interest cover
Investment: The investment benefit ratio is the ratio of the total
equity profits of an insurance firm to the paid bonuses.
Earning per share
Price earnings ratio
Dividend per share
Dividend percentage ratio
tabler-icon-diamond-filled.svg

Paraphrase This Document

Need a fresh take? Get an instant paraphrase of this document with our AI Paraphraser
Document Page
Conclusion
As per the above report it has been concluded that in a business conduct
various types of financial activities that manage by the business in
systematic manner. A healthy debt-to - equity ratio is between around
1 and 1.5. The optimal debt-to - equity ratio, nevertheless, can differ
vary by industry, as some businesses use much more debt funding
than others. Capital-intensive industries such as the economic and
industrial sectors often have higher percentages, which may exceed 2.
The company tries to generate more profitability to pay dividend to
shareholders and for this set effective brand image of the company.
Document Page
References
Alsemgeest, L., 2015. Arguments for and against financial literacy
education: where to go from here?. International Journal of
Consumer Studies. 39(2). pp.155-161.
Das, C. P. and Swain, R. K., 2018. Influence of capital structure
on financial performance. Parikalpana: KIIT Journal of
Management. 14(1). pp.161-171.
Dwiastanti, A., 2015. Financial Literacy as the Foundation for
Individual Financial Behavior. Journal of Education and
Practice. 6(33). pp.99-105.
Dzhandzhugazova, E. A. and et.al, 2015. Chaplyuk, VZ
Methodological aspects of strategic management of financial risks
during construction of hotel business objects. Asian Social
Science. 11(20). pp.229-234.
chevron_up_icon
1 out of 9
circle_padding
hide_on_mobile
zoom_out_icon
[object Object]