Financial Report: Capital Budgeting, Ratio Analysis, and CVP
VerifiedAdded on 2020/02/03
|14
|2792
|36
Report
AI Summary
This finance report provides a comprehensive analysis of capital budgeting techniques, including payback period, NPV, IRR, and discounted payback. It evaluates three investment projects, assessing their profitability and risks. The report also examines financial ratio analysis of Morrison PLC, interpreting ratios like gross profit, net profit, current ratio, asset turnover, and debt-equity ratio, and discusses the information needs of stakeholders. Additionally, it explores break-even analysis, computing contribution, sales volume, and profit margins for two products, while also evaluating the advantages and disadvantages of their cost profiles. The report concludes with a discussion on the importance of the present value concept and the benefits of contribution and cost-volume-profit analysis.

FINANCE
Paraphrase This Document
Need a fresh take? Get an instant paraphrase of this document with our AI Paraphraser
TABLE OF CONTENTS
INTRODUCTION...........................................................................................................................4
Question 1........................................................................................................................................4
(a) Project evaluation...................................................................................................................4
(b) Project risks and their impact on calculation..........................................................................9
(c) Importance of present value concept......................................................................................9
Question 2......................................................................................................................................10
(a) Ratio analysis.......................................................................................................................10
(b) Information needs of stakeholders.......................................................................................11
(c) Evaluation of use of ratio analysis........................................................................................11
Question 3......................................................................................................................................12
(a) Compute contribution, sales volume and sales value needed for break even......................12
(b) Calculation of profit and margin of safety...........................................................................13
(c) Advantage and disadvantage of cost profile of two products...............................................13
(d) Benefits of contribution analysis and cost volume profit analysis.......................................14
Conclusion.....................................................................................................................................14
REFERENCES..............................................................................................................................15
LIST OF TABLES
Table 1: Calculation of payback period method............................................................................4
Table 2: Calculation of NPV..........................................................................................................4
Table 3: Calculation of IRR...........................................................................................................5
Table 4: Discounted payback.........................................................................................................5
Table 5: Calculation of payback period.........................................................................................6
Table 6: Calculation of NPV..........................................................................................................6
Table 7: Calculation of IRR...........................................................................................................6
Table 8: Discounted payback period..............................................................................................7
Table 9: Calculation of payback period.........................................................................................7
Table 10: Calculation of NPV........................................................................................................8
Table 11: Calculation of IRR.........................................................................................................8
Table 12: Calculation of discounted payback period.....................................................................8
Table 13: Ratio analysis of Morrison.............................................................................................9
Table 14: Computation of breakeven analysis.............................................................................11
Table 15: Computation of profit and margin of safety.................................................................12
⊘ This is a preview!⊘
Do you want full access?
Subscribe today to unlock all pages.
Trusted by 1+ million students worldwide
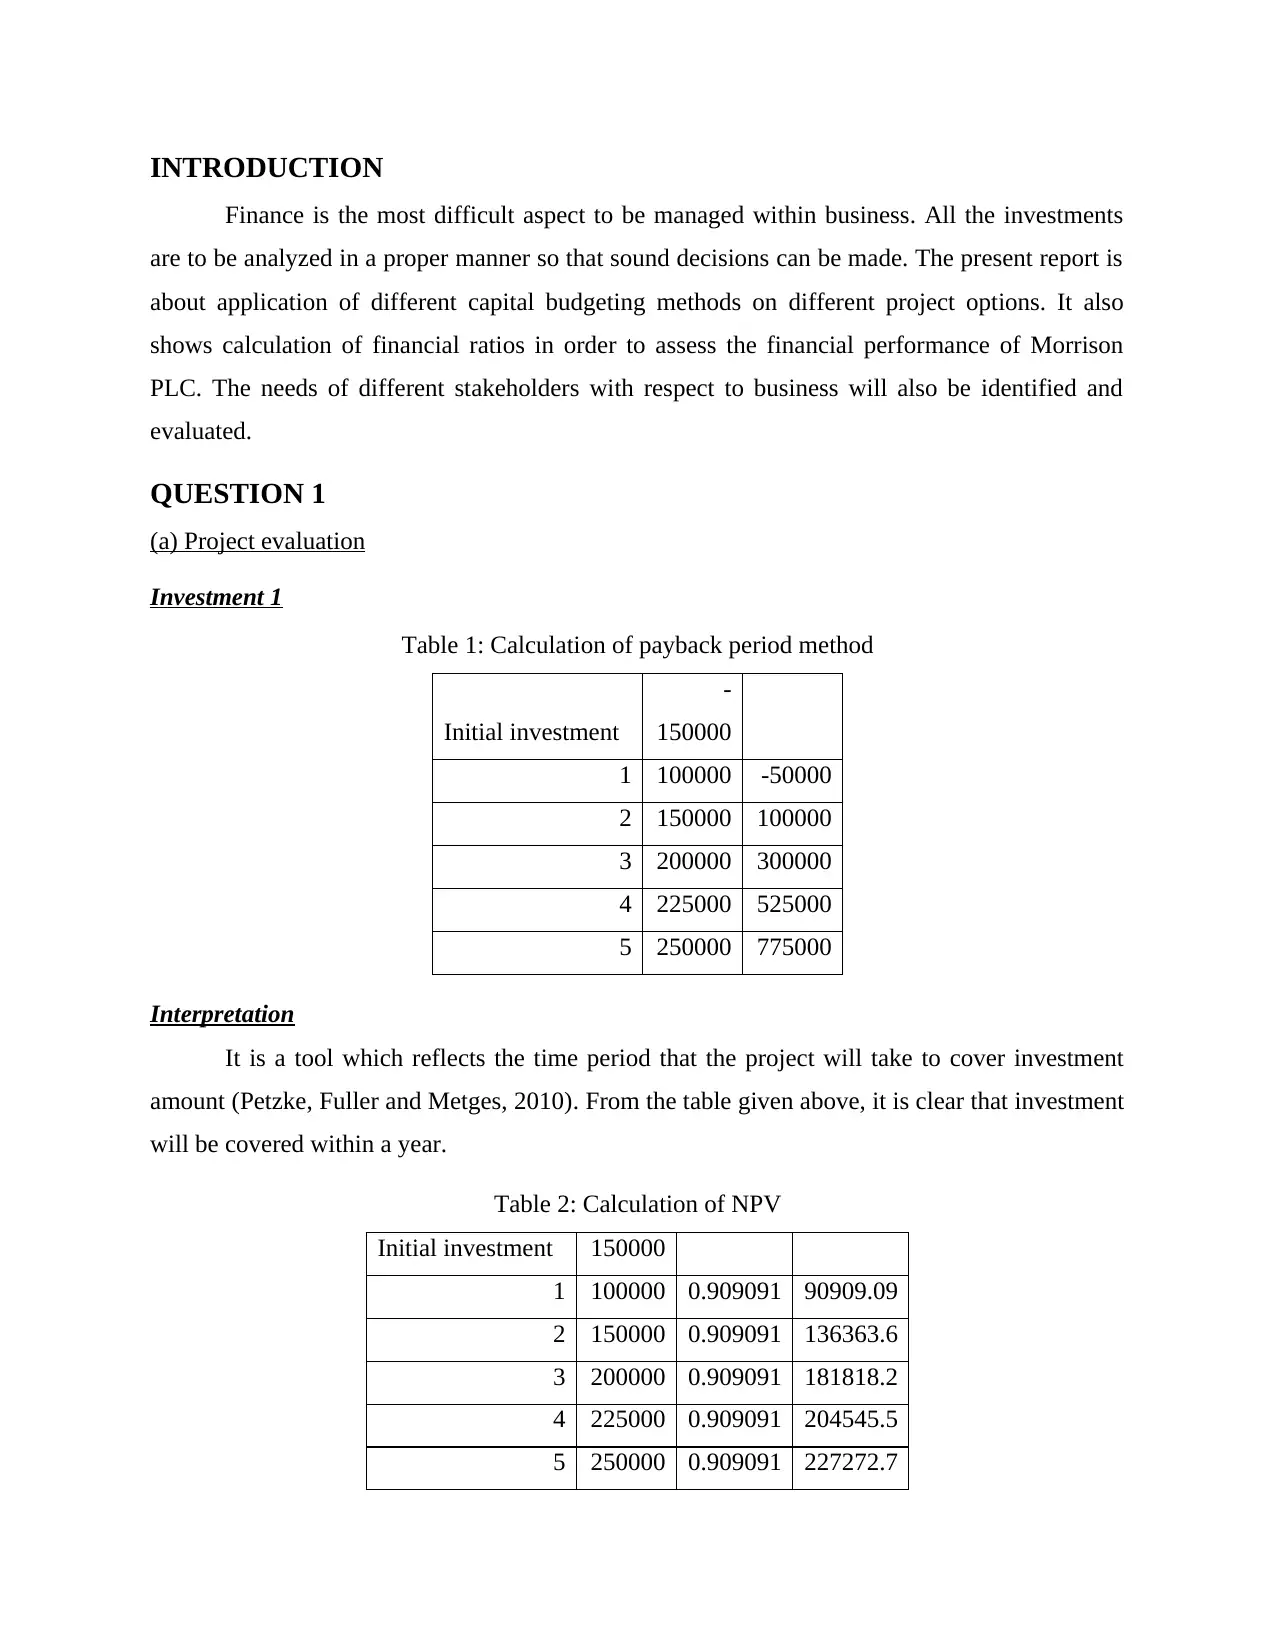
INTRODUCTION
Finance is the most difficult aspect to be managed within business. All the investments
are to be analyzed in a proper manner so that sound decisions can be made. The present report is
about application of different capital budgeting methods on different project options. It also
shows calculation of financial ratios in order to assess the financial performance of Morrison
PLC. The needs of different stakeholders with respect to business will also be identified and
evaluated.
QUESTION 1
(a) Project evaluation
Investment 1
Table 1: Calculation of payback period method
Initial investment
-
150000
1 100000 -50000
2 150000 100000
3 200000 300000
4 225000 525000
5 250000 775000
Interpretation
It is a tool which reflects the time period that the project will take to cover investment
amount (Petzke, Fuller and Metges, 2010). From the table given above, it is clear that investment
will be covered within a year.
Table 2: Calculation of NPV
Initial investment 150000
1 100000 0.909091 90909.09
2 150000 0.909091 136363.6
3 200000 0.909091 181818.2
4 225000 0.909091 204545.5
5 250000 0.909091 227272.7
Paraphrase This Document
Need a fresh take? Get an instant paraphrase of this document with our AI Paraphraser
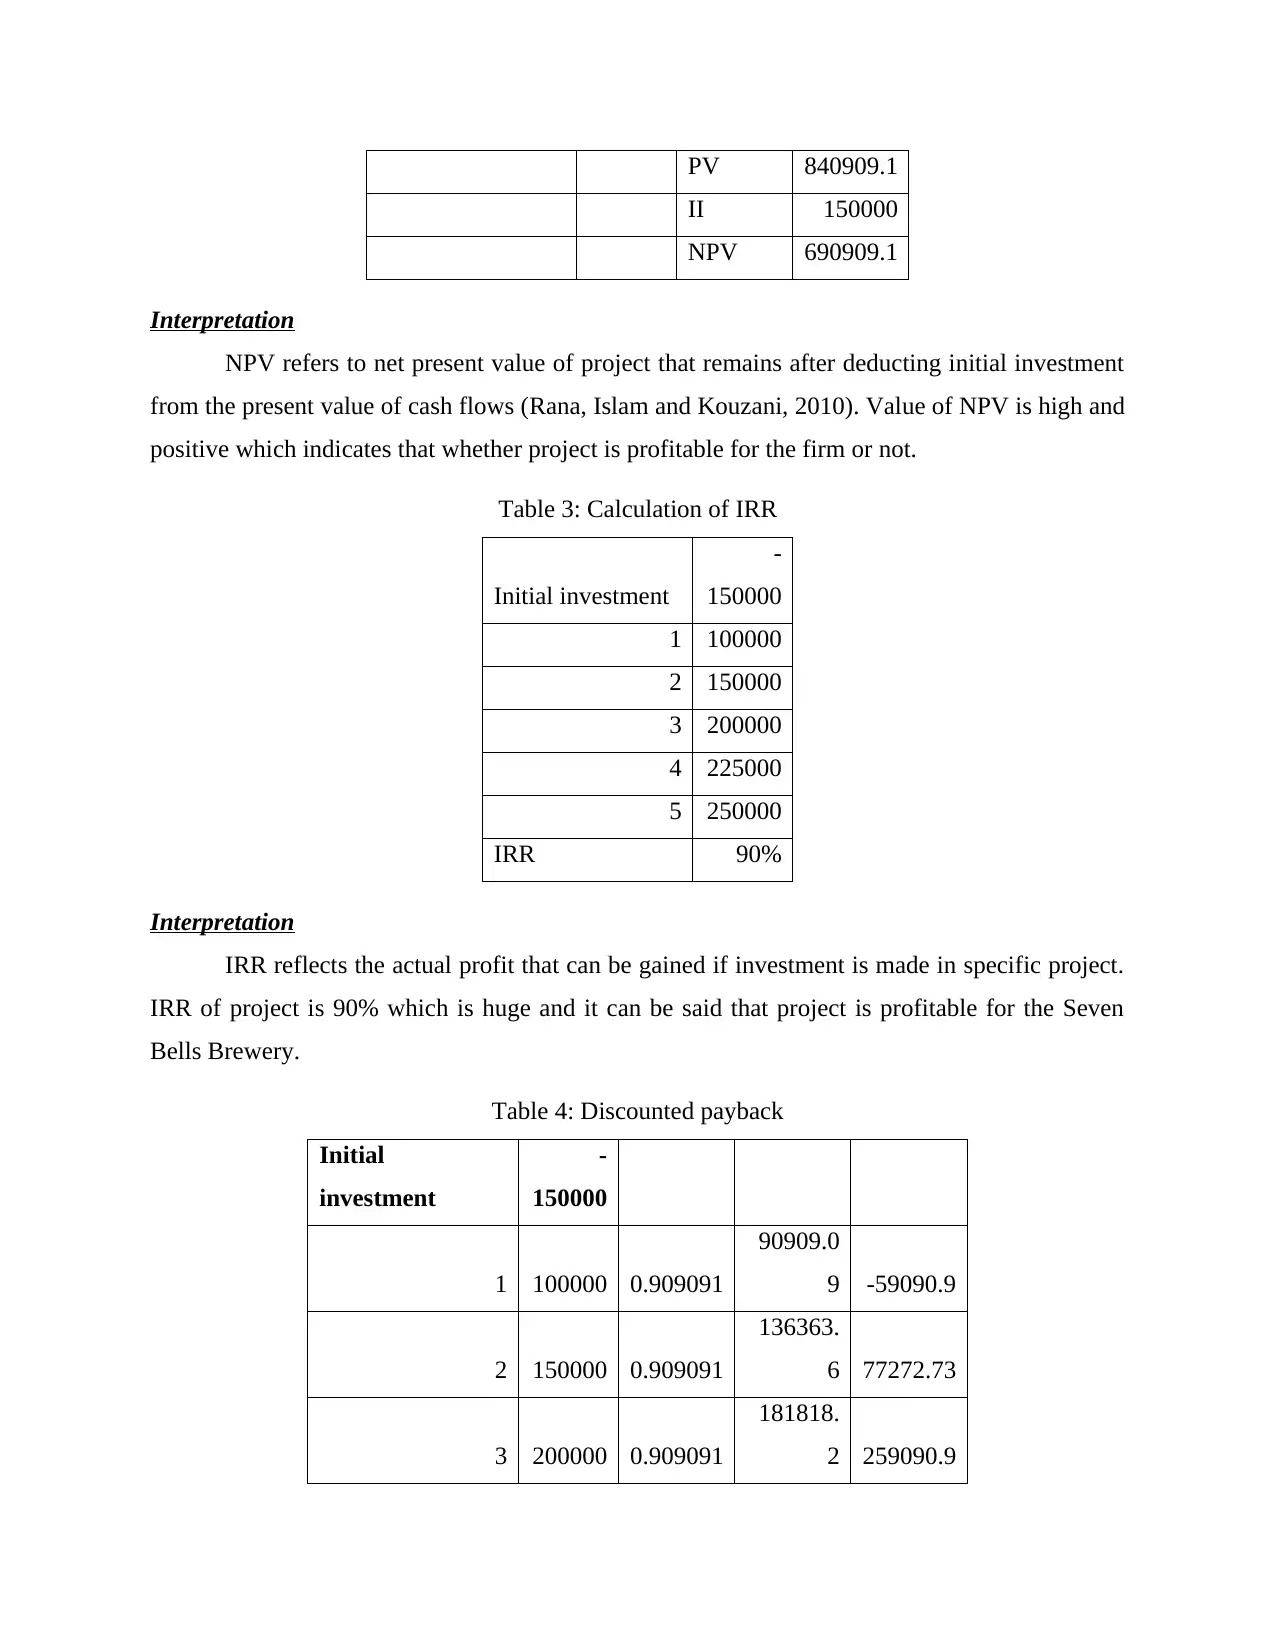
PV 840909.1
II 150000
NPV 690909.1
Interpretation
NPV refers to net present value of project that remains after deducting initial investment
from the present value of cash flows (Rana, Islam and Kouzani, 2010). Value of NPV is high and
positive which indicates that whether project is profitable for the firm or not.
Table 3: Calculation of IRR
Initial investment
-
150000
1 100000
2 150000
3 200000
4 225000
5 250000
IRR 90%
Interpretation
IRR reflects the actual profit that can be gained if investment is made in specific project.
IRR of project is 90% which is huge and it can be said that project is profitable for the Seven
Bells Brewery.
Table 4: Discounted payback
Initial
investment
-
150000
1 100000 0.909091
90909.0
9 -59090.9
2 150000 0.909091
136363.
6 77272.73
3 200000 0.909091
181818.
2 259090.9
4 225000 0.909091
204545.
5 463636.4
5 250000 0.909091
227272.
7 690909.1
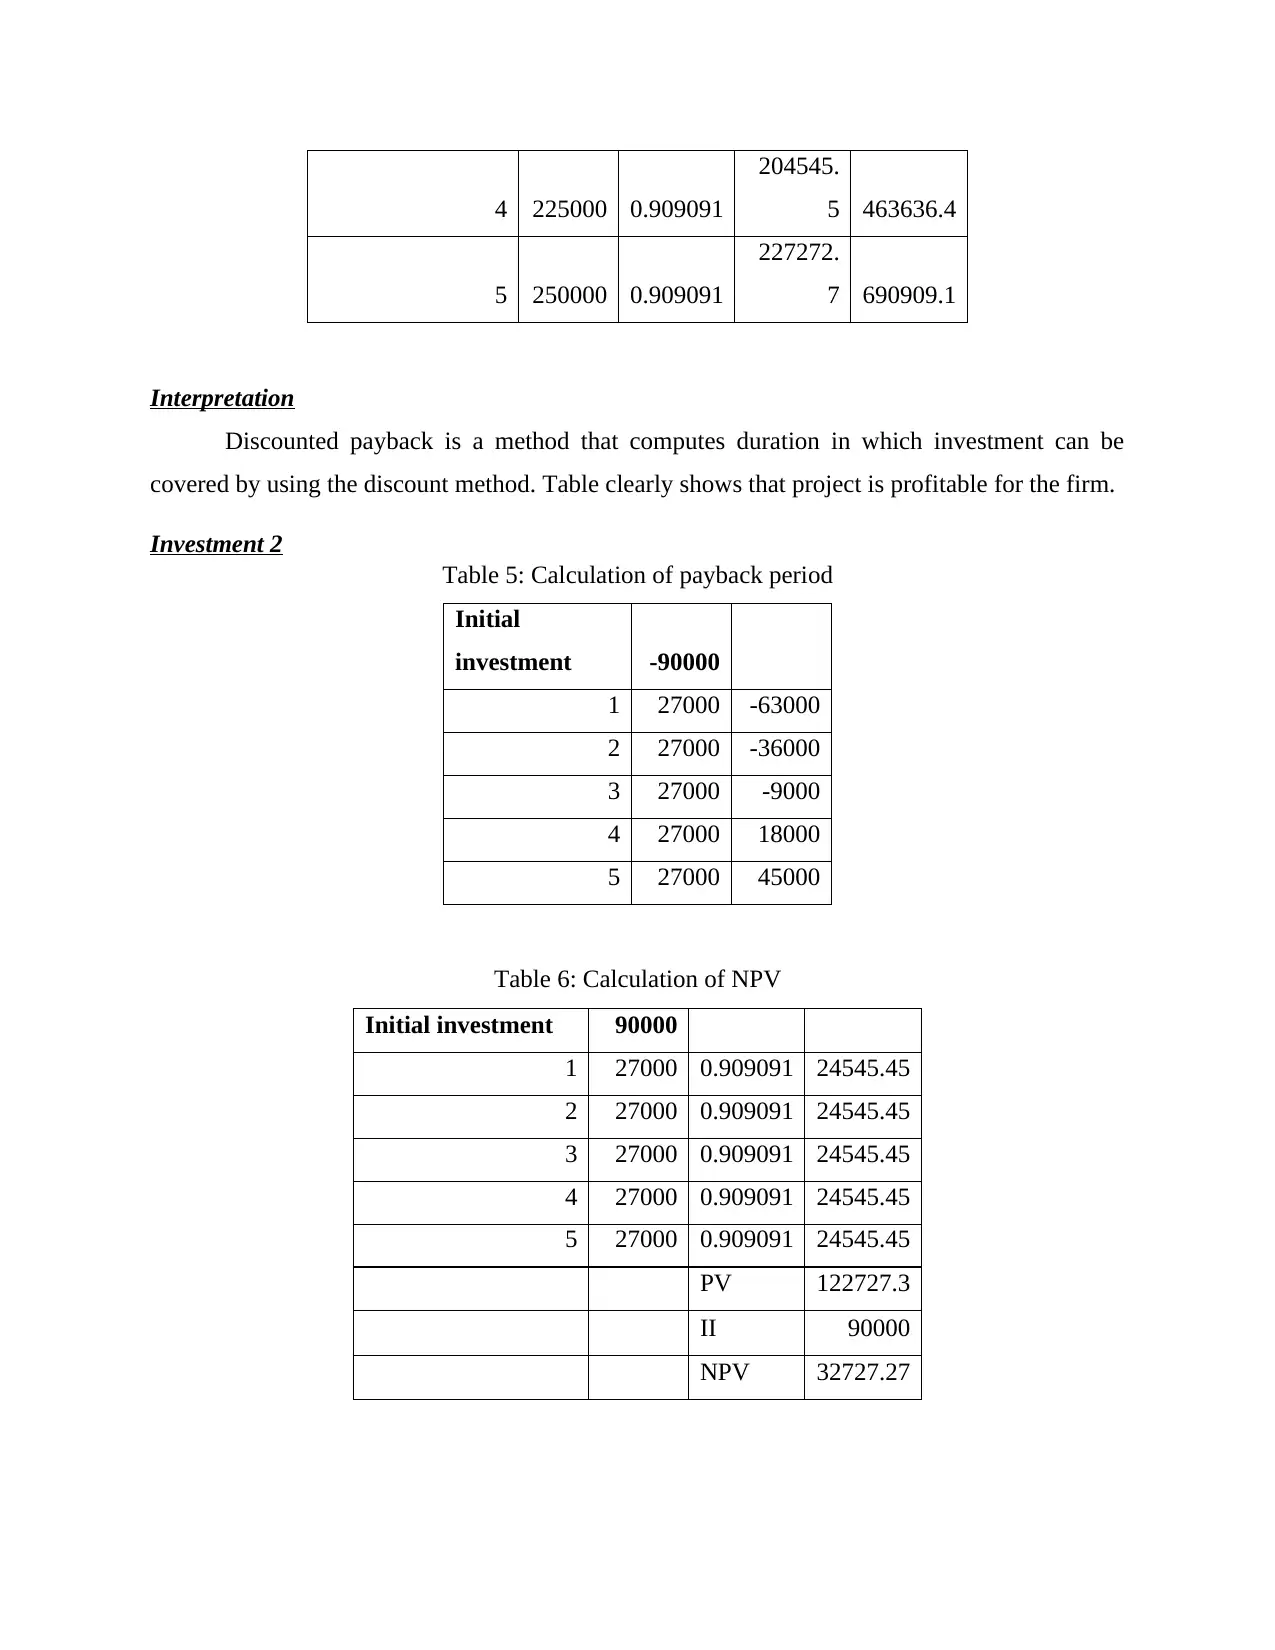
Interpretation
Discounted payback is a method that computes duration in which investment can be
covered by using the discount method. Table clearly shows that project is profitable for the firm.
Investment 2
Table 5: Calculation of payback period
Initial
investment -90000
1 27000 -63000
2 27000 -36000
3 27000 -9000
4 27000 18000
5 27000 45000
Table 6: Calculation of NPV
Initial investment 90000
1 27000 0.909091 24545.45
2 27000 0.909091 24545.45
3 27000 0.909091 24545.45
4 27000 0.909091 24545.45
5 27000 0.909091 24545.45
PV 122727.3
II 90000
NPV 32727.27
204545.
5 463636.4
5 250000 0.909091
227272.
7 690909.1
Interpretation
Discounted payback is a method that computes duration in which investment can be
covered by using the discount method. Table clearly shows that project is profitable for the firm.
Investment 2
Table 5: Calculation of payback period
Initial
investment -90000
1 27000 -63000
2 27000 -36000
3 27000 -9000
4 27000 18000
5 27000 45000
Table 6: Calculation of NPV
Initial investment 90000
1 27000 0.909091 24545.45
2 27000 0.909091 24545.45
3 27000 0.909091 24545.45
4 27000 0.909091 24545.45
5 27000 0.909091 24545.45
PV 122727.3
II 90000
NPV 32727.27
⊘ This is a preview!⊘
Do you want full access?
Subscribe today to unlock all pages.
Trusted by 1+ million students worldwide
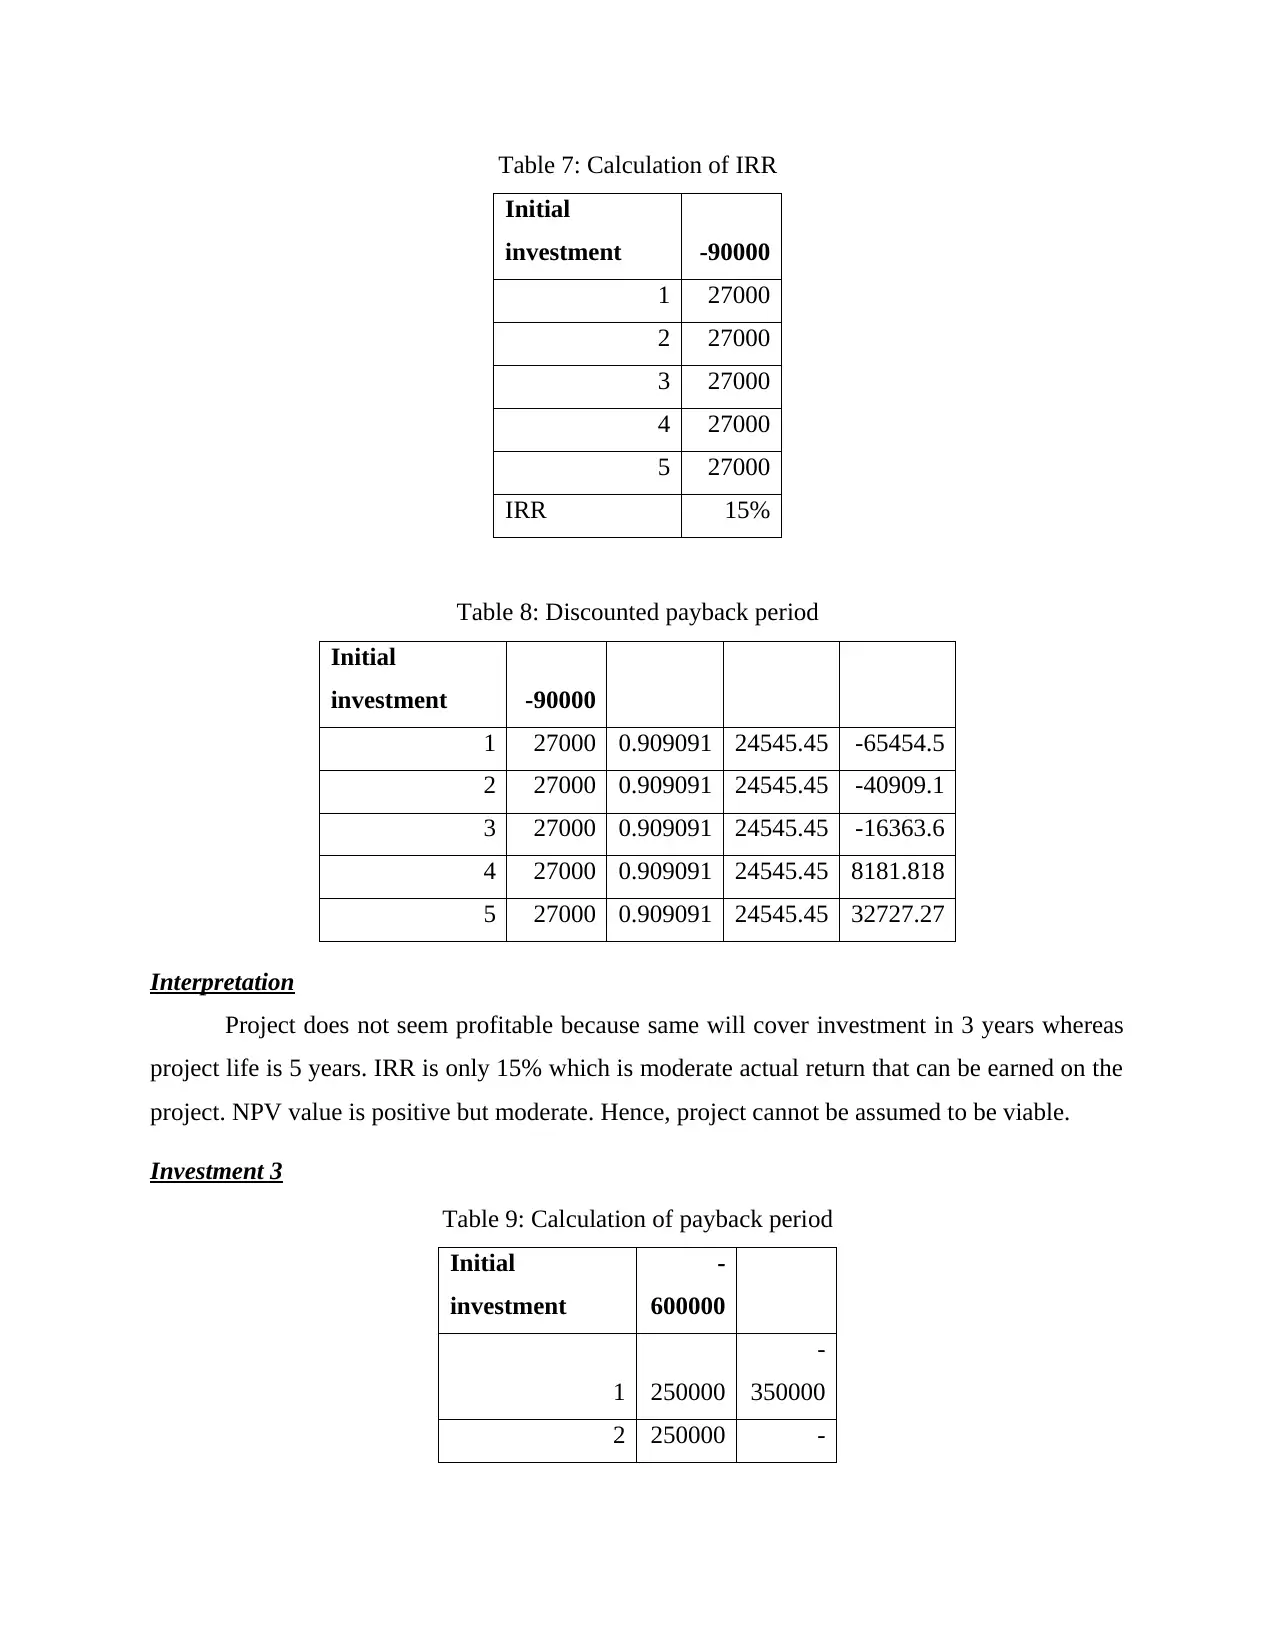
Table 7: Calculation of IRR
Initial
investment -90000
1 27000
2 27000
3 27000
4 27000
5 27000
IRR 15%
Table 8: Discounted payback period
Initial
investment -90000
1 27000 0.909091 24545.45 -65454.5
2 27000 0.909091 24545.45 -40909.1
3 27000 0.909091 24545.45 -16363.6
4 27000 0.909091 24545.45 8181.818
5 27000 0.909091 24545.45 32727.27
Interpretation
Project does not seem profitable because same will cover investment in 3 years whereas
project life is 5 years. IRR is only 15% which is moderate actual return that can be earned on the
project. NPV value is positive but moderate. Hence, project cannot be assumed to be viable.
Investment 3
Table 9: Calculation of payback period
Initial
investment
-
600000
1 250000
-
350000
2 250000 -
Initial
investment -90000
1 27000
2 27000
3 27000
4 27000
5 27000
IRR 15%
Table 8: Discounted payback period
Initial
investment -90000
1 27000 0.909091 24545.45 -65454.5
2 27000 0.909091 24545.45 -40909.1
3 27000 0.909091 24545.45 -16363.6
4 27000 0.909091 24545.45 8181.818
5 27000 0.909091 24545.45 32727.27
Interpretation
Project does not seem profitable because same will cover investment in 3 years whereas
project life is 5 years. IRR is only 15% which is moderate actual return that can be earned on the
project. NPV value is positive but moderate. Hence, project cannot be assumed to be viable.
Investment 3
Table 9: Calculation of payback period
Initial
investment
-
600000
1 250000
-
350000
2 250000 -
Paraphrase This Document
Need a fresh take? Get an instant paraphrase of this document with our AI Paraphraser
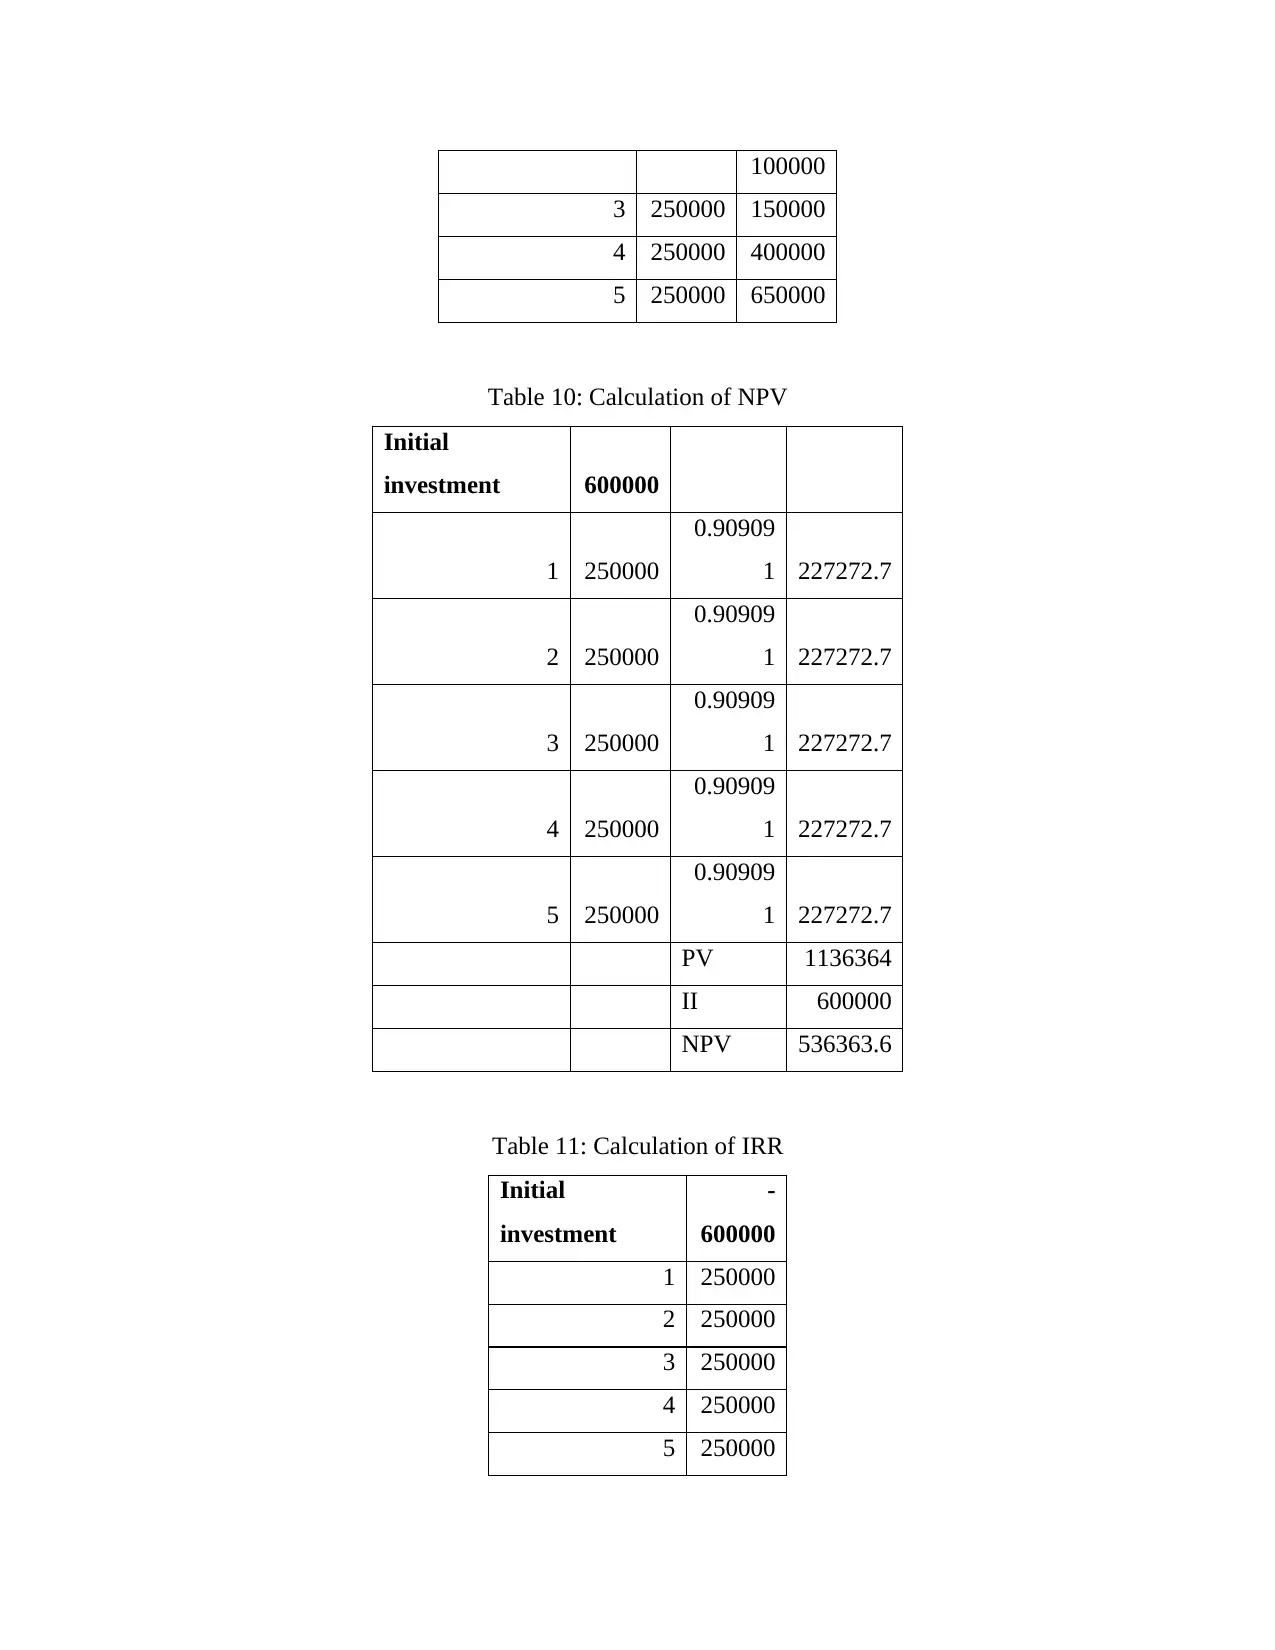
100000
3 250000 150000
4 250000 400000
5 250000 650000
Table 10: Calculation of NPV
Initial
investment 600000
1 250000
0.90909
1 227272.7
2 250000
0.90909
1 227272.7
3 250000
0.90909
1 227272.7
4 250000
0.90909
1 227272.7
5 250000
0.90909
1 227272.7
PV 1136364
II 600000
NPV 536363.6
Table 11: Calculation of IRR
Initial
investment
-
600000
1 250000
2 250000
3 250000
4 250000
5 250000
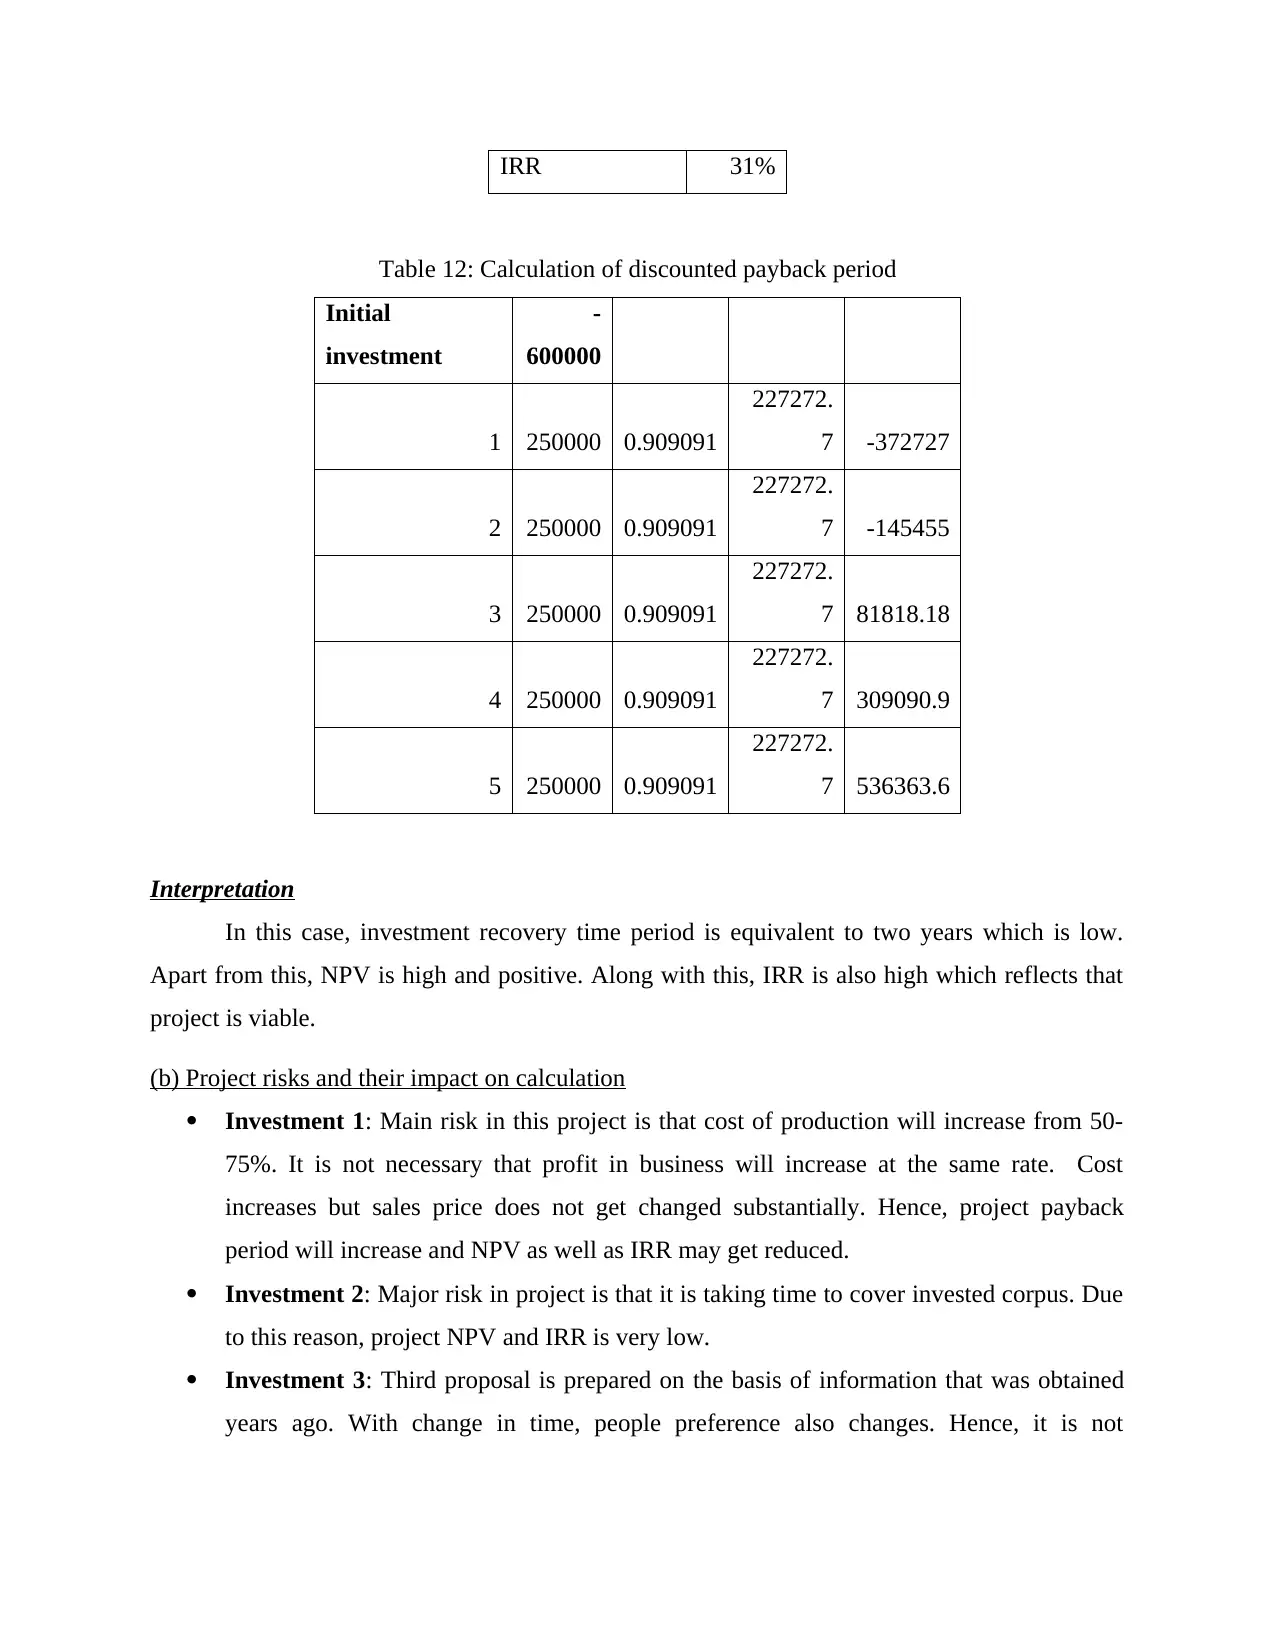
IRR 31%
Table 12: Calculation of discounted payback period
Initial
investment
-
600000
1 250000 0.909091
227272.
7 -372727
2 250000 0.909091
227272.
7 -145455
3 250000 0.909091
227272.
7 81818.18
4 250000 0.909091
227272.
7 309090.9
5 250000 0.909091
227272.
7 536363.6
Interpretation
In this case, investment recovery time period is equivalent to two years which is low.
Apart from this, NPV is high and positive. Along with this, IRR is also high which reflects that
project is viable.
(b) Project risks and their impact on calculation
Investment 1: Main risk in this project is that cost of production will increase from 50-
75%. It is not necessary that profit in business will increase at the same rate. Cost
increases but sales price does not get changed substantially. Hence, project payback
period will increase and NPV as well as IRR may get reduced.
Investment 2: Major risk in project is that it is taking time to cover invested corpus. Due
to this reason, project NPV and IRR is very low.
Investment 3: Third proposal is prepared on the basis of information that was obtained
years ago. With change in time, people preference also changes. Hence, it is not
⊘ This is a preview!⊘
Do you want full access?
Subscribe today to unlock all pages.
Trusted by 1+ million students worldwide
necessary that estimated cash flow will really happen in the business. If estimations are
made wrong, the project evaluation methods will produce negative results.
(c) Importance of present value concept
Present value concept helps individuals in doing valuation of the project by making use
of estimated cash flow for current time period (Morris and Pinto, 2010). Value of money is high
in current time period then in the upcoming years. Hence, it becomes very important to do
valuation of project for current time period.
QUESTION 2
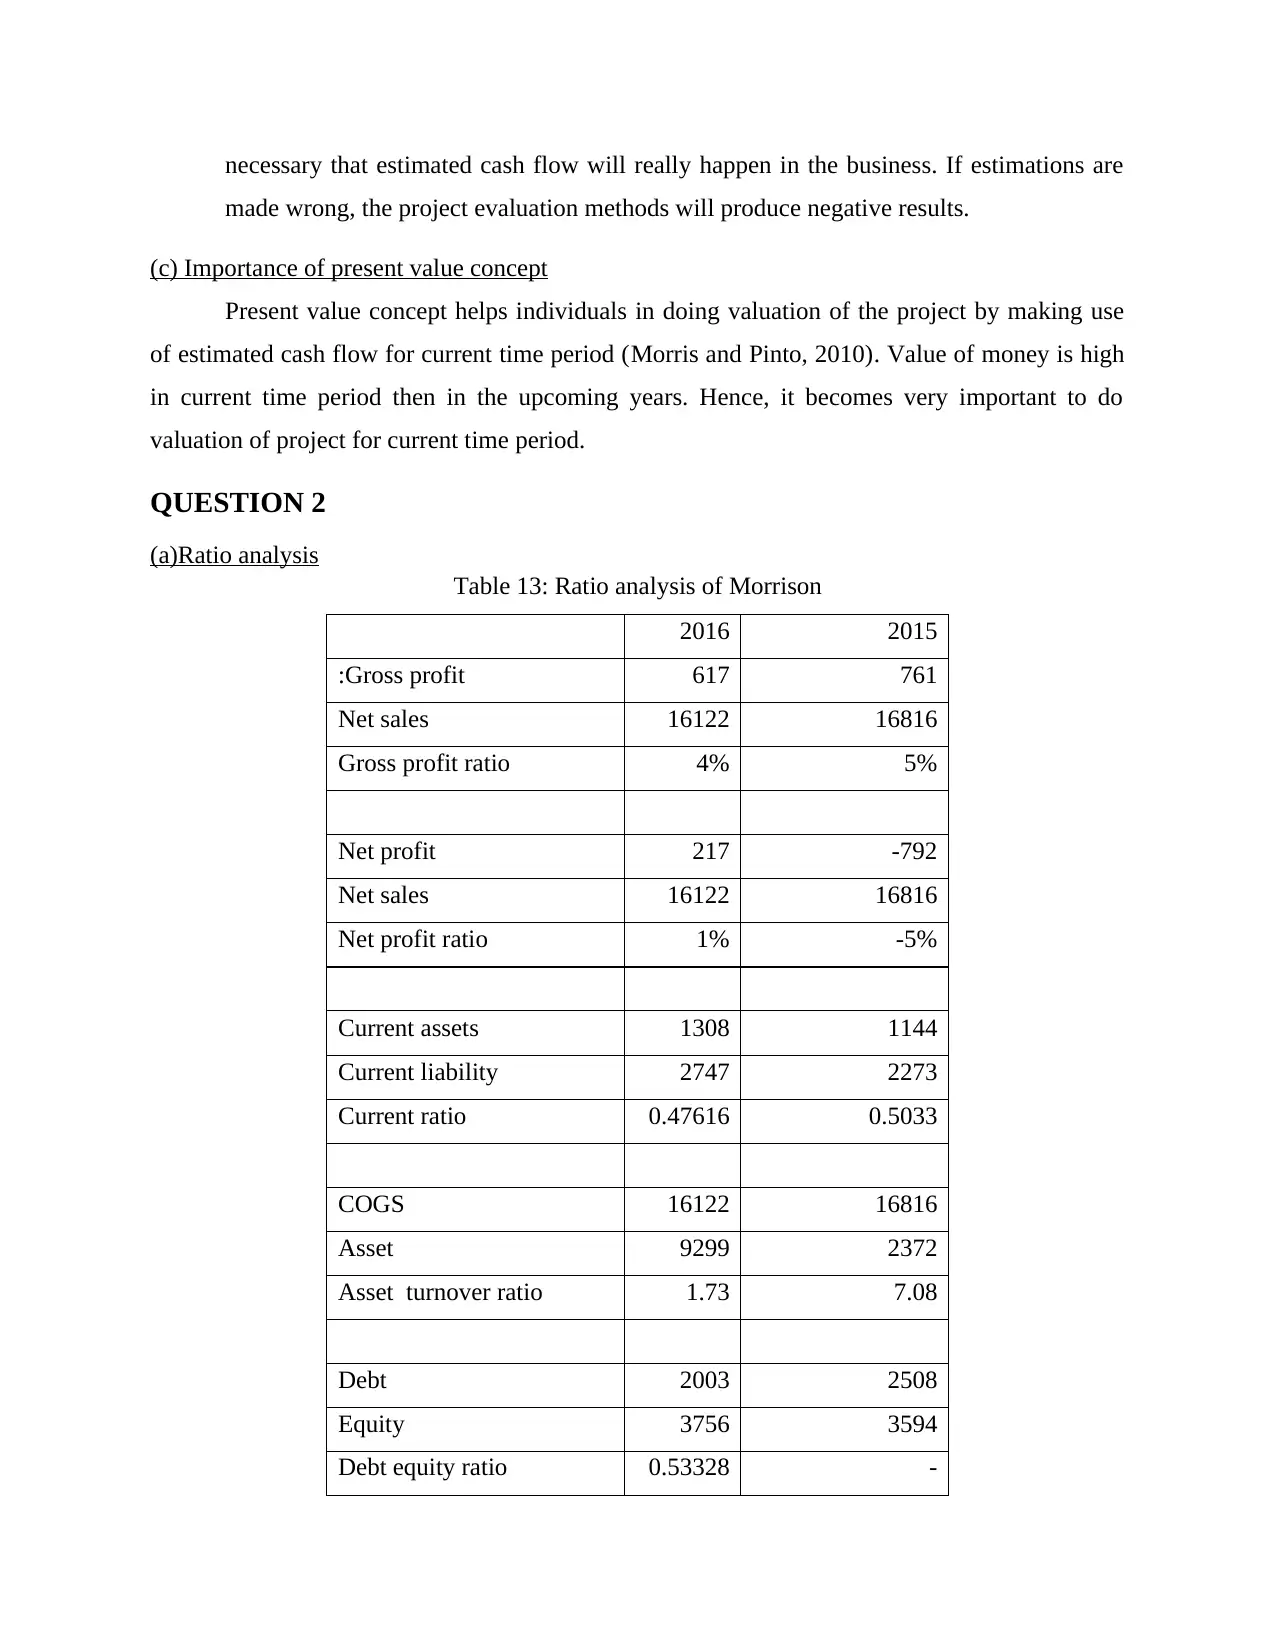
(a)Ratio analysis
Table 13: Ratio analysis of Morrison
2016 2015
:Gross profit 617 761
Net sales 16122 16816
Gross profit ratio 4% 5%
Net profit 217 -792
Net sales 16122 16816
Net profit ratio 1% -5%
Current assets 1308 1144
Current liability 2747 2273
Current ratio 0.47616 0.5033
COGS 16122 16816
Asset 9299 2372
Asset turnover ratio 1.73 7.08
Debt 2003 2508
Equity 3756 3594
Debt equity ratio 0.53328 -
made wrong, the project evaluation methods will produce negative results.
(c) Importance of present value concept
Present value concept helps individuals in doing valuation of the project by making use
of estimated cash flow for current time period (Morris and Pinto, 2010). Value of money is high
in current time period then in the upcoming years. Hence, it becomes very important to do
valuation of project for current time period.
QUESTION 2
(a)Ratio analysis
Table 13: Ratio analysis of Morrison
2016 2015
:Gross profit 617 761
Net sales 16122 16816
Gross profit ratio 4% 5%
Net profit 217 -792
Net sales 16122 16816
Net profit ratio 1% -5%
Current assets 1308 1144
Current liability 2747 2273
Current ratio 0.47616 0.5033
COGS 16122 16816
Asset 9299 2372
Asset turnover ratio 1.73 7.08
Debt 2003 2508
Equity 3756 3594
Debt equity ratio 0.53328 -
Paraphrase This Document
Need a fresh take? Get an instant paraphrase of this document with our AI Paraphraser
0.69783
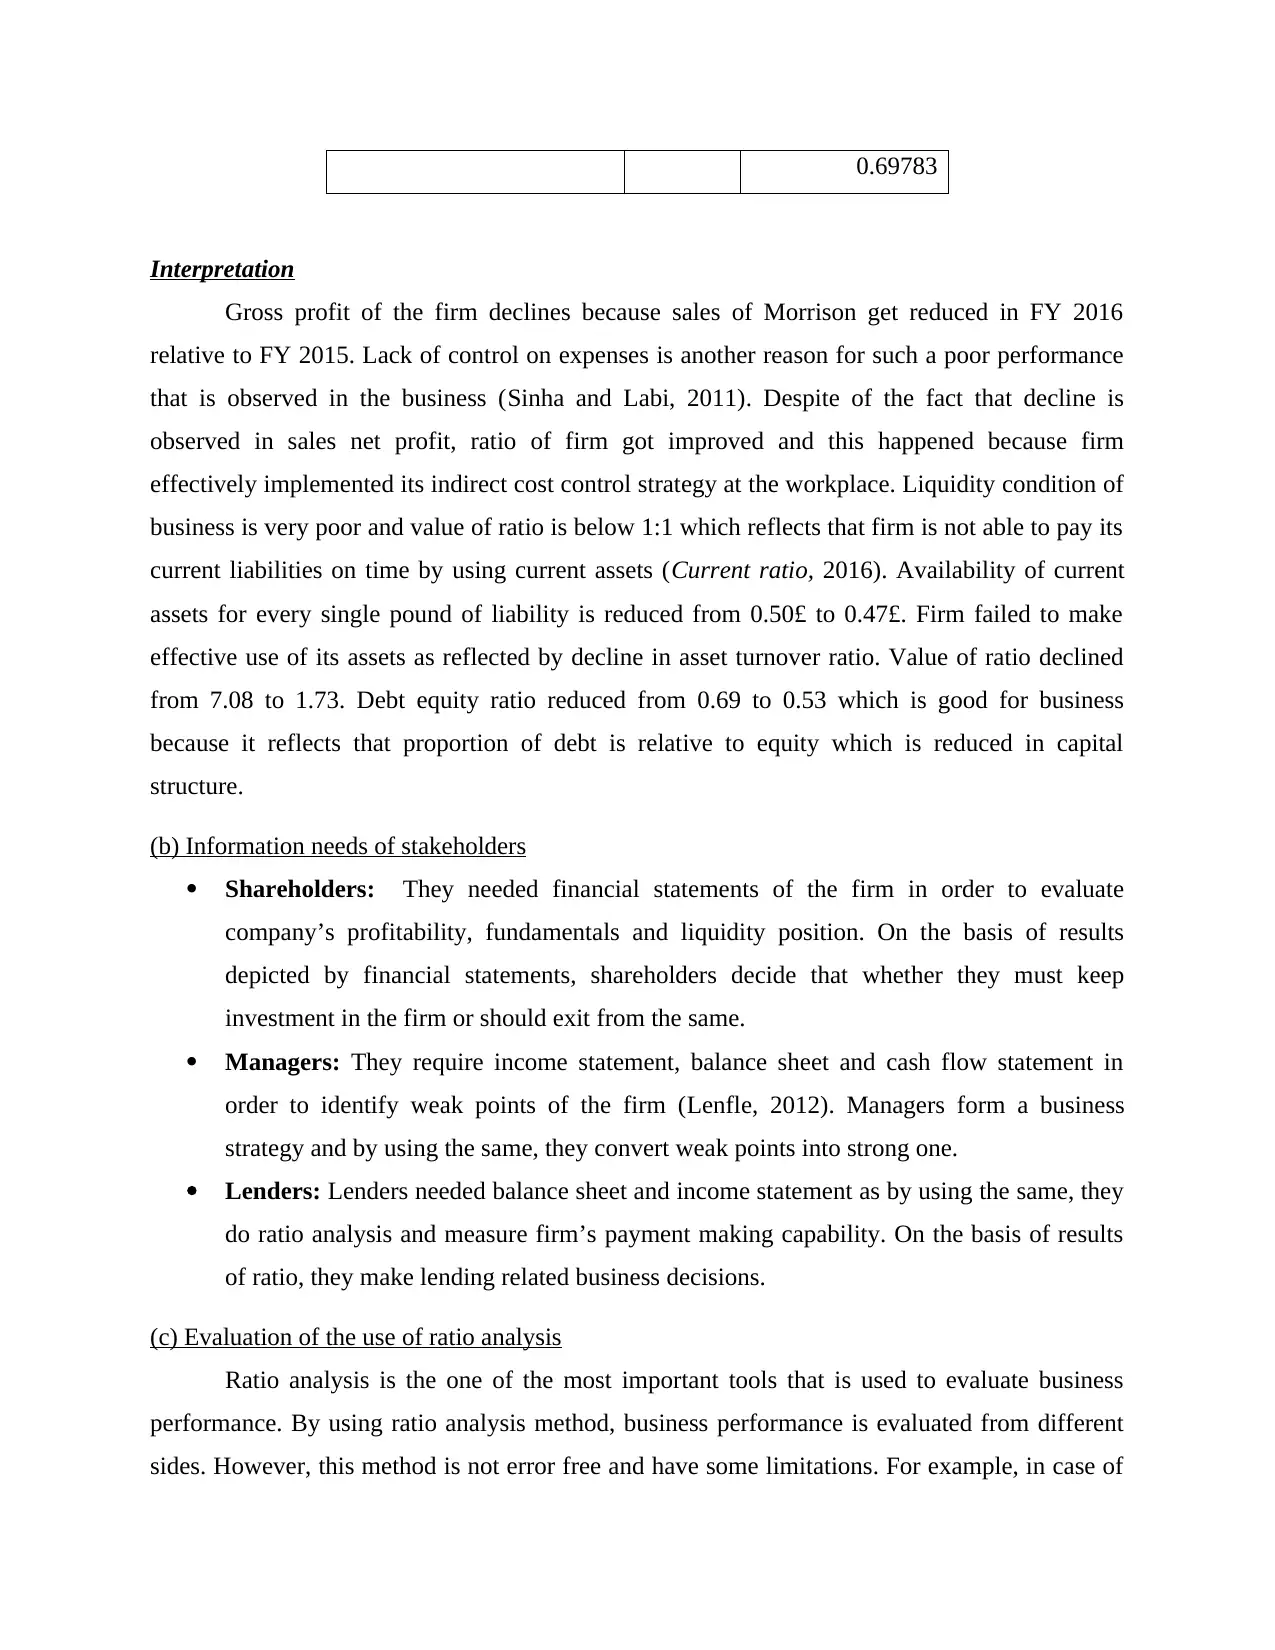
Interpretation
Gross profit of the firm declines because sales of Morrison get reduced in FY 2016
relative to FY 2015. Lack of control on expenses is another reason for such a poor performance
that is observed in the business (Sinha and Labi, 2011). Despite of the fact that decline is
observed in sales net profit, ratio of firm got improved and this happened because firm
effectively implemented its indirect cost control strategy at the workplace. Liquidity condition of
business is very poor and value of ratio is below 1:1 which reflects that firm is not able to pay its
current liabilities on time by using current assets (Current ratio, 2016). Availability of current
assets for every single pound of liability is reduced from 0.50£ to 0.47£. Firm failed to make
effective use of its assets as reflected by decline in asset turnover ratio. Value of ratio declined
from 7.08 to 1.73. Debt equity ratio reduced from 0.69 to 0.53 which is good for business
because it reflects that proportion of debt is relative to equity which is reduced in capital
structure.
(b) Information needs of stakeholders
Shareholders: They needed financial statements of the firm in order to evaluate
company’s profitability, fundamentals and liquidity position. On the basis of results
depicted by financial statements, shareholders decide that whether they must keep
investment in the firm or should exit from the same.
Managers: They require income statement, balance sheet and cash flow statement in
order to identify weak points of the firm (Lenfle, 2012). Managers form a business
strategy and by using the same, they convert weak points into strong one.
Lenders: Lenders needed balance sheet and income statement as by using the same, they
do ratio analysis and measure firm’s payment making capability. On the basis of results
of ratio, they make lending related business decisions.
(c) Evaluation of the use of ratio analysis
Ratio analysis is the one of the most important tools that is used to evaluate business
performance. By using ratio analysis method, business performance is evaluated from different
sides. However, this method is not error free and have some limitations. For example, in case of
current ratio, parameter is determined which is 2:1 which means that for every one pound of
current liability, there must be two pounds of current assets (Keller, Parameswaran and Jacob,
2011). If business conditions are not good then it is not possible to maintain standard value
which is 2:1. Managers always make use of 2:1 in order to evaluate liquidity in business without
considering the current market conditions. Hence, to some extent, they evaluate the performance
of business in a wrong way. This is one of the major shortcoming of ratio analysis.
QUESTION 3
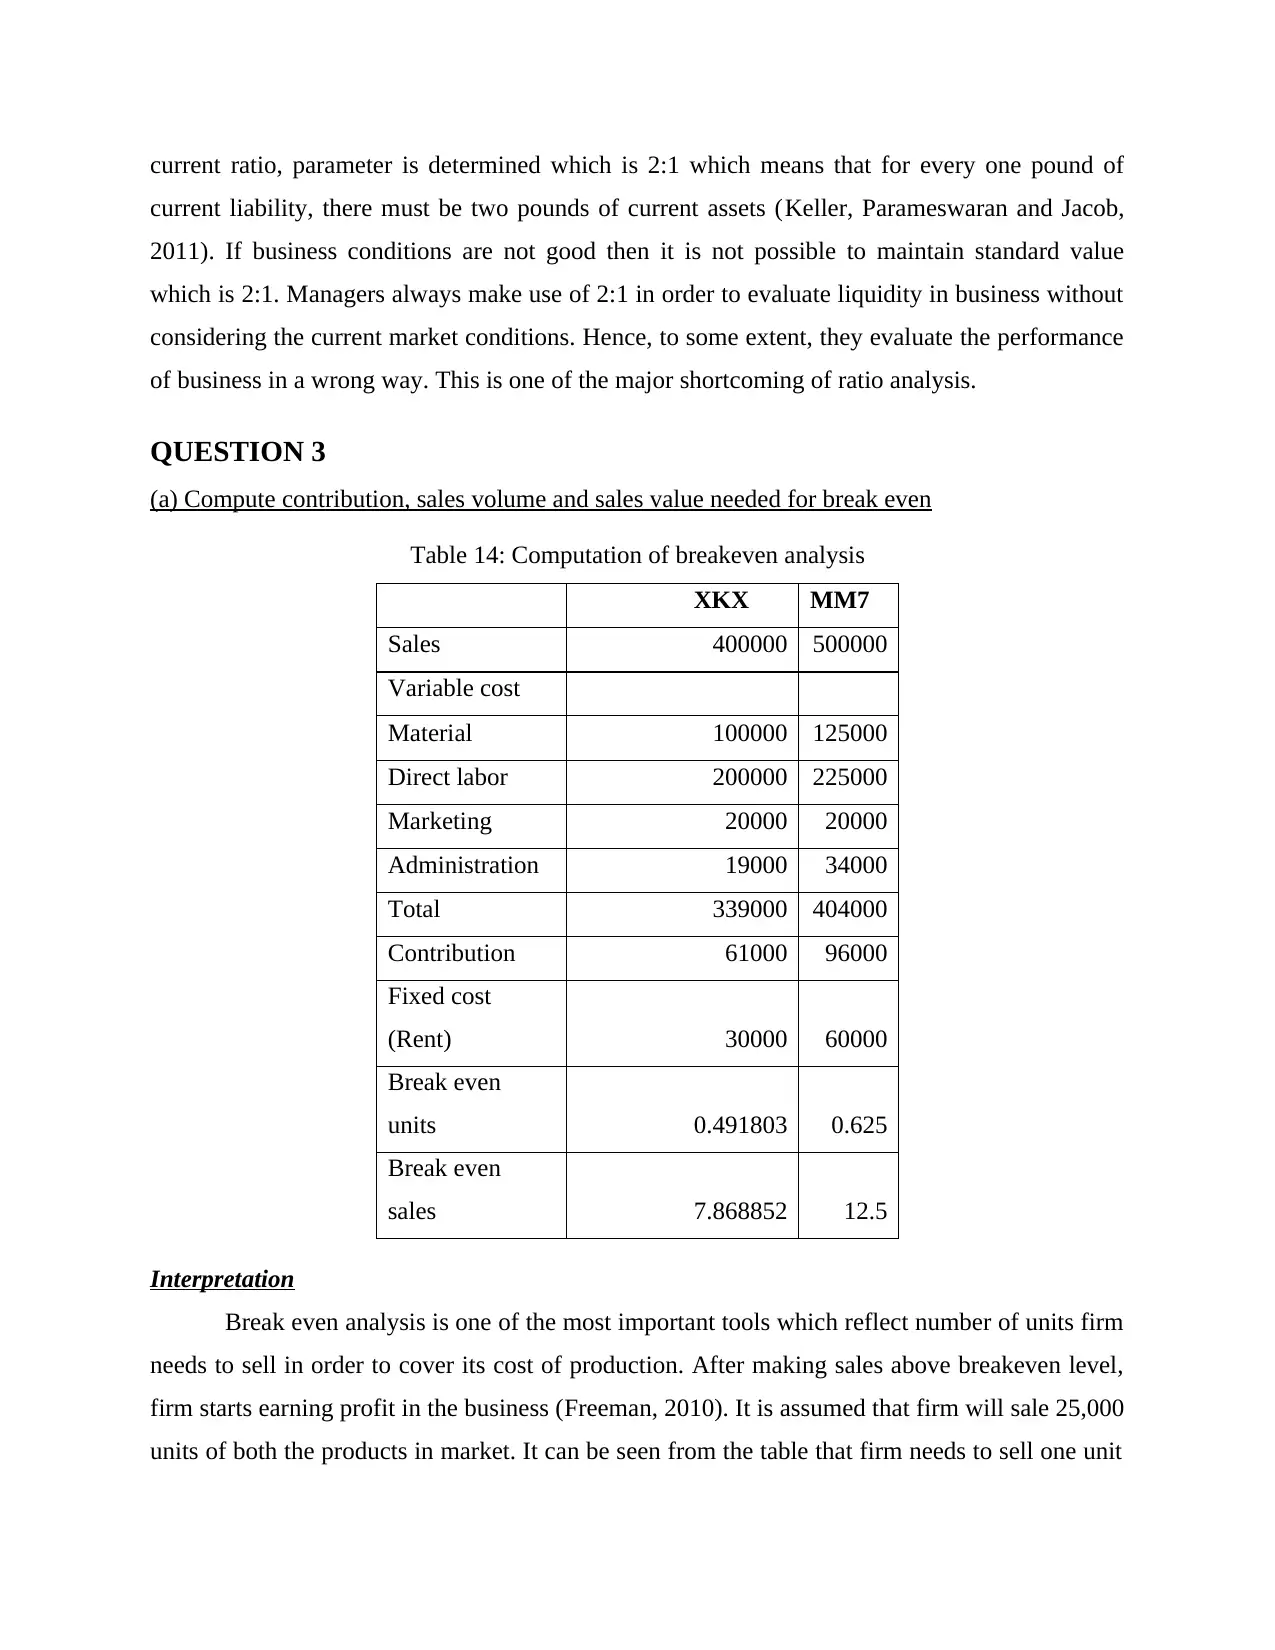
(a) Compute contribution, sales volume and sales value needed for break even
Table 14: Computation of breakeven analysis
XKX MM7
Sales 400000 500000
Variable cost
Material 100000 125000
Direct labor 200000 225000
Marketing 20000 20000
Administration 19000 34000
Total 339000 404000
Contribution 61000 96000
Fixed cost
(Rent) 30000 60000
Break even
units 0.491803 0.625
Break even
sales 7.868852 12.5
Interpretation
Break even analysis is one of the most important tools which reflect number of units firm
needs to sell in order to cover its cost of production. After making sales above breakeven level,
firm starts earning profit in the business (Freeman, 2010). It is assumed that firm will sale 25,000
units of both the products in market. It can be seen from the table that firm needs to sell one unit
current liability, there must be two pounds of current assets (Keller, Parameswaran and Jacob,
2011). If business conditions are not good then it is not possible to maintain standard value
which is 2:1. Managers always make use of 2:1 in order to evaluate liquidity in business without
considering the current market conditions. Hence, to some extent, they evaluate the performance
of business in a wrong way. This is one of the major shortcoming of ratio analysis.
QUESTION 3
(a) Compute contribution, sales volume and sales value needed for break even
Table 14: Computation of breakeven analysis
XKX MM7
Sales 400000 500000
Variable cost
Material 100000 125000
Direct labor 200000 225000
Marketing 20000 20000
Administration 19000 34000
Total 339000 404000
Contribution 61000 96000
Fixed cost
(Rent) 30000 60000
Break even
units 0.491803 0.625
Break even
sales 7.868852 12.5
Interpretation
Break even analysis is one of the most important tools which reflect number of units firm
needs to sell in order to cover its cost of production. After making sales above breakeven level,
firm starts earning profit in the business (Freeman, 2010). It is assumed that firm will sale 25,000
units of both the products in market. It can be seen from the table that firm needs to sell one unit
⊘ This is a preview!⊘
Do you want full access?
Subscribe today to unlock all pages.
Trusted by 1+ million students worldwide
1 out of 14
Related Documents


Your All-in-One AI-Powered Toolkit for Academic Success.
+13062052269
info@desklib.com
Available 24*7 on WhatsApp / Email
![[object Object]](/_next/static/media/star-bottom.7253800d.svg)
Unlock your academic potential
Copyright © 2020–2026 A2Z Services. All Rights Reserved. Developed and managed by ZUCOL.