Financial Performance Analysis: Greencore, Hilton, and Premier Foods
VerifiedAdded on 2023/01/03
|15
|3120
|98
Report
AI Summary
This report presents a comprehensive financial performance analysis of three UK-based food and drinks companies: Greencore Group Plc, Hilton Food Group Plc, and Premier Food Plc. Section A evaluates their strategic plans, including growth strategies, core values, and responses to market uncertainties like the COVID-19 pandemic and Brexit. It then provides a comparative analysis of various financial and non-financial ratios over three years, such as current ratio, return on equity, return on capital employed, asset turnover, and profit margins, to assess their performance. The analysis ranks Greencore as the top performer, followed by Hilton and Premier. Section B explores the sources of internal and external long-term finances available to these companies, including retained earnings, sale of assets, debentures, and stakeholder analysis. The report concludes with an investment opportunity assessment based on the financial analysis and discusses the impact of market conditions. This report is contributed by a student to Desklib, a platform offering AI-based study tools.

ACC 3015
1
1
Paraphrase This Document
Need a fresh take? Get an instant paraphrase of this document with our AI Paraphraser

Contents
Introduction......................................................................................................................................3
Section A.........................................................................................................................................3
Strategic plans..............................................................................................................................3
Evaluation of financial performance...........................................................................................4
Investment opportunity..............................................................................................................11
Section B........................................................................................................................................12
Sources of internal and external long-term finances.................................................................12
Stakeholder analysis..................................................................................................................13
Conclusion.....................................................................................................................................14
References......................................................................................................................................15
2

Introduction
Financial performance analysis of a company is necessary for both company and investors to
assess their past and present information to decide on their future course of action (Song, Zhao
and Zeng, 2017). This report contains two sections. Section A contains financial performance
analysis of the three companies – Greencore Group Plc, Hilton Food Group Plc and Premier
Food Plc. All the three are UK based companies operating in food and drinks industry. In Section
B, identification and analysis of various sources of internal and external sources of finance
available to companies are discussed.
Section A
Strategic plans
Companies prepare strategic plans to outline the measures in which they want to achieve
long term targets and goals.
Greencore Group Plc – It has a vision of “making every day taste better” which forms the
basis of all its strategies. Company has three pillared strategy – growth, relevance and
differentiation and believes in four differentiators – people at the care, sustainability, great food
and excellence. Company is aiming to reclaim its customer base by improving their production
and distribution level. It is planning to increase its meal salads and chilled snacking this year
(Building back with confidence, 2020). They believe their capital allocation model provides
them a base building sustainability and strengthening resilience against dynamic and powerful
market impact. Their marketing is driven by core values – improving food safety, making
customers’ lives simpler and conservation but are marred by uncertainties posed due to Covid-19
pandemic and unclear Brexit policies.
Hilton Food Group Plc – The core values of the company that drives its strategy and
brand building is providing sustainable value growth to shareholders. They have adopted
expansionary policies as medium to grow and aims to improve their profitability by 3 pillar
policy - reducing unit cost, introducing new products range and diversifying their production and
distribution centres. They enter into agreements, mergers, acquisitions, joint ventures, etc. to
expand their business (Kusumah and Fabianto, 2018). They have acquired half stake in Dalco to
diversify into protein and growing vegetarian market, SV Cuisine Ltd to add slow cooked
products in their range, etc. They also have other investments like opening facilities in Poland
3
⊘ This is a preview!⊘
Do you want full access?
Subscribe today to unlock all pages.
Trusted by 1+ million students worldwide

and in Brisbane, Australia and partnership agreements with Tesco UK and Delhaize to pack all
of their read meats (Strategic Report, 2019).
Premier Food Plc – Main focus of company is on achieving profit oriented sustainable
growth model. For this, it has adopted the strategy of cost control. Company management has
recently undergone changes and new board aims to renew the operational processes to improve
profitability and cash flows. All the three companies are from food and drinks industry which
being critical were allowed to remain operational in the pandemic lock-down. However, with
reduced demand and disrupted supply chain, cost increased and compromised profitability. Other
than pandemic, it is also marred by uncertainties caused by unstable political and economic
environment of UK due to confusion over Brexit. However, it has developed policies to tackle it
anyways. It places high value on workforce engagement and development of new product ranges
to attract customers. For example, plant-based recipe brand PLANTASTIC (Strategic report,
2019-20).
Evaluation of financial performance
Below mentioned are comparative analysis of various financial and non-financial ratios of
the three chosen company:
Financial Ratios
Particulars 2019-20 2018-19 2017-18
Greencore Hilton Premier Greencore Hilton Premier Greencore Hilton Premier
Current
Ratio (in
x)
0.69 1.05 0.98 2.01 1.23 0.78 0.75 1.2 0.78
Gearing
(in %)
156.67 175.87 64.91 90.47 66.57 105.83 119.39 36.16 106.9
RoE using
net
income
(in %)
34.66 17.23 2.77 4.55 17.95 -3.51 1.72 15.2 0.76
RoCE
using net
income
19.12 9.02 3.37 4.8 11.98 1.16 2.58 12.43 2.94
4
Paraphrase This Document
Need a fresh take? Get an instant paraphrase of this document with our AI Paraphraser

(in %)
Net
Assets
turnover
(in x)
2.06 3.58 0.32 1.81 5.56 0.42 1.49 6.53 0.42
Collection
period
(days)
26 37 27 34 31 29 30 30 24
Credit
period (in
days)
54 54 65 50 50 65 47 47 59
Profit
margin (in
%)
7.48 2.38 6.33 0.75 2.63 -5.18 0.53 2.52 2.55
Gross
margin (in
%)
33.84 16.17 40.94 30.23 12.69 44.12 31.12 11.93 40.42
EBIT
Margin
(in %)
6.73 3.08 11.25 2.04 2.8 0.55 1.84 2.58 8.48
Non-financial ratios
Particulars 2019-20 2018-19 2017-18
Greencore Hilton Premier Greencore Hilton Premier Greencore Hilton Premier
Shareholders’
funds per
employee
26 38 404 64 38 230 58 44 234
Total assets
per employee
100 181 729 173 121 533 167 116 540
Current Ratio (in x)
5

Hilton has managed steady current ratio all three years however, has showed decrease in
the last year while Premier has also shown steady performance with increase in the last year even
though none of the two is close enough to optimum. Greencore has reached optimum level of 2:1
in 2019 however, for the rest two years has shown wild fluctuations and both down side which is
not good sign for effectiveness of working capital management.
RoE using net income (in %)
It can be clearly observed above that Greencore Group Plc has performed most efficiently
in terms of returns on equity using net income as basis. Performance of Hilton Food Group has
dipped in last year while Premier has the poorest performance in spite that it has managed to
make its ROE positive in last year.
6
⊘ This is a preview!⊘
Do you want full access?
Subscribe today to unlock all pages.
Trusted by 1+ million students worldwide
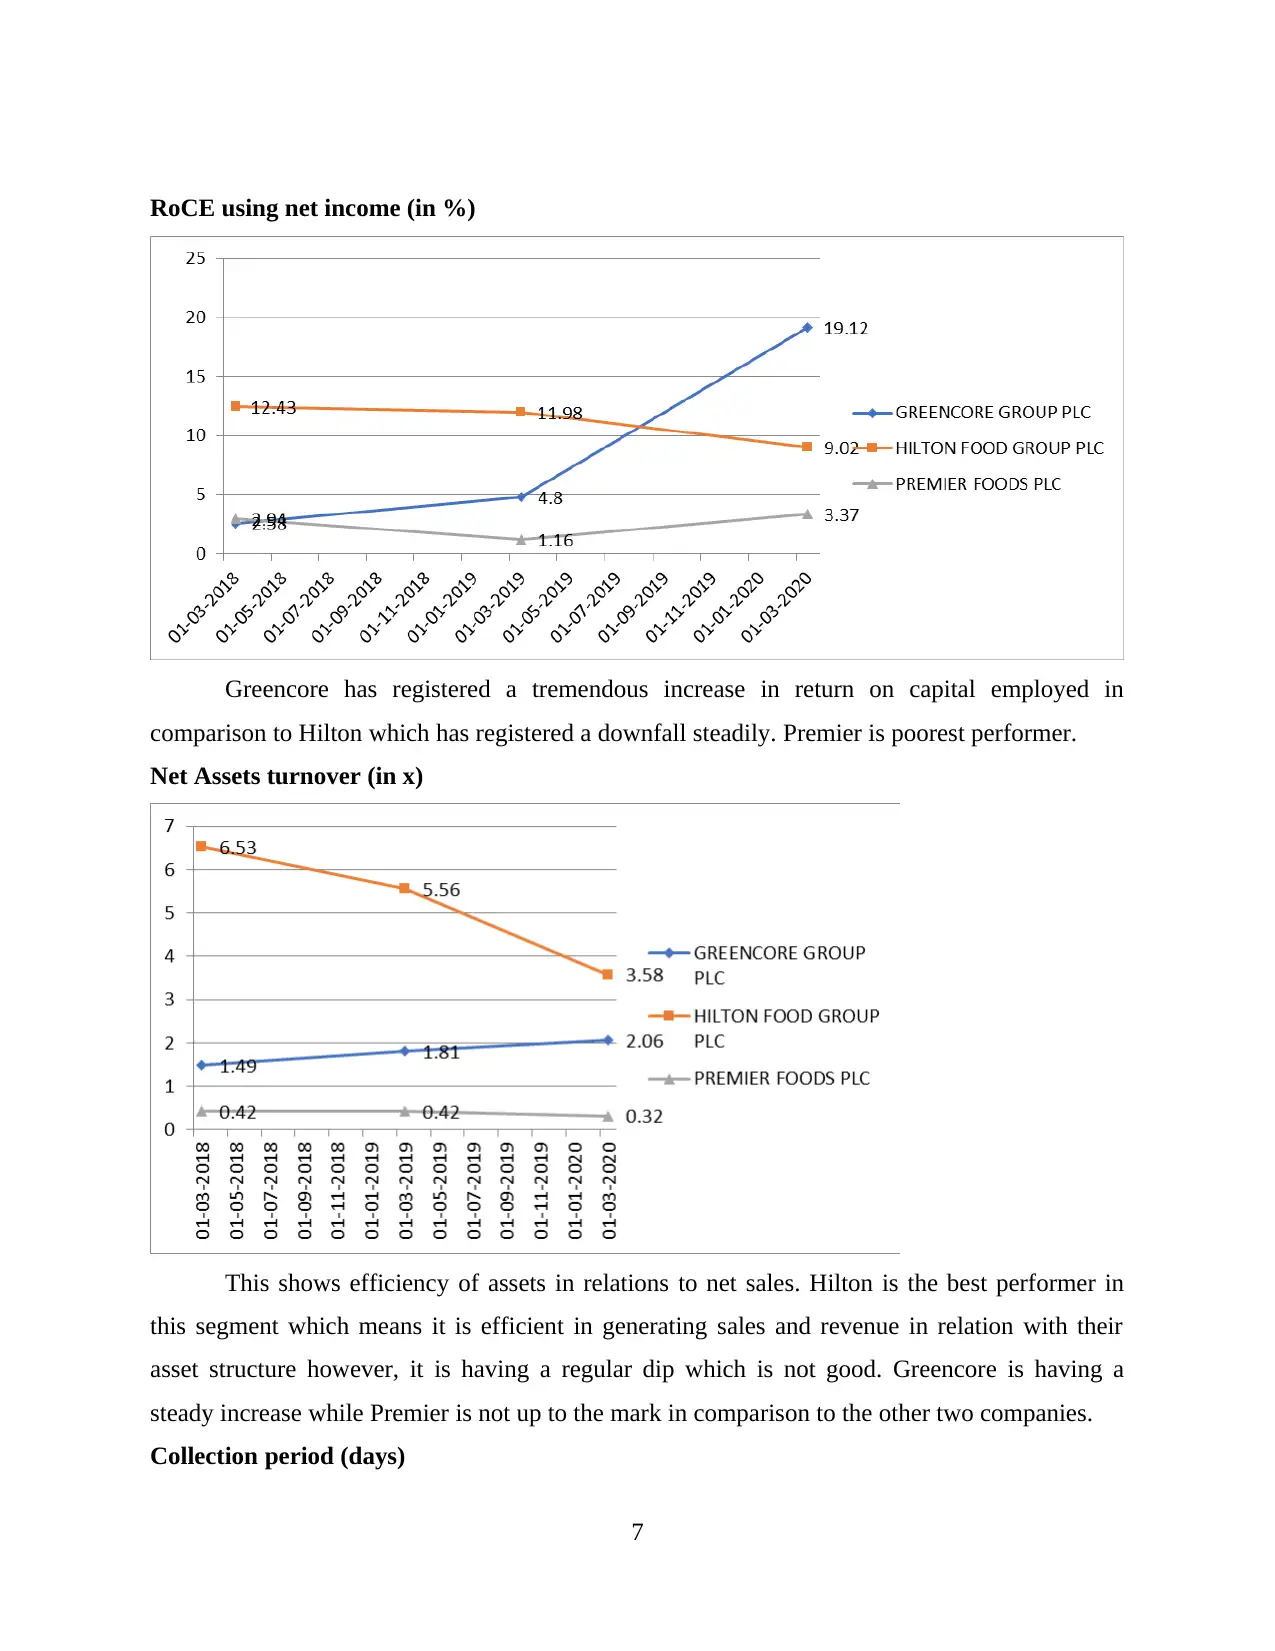
RoCE using net income (in %)
Greencore has registered a tremendous increase in return on capital employed in
comparison to Hilton which has registered a downfall steadily. Premier is poorest performer.
Net Assets turnover (in x)
This shows efficiency of assets in relations to net sales. Hilton is the best performer in
this segment which means it is efficient in generating sales and revenue in relation with their
asset structure however, it is having a regular dip which is not good. Greencore is having a
steady increase while Premier is not up to the mark in comparison to the other two companies.
Collection period (days)
7
Paraphrase This Document
Need a fresh take? Get an instant paraphrase of this document with our AI Paraphraser

Premier has the best result in absolute terms in this segment as they take least days to
collect their receivables. However, in comparative terms, company has seen increase in their
collection period in 2019 to improve again in 2020. But it still has not attained its best
performance again which is not good sign. On the other side, Hilton has shown poorest
performance as its collection period is most and keeps on increasing. Greencore has shown
increase in 2019 but has then improved their performance to their best.
Credit period (in days)
Both Greencore and Hilton have the same trajectory as they follow same credit to return
money of creditors. Premier on the other hand aces both of them by having upped trajectory of
paying creditors and saving interest in the business for the longer time.
8

Net Profit margin (in %)
Premier Foods Plc has performed best in net profit margin as it was in loss in 2019 while
it has registered a good profit margin in 2020 which can be attributed to their operational
efficiency and increased sales. Hilton has been the poorest performer in this segment.
Gross margin (in %)
Only Hilton has registered a continuous growth on their annual gross profit margin.
Greencore has registered a dip in 2019 to register improvement in 2020 again while Premier
though has highest gross profit margin of three, has shown fluctuations every year and combined
with their net profit margin shows inefficiencies in operations of company.
EBIT margin (in %)
9
⊘ This is a preview!⊘
Do you want full access?
Subscribe today to unlock all pages.
Trusted by 1+ million students worldwide

Greencore has shown best performance in EBIT margin while Hilton has also shown
steady increase in all three years. On the other hand, Premier has shown wild fluctuations in its
performance but is a model company in recovery in performance as it has covered almost ten-
point range in improvement in a year.
Shareholders’ funds per employee
It is a non-financial ratio and checks the efficiency of business shareholders’ fund in
relation with total employees (Oh and Park, 2015). Premier uses its workforce most efficiently
while rest of the two companies lag so much behind.
Total assets per employee
10
Paraphrase This Document
Need a fresh take? Get an instant paraphrase of this document with our AI Paraphraser

It is a non-financial ratio and checks the effectiveness of usage of assets of the business in
line with total employees (Flower and Ebbers, 2018). Again, Premier manages its workforce at
far better level than other two companies. Hilton is steadily improving while Greencore has
shown ineffectiveness in their performance in last year.
Based on financial performance analysis – Greencore Group Plc stands first followed by
Hilton Food Group Plc and then Premier Foods Plc while in non-financial performance analysis,
Premier far outweighs both others. It stands first, followed by Hilton and Greencore at third.
Investment opportunity
Based on ranking, Greencore has been first option to be evaluated for investment purpose.
However, other two also being London Stock Exchange Companies, performs well in their
individual analysis but Greencore has an edge in comparative analysis. Greencore has been
constantly improving its processes and has been delivering steady performances but while
considering investment opportunities, market conditions must not be ignored. Companies are still
struggling to figure out ways to get back their previous or pre-Covid-19 pandemic operations and
sales. Also, they are still uncertain about Brexit policies and their impact on the trade deals and
negotiations that company have with companies and market outside Britain in European Union.
11

Section B
Sources of internal and external long-term finances
Long-term finances of a company are generally large amount finances which are either
raised to ensure smoothness of operational process or for specific projects that are aimed at
growth and expansion (Epstein, Buhovac and Yuthas, 2015). A company can exercise a mix of
internal sources and external sources of finance to achieve its optimum finance mix.
Internal sources
Retained earnings – It refers to the amount set aside from profit available for shareholders
post dividend announcement. It is characterised by no cost of finance and no security attached.
Therefore, they are economical for company however being, an internal source of finance, it is
available in limited amount. It can be put to any use and is generally risk-free. Hilton has 33, 065
GBP profit in 2019 out of which 13, 504 GBP is kept aside post dividend payment. It is a risk-
free source of finance which company can put to use for even working capital requirement. It
will help company in facilitating smooth cash flows.
Sale of assets – It is collection of funds from disposal of extra assets of the company.
Company can generate required capital internally this way and will also be able to optimise its
asset mix. Companies generally provide for depreciation and asset replacement reserve to
identify those assets which are near obsoletion and must be disposed of (Kohler, 2016). This is
also cost-free finance source. However, like other internal sources, it also presents limited
amount. Sale proceeds carry only one risk that they will not be able to fetch expected amount.
Although, generally these proceeds are used to replace assets so they are not able to be used for
free cash flow or working capital requirement.
External sources
Debentures – These are debt instruments issued by companies in the market to raise
funds. They carry a fixed cost of finance and are issued for a limited time post which they have
to be redeemed. They are available in different type such as fixed, convertible, non-convertible
etc. Advantage is that interest paid to debenture holders is tax deductible expense and they do not
create any ownership impact or dilute equity ownership. But, since they are mandatory charge,
company cannot default on interest payment or redemption which will have negative impact on
its market credibility. These are generally issued to finance specific projects and therefore, do not
create free cash flows. They carry both systematic and non-systematic risk with them. For
12
⊘ This is a preview!⊘
Do you want full access?
Subscribe today to unlock all pages.
Trusted by 1+ million students worldwide
1 out of 15
Related Documents


Your All-in-One AI-Powered Toolkit for Academic Success.
+13062052269
info@desklib.com
Available 24*7 on WhatsApp / Email
![[object Object]](/_next/static/media/star-bottom.7253800d.svg)
Unlock your academic potential
Copyright © 2020–2026 A2Z Services. All Rights Reserved. Developed and managed by ZUCOL.