Financial Analysis Report: James Halstead Plc. Performance Evaluation
VerifiedAdded on 2022/08/14
|18
|3516
|15
Report
AI Summary
This report presents a financial analysis of James Halstead Plc., a manufacturing and distribution company specializing in flooring products. The analysis utilizes various financial tools, including ratio analysis, to evaluate the company's performance over a three-year period. The report begins with an introduction to financial analysis and the economic factors impacting businesses, followed by a SWOT analysis of James Halstead Plc. The core of the report focuses on ratio analysis, calculating and interpreting key metrics such as Return on Capital Employed, Net Profit Margin, Current Ratio, Trade Receivables Days, Trade Payables Days, and Efficiency Ratio. The analysis examines trends and provides insights into the company's financial health, including its profitability, liquidity, and efficiency. The report concludes with recommendations for improvement, focusing on optimizing the company's payment terms, investment in current assets, and the effective use of equity to ensure future business success. Economic factors like GDP and competitor analysis were also discussed for their impact on the company's financial performance.

Financial Management
Paraphrase This Document
Need a fresh take? Get an instant paraphrase of this document with our AI Paraphraser
FINANCE 1
Executive Summary
The main aim of this report is to understand the concept of financial analysis. In this paper,
James Halstead Plc. has been taken into consideration to evaluate the financial performance. As
per the Economic factor, GDP is the macro factor or competitors are the micro factor that has a
positive or negative impact on the organization. According to ratio analysis, it is estimated that
the financial position of the company is strong in terms of generating the profit or collecting the
amount. The company pays the obligation amount in large time that affects its business. At the
end, it is suggested that the company has to focus on its paying days, invest in current assets and
the uses of equity properly for future success in business.
FINANCE 2
Contents
Introduction......................................................................................................................................3
SWOT Analysis...............................................................................................................................3
Ratio’s Analysis...............................................................................................................................5
Importance of Ratio’s......................................................................................................................7
Stakeholder risk.............................................................................................................................12
Recommendations..........................................................................................................................12
Conclusion.....................................................................................................................................13
References......................................................................................................................................15
⊘ This is a preview!⊘
Do you want full access?
Subscribe today to unlock all pages.
Trusted by 1+ million students worldwide
FINANCE 3
Introduction
Financial analysis is the procedure of analyzing, summarizing and evaluating the financial
position of the organization. It is required for the companies to determine the financial situation
with the help of different tools or techniques such as Ratio analysis, horizontal analysis, vertical
analysis and the others (Schroeder, Clark, and Cathey, 2019). In this paper, the discussion is
based on the topic “financial analysis”. In this report, economic factors will also be discussed
that impact the business of the organization. In this report, ratio analysis will be used to evaluate
the financial performance of the firm. James Halstead plc has been taken into consideration to
determine the financial position. James Halstead plc is a manufacturing and distribution
company of flooring products. It manufactures the wide range of brands in commercial, contract
and consumers flooring (James Halstead Plc., 2019).
SWOT Analysis
Strength
It has good brand image in its industry.
High experience to operate the business
by providing high quality services.
Weaknesses
Competitors are the main weakness of
the company.
New technology is also a weakness as it
has to update with new technology.
Threat
It has been found that there are
numerous companies that provide the
similar services to consumers in the
Opportunities
It has been seen that the economy of
United Kingdom is strong as the GDP
per capita of the nation is 39,720.44
Paraphrase This Document
Need a fresh take? Get an instant paraphrase of this document with our AI Paraphraser
FINANCE 4
similar industry. The main competitors
of the company are James Fishers and
Sons, Severfield Plc., Tyman Plc.,
Marshalls Plc, and the others.
USD; GDP growth rate is 1.8% annual
changes (Trading Economics, 2020).
The willingness of consumers has been
increases to purchase the product. It has
the opportunity for the company to
expand the business with new products.
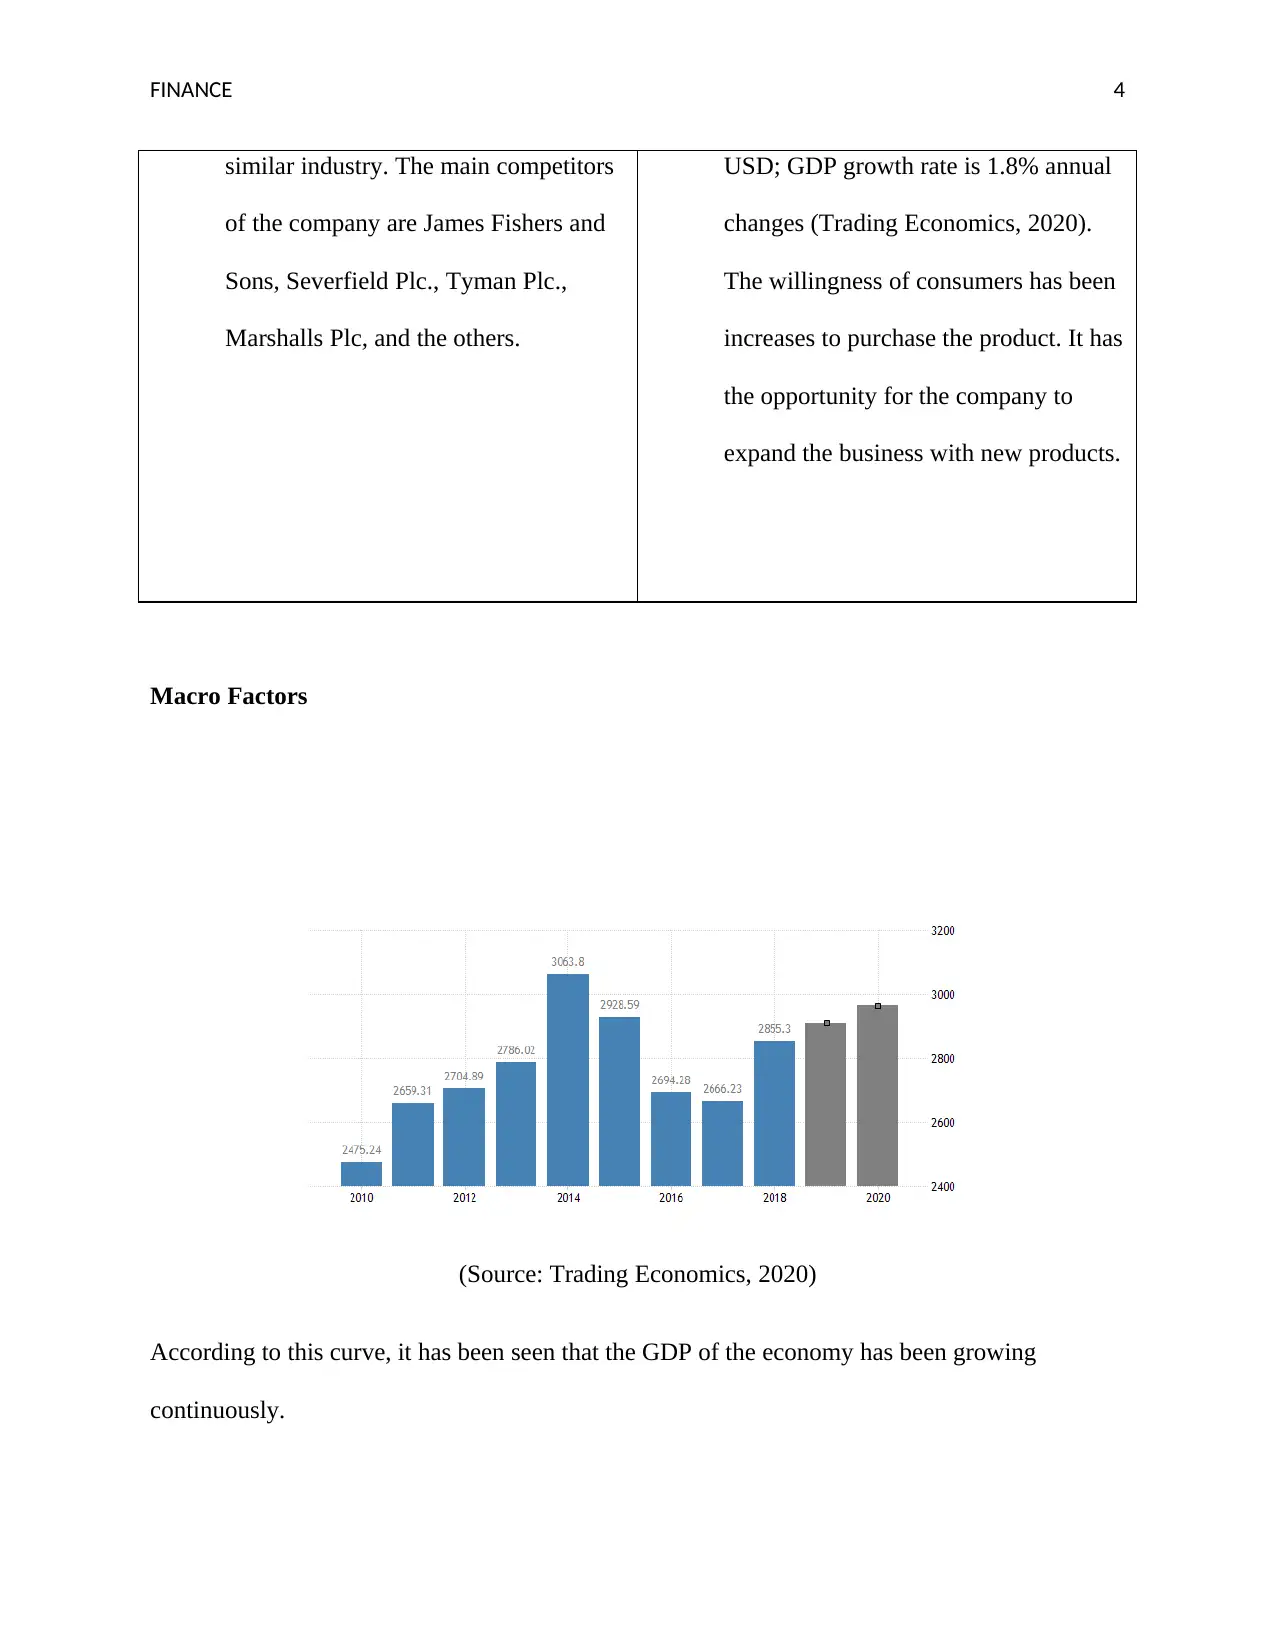
Macro Factors
(Source: Trading Economics, 2020)
According to this curve, it has been seen that the GDP of the economy has been growing
continuously.
similar industry. The main competitors
of the company are James Fishers and
Sons, Severfield Plc., Tyman Plc.,
Marshalls Plc, and the others.
USD; GDP growth rate is 1.8% annual
changes (Trading Economics, 2020).
The willingness of consumers has been
increases to purchase the product. It has
the opportunity for the company to
expand the business with new products.
Macro Factors
(Source: Trading Economics, 2020)
According to this curve, it has been seen that the GDP of the economy has been growing
continuously.
FINANCE 5
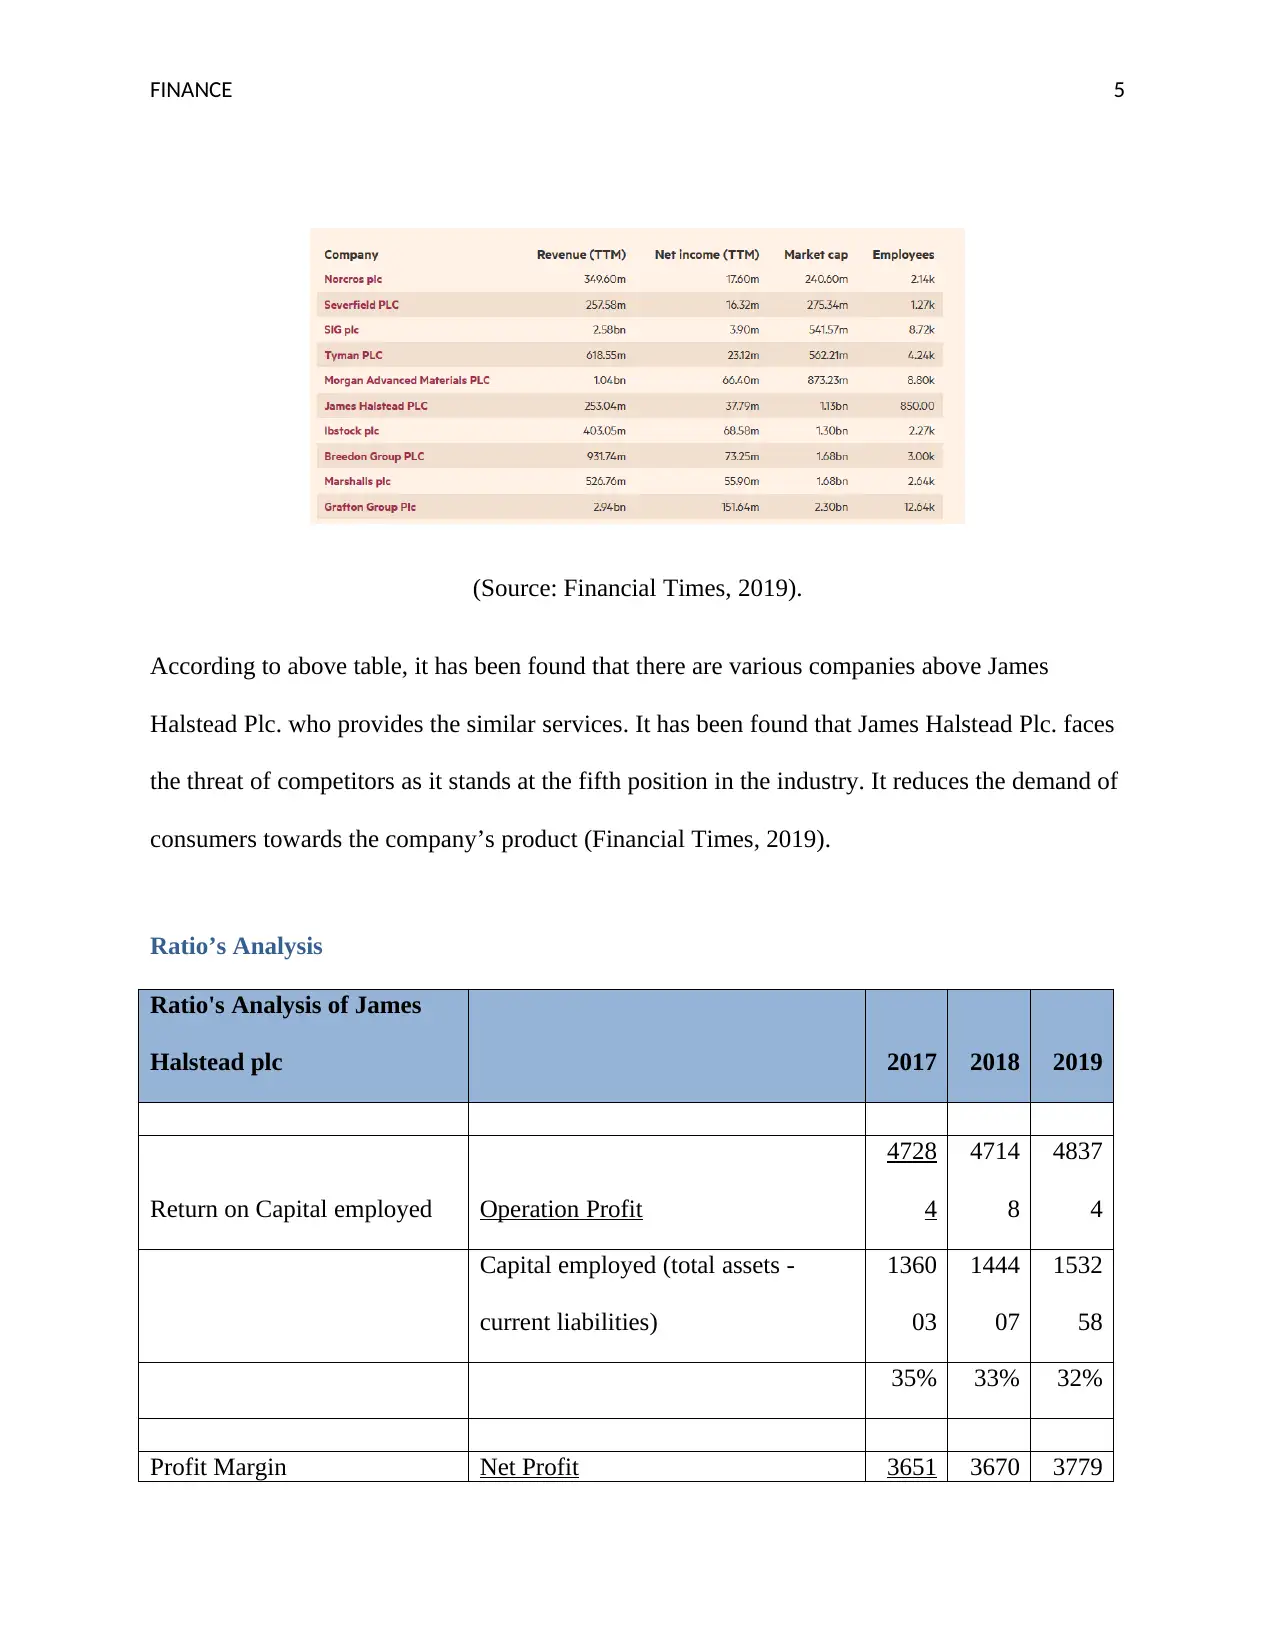
(Source: Financial Times, 2019).
According to above table, it has been found that there are various companies above James
Halstead Plc. who provides the similar services. It has been found that James Halstead Plc. faces
the threat of competitors as it stands at the fifth position in the industry. It reduces the demand of
consumers towards the company’s product (Financial Times, 2019).
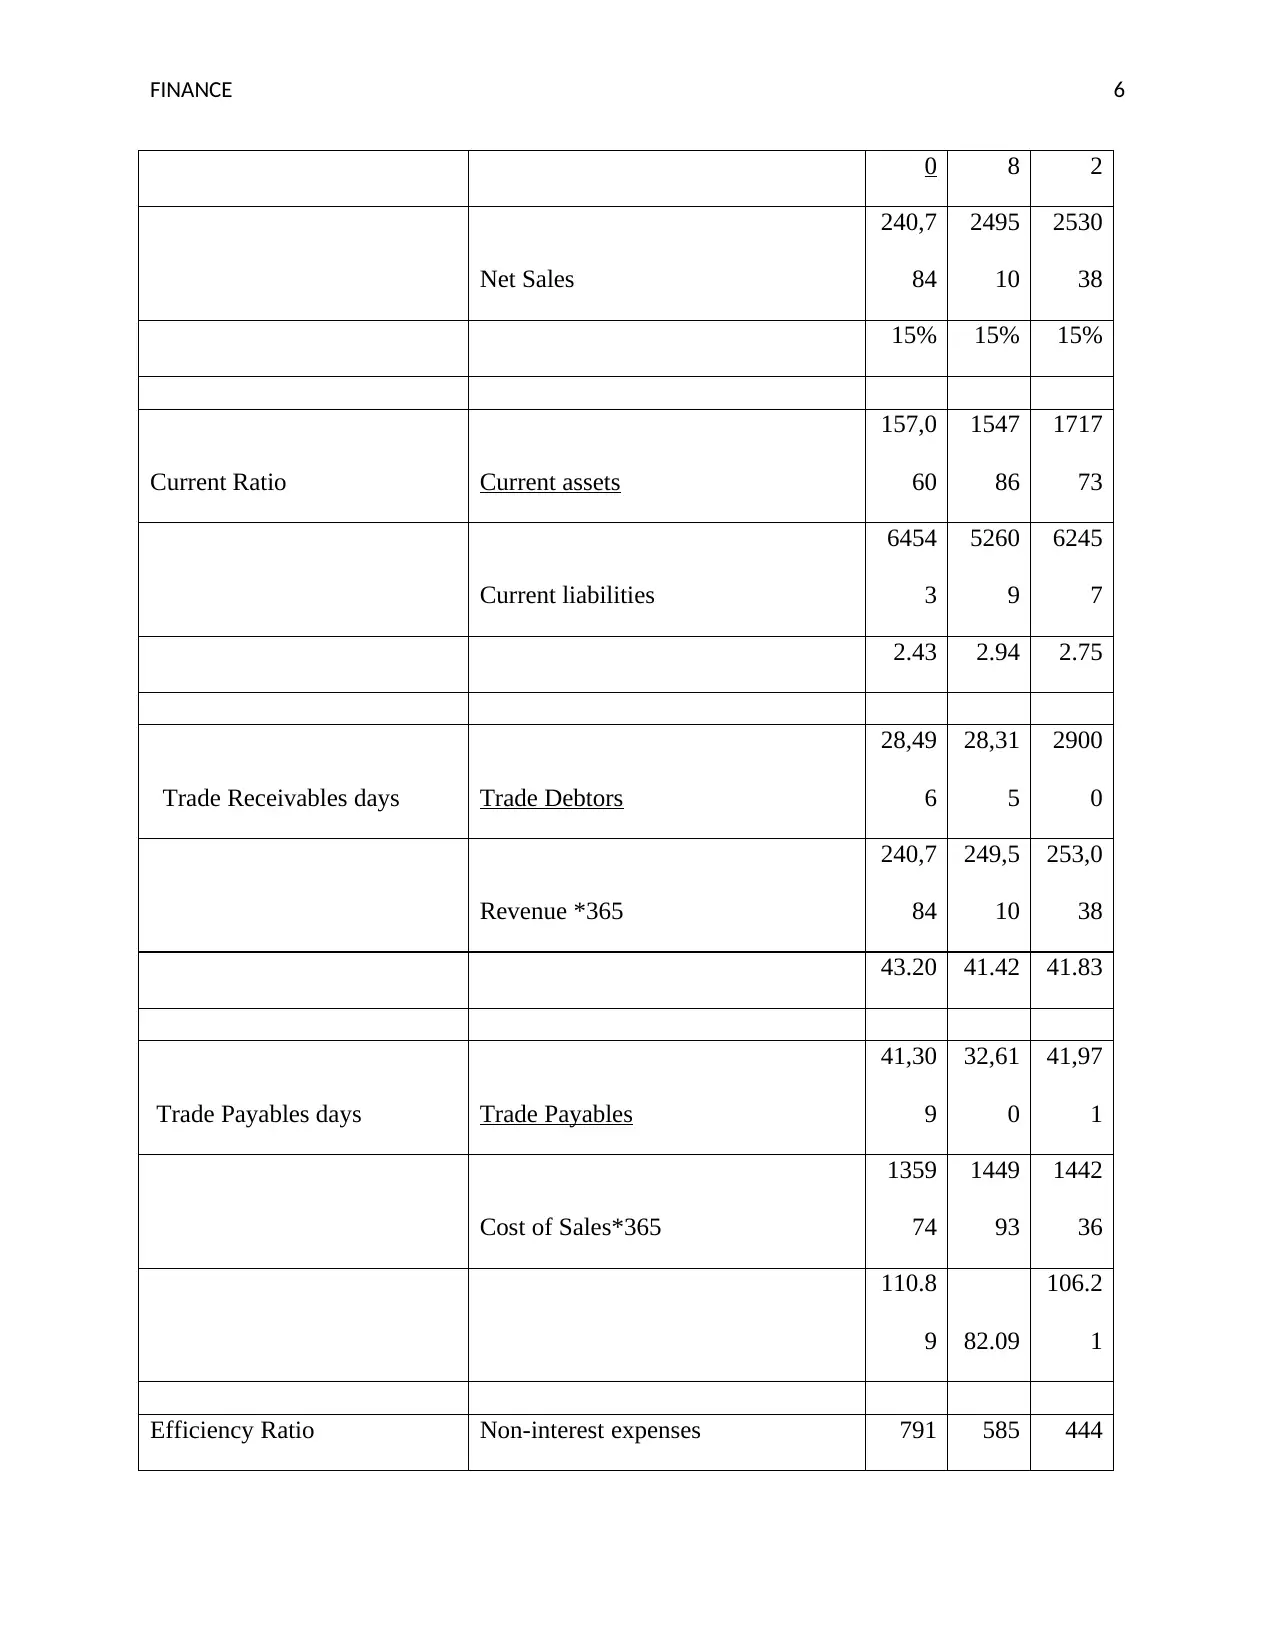
Ratio’s Analysis
Ratio's Analysis of James
Halstead plc 2017 2018 2019
Return on Capital employed Operation Profit
4728
4
4714
8
4837
4
Capital employed (total assets -
current liabilities)
1360
03
1444
07
1532
58
35% 33% 32%
Profit Margin Net Profit 3651 3670 3779
(Source: Financial Times, 2019).
According to above table, it has been found that there are various companies above James
Halstead Plc. who provides the similar services. It has been found that James Halstead Plc. faces
the threat of competitors as it stands at the fifth position in the industry. It reduces the demand of
consumers towards the company’s product (Financial Times, 2019).
Ratio’s Analysis
Ratio's Analysis of James
Halstead plc 2017 2018 2019
Return on Capital employed Operation Profit
4728
4
4714
8
4837
4
Capital employed (total assets -
current liabilities)
1360
03
1444
07
1532
58
35% 33% 32%
Profit Margin Net Profit 3651 3670 3779
⊘ This is a preview!⊘
Do you want full access?
Subscribe today to unlock all pages.
Trusted by 1+ million students worldwide
FINANCE 6
0 8 2
Net Sales
240,7
84
2495
10
2530
38
15% 15% 15%
Current Ratio Current assets
157,0
60
1547
86
1717
73
Current liabilities
6454
3
5260
9
6245
7
2.43 2.94 2.75
Trade Receivables days Trade Debtors
28,49
6
28,31
5
2900
0
Revenue *365
240,7
84
249,5
10
253,0
38
43.20 41.42 41.83
Trade Payables days Trade Payables
41,30
9
32,61
0
41,97
1
Cost of Sales*365
1359
74
1449
93
1442
36
110.8
9 82.09
106.2
1
Efficiency Ratio Non-interest expenses 791 585 444
Paraphrase This Document
Need a fresh take? Get an instant paraphrase of this document with our AI Paraphraser
FINANCE 7
(Operating income-loss loan
provisions)
3651
0
3670
8
3779
2
7.91 5.82 4.29
(Source: Yahoo Finance, 2019)
Importance of Ratio’s
Return on Capital employed:
Return on Capital employed is an accounting ratio which is used to examine the profitability of
the company by using the capital. It is necessary for the company to determine that where it uses
the amount of capital to generate the revenue. The higher ROE ratio of the company states that
the company uses the shareholders money more effectively to enhance the financial
performance. It is required for the company to evaluate the effectiveness of uses of funds so that
it uses funds properly and effectively. It is also beneficial for the investors to get the information
for investing in the company (Schroeder, Clark, and Cathey, 2019).
By evaluating the return on capital employed ratio, it has been seen that the percentage of return
on capital employed has been decreases from the previous year’s such as 35%, 33%, and 32% in
the year 2017, 2018 and 2019 respectively. It is observed that the percentage of return on equity
is good for operation as 20% of return on capital employed is considered as profitable. But it has
been found that the percentage of return on capital employed has been decreases which states
that the capacity to provide the return to shareholders is also decreasing. The decreasing ratio of
capital employed reflects that the company is not able to generate profit due to which it is not
able to provide the good amount of return to its shareholders. As it does not gives the return to
FINANCE 8
shareholders due to which they are not investing in the company. The less number of
shareholders states that the company has less amount of investment due to which it is not able to
expand the amount in business activities (Johnston, 2018).
Net Profit Margin
Net profit margin ratio measures the profitability in order to generate the profit by using sales.
The company has to examine the net profit margin ratio to evaluate the volume of sales from
which it generates the sales. Each and every year, the company has to upload its financial
position according to financial data on website and net profit margin ratio helps to evaluate the
success of business. This ratio contains the net profit after all the deduction such as sales
allowances which is beneficial for the company in order to control the expenses to enhance the
financial position (Accounting Tools, 2019).
It has been evaluated that the company profit margin ratio is constant in all the three years such
as 15% in all last three years 2017, 2018 and 2019 respectively. The amount of net profit has
been increases with the increasing amount of net sales in the past three years such as the amount
of net profit are 36510 , 36708, and 37792 and the amount of net sales are 240784,
249510 and 253038 in three years 2017, 2018 and 2019 in respective manner. It states that the
company profit has been increases with the low margin due to increasing the volume of sales
with the increasing profit margin. It is beneficial for the company as the percentage of net profit
is constant as it does not decrease. Although, the perfect net margin is 10% or above from it is
considered as excellent net profit margin percentage that is why; the 15% percentage of net profit
margin reflects that the company financial position is strong (O'Hare, 2016).
Current Ratio
⊘ This is a preview!⊘
Do you want full access?
Subscribe today to unlock all pages.
Trusted by 1+ million students worldwide
FINANCE 9
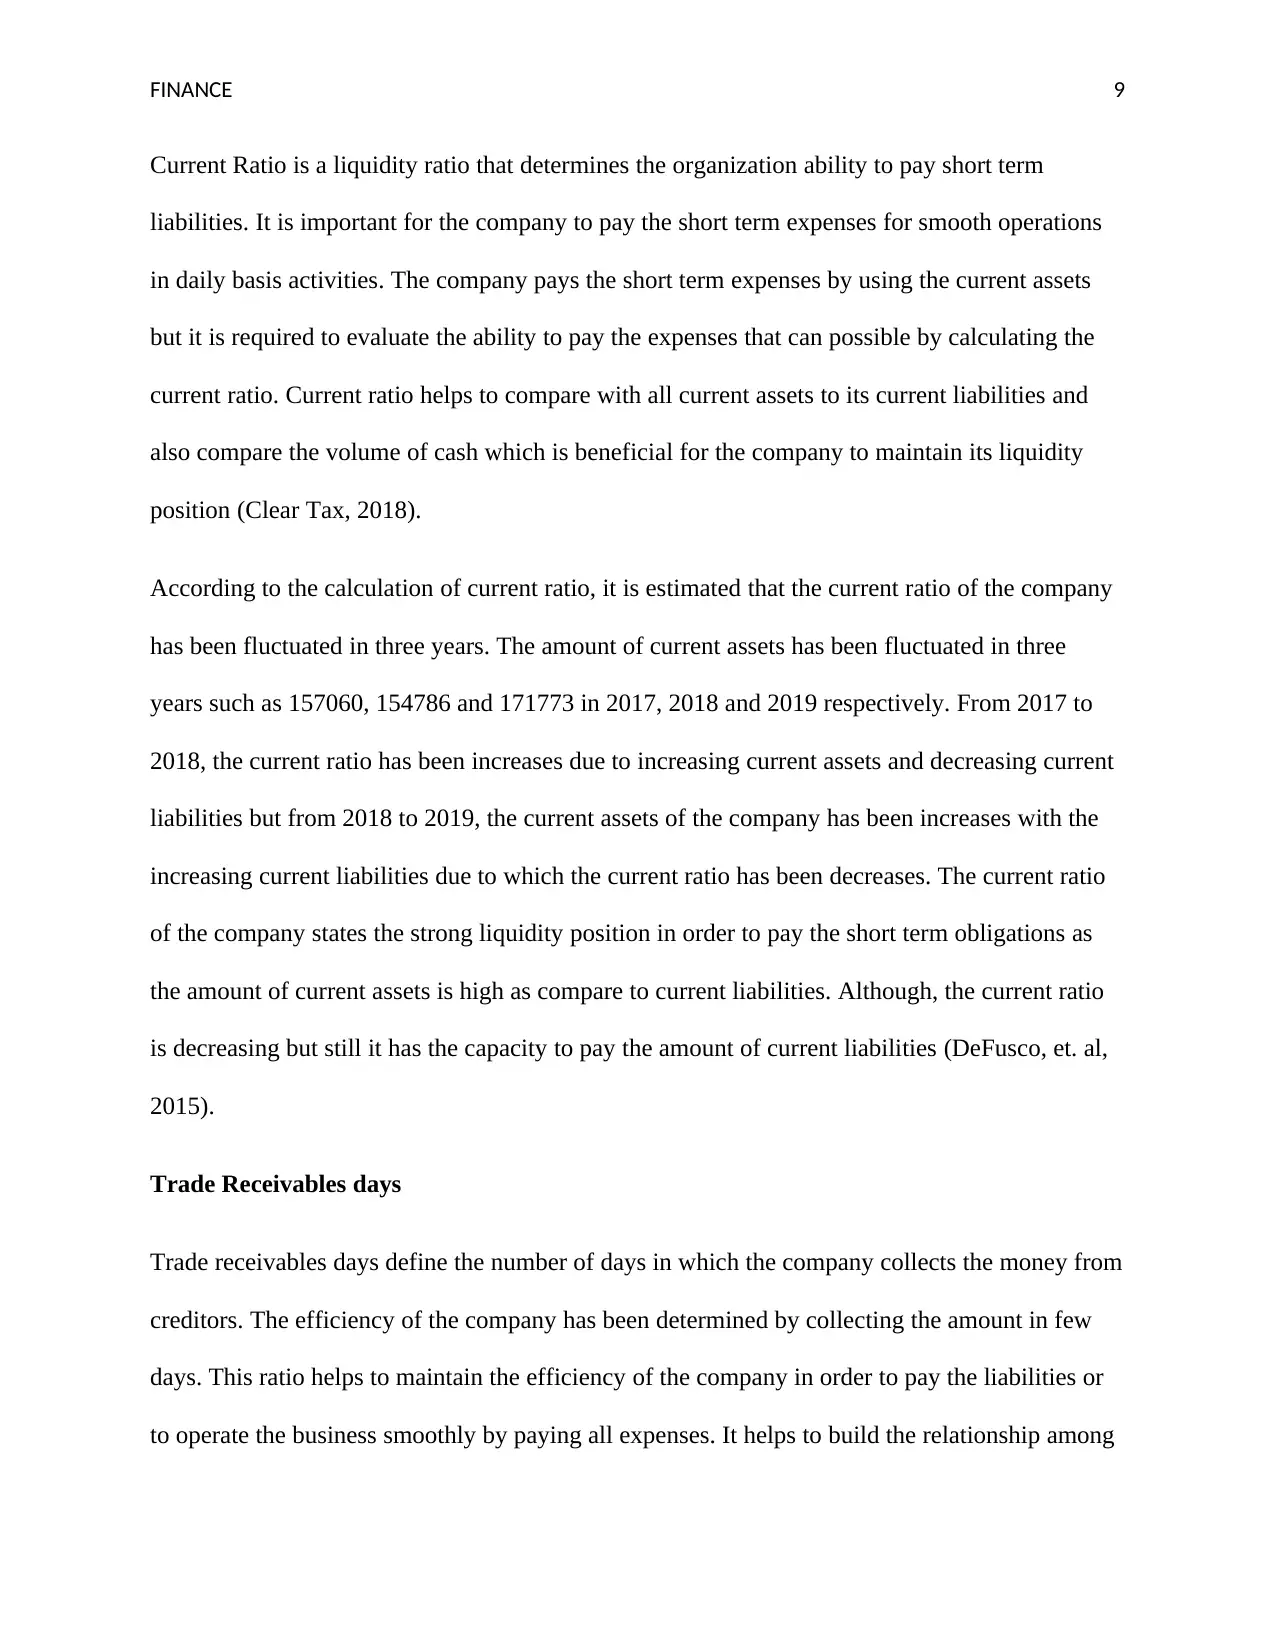
Current Ratio is a liquidity ratio that determines the organization ability to pay short term
liabilities. It is important for the company to pay the short term expenses for smooth operations
in daily basis activities. The company pays the short term expenses by using the current assets
but it is required to evaluate the ability to pay the expenses that can possible by calculating the
current ratio. Current ratio helps to compare with all current assets to its current liabilities and
also compare the volume of cash which is beneficial for the company to maintain its liquidity
position (Clear Tax, 2018).
According to the calculation of current ratio, it is estimated that the current ratio of the company
has been fluctuated in three years. The amount of current assets has been fluctuated in three
years such as 157060, 154786 and 171773 in 2017, 2018 and 2019 respectively. From 2017 to
2018, the current ratio has been increases due to increasing current assets and decreasing current
liabilities but from 2018 to 2019, the current assets of the company has been increases with the
increasing current liabilities due to which the current ratio has been decreases. The current ratio
of the company states the strong liquidity position in order to pay the short term obligations as
the amount of current assets is high as compare to current liabilities. Although, the current ratio
is decreasing but still it has the capacity to pay the amount of current liabilities (DeFusco, et. al,
2015).
Trade Receivables days
Trade receivables days define the number of days in which the company collects the money from
creditors. The efficiency of the company has been determined by collecting the amount in few
days. This ratio helps to maintain the efficiency of the company in order to pay the liabilities or
to operate the business smoothly by paying all expenses. It helps to build the relationship among
Paraphrase This Document
Need a fresh take? Get an instant paraphrase of this document with our AI Paraphraser
FINANCE 10
the suppliers in order to pay all the expenses or bills in minimum days. It is essential for the
company to evaluate the ratio for building the relationship with suppliers that directly helps to
operate the business for long term (Akers, 2019).
As per the evaluation of ratio, it has been found that James Halstead Plc. collects the money from
debtors in 43.20, 41.42 and 41.83 days in the past three years in 2017, 2018 and 2019 in
respective manner. The ratio states that the company collects the receivables amount in few days
as the number of days has been decreases continuously. It is good for the company to collect the
amount in fewer days as it helps to pay the liabilities amount in very short period of time. The
efficiency ratio of the company is marinated due to collecting the amount in few days. The
company can pay the liability amount but also use this money to pay the expenses (Robinson,
2020).
Trade Payables days
Trade Payable Days determine the days in which the company pay the liability amount. This
ratio helps to determine the payable days in order to estimate the efficiency. It is required for the
company to estimate the efficiency in order to develop its brand image. Apart from it, it is also
necessary for the company to build the strong relation with the suppliers or creditors to operate
smoothly in the market. It can be possible for the company when it pays the amount to creditors
in few days. By evaluating this ratio, the company can also measure its efficiency that helps to
gain the competitive advantage (CFI, 2019).
Trade Payable Days ratio of the company states James Halstead Plc. pay the amount of
obligations in 110.89, 82.09 and 106.21days in the past three years 2017, 2018 and
FINANCE 11
2019. The trade payable day’s ratio of the company has been fluctuated from the previous years.
From 2017 to 2018, the paying amount has been decreases from 110.89 to 82.09 days due to
decreasing the trade payables but in 2019, the company pays the amount in 106.21 days which is
more as compare to the last years. As the company collects the amount in few days and pay in
large days helps to maintain the cash in hand which is beneficial for operating the business
effectively by paying the daily routine expenses. But paying the amount in large days affects its
brand image in terms of relation of building relationship with the suppliers. If the suppliers do
not get the money on time then the relation with the company has been affected (Gupta, 2016).
Efficiency Ratio
Efficiency Ratio measures the time of the company to pay the interest expenses by using the
operating income. This ratio has been evaluated by dividing the company earnings before interest
and taxes by the company interest expenses. It has been found that the interest expenses is the
obligation for the company which is required to pay on the borrowing amount on time but if the
company fails to pay the interest expense amount on time then it can face the challenges. It is
essential for the company to pay the interest amount on time and this ratio helps to measure the
recovery time that is why; it is necessary to evaluate this ratio for business (Finance
Management, 2019).
As per the evaluation of efficiency ratio of James Halstead Plc, it has been determined that the
company pays the interest expenses in few days as its financial position is improving. The
interest expenses ratio of the company has been decreases 7.91, 5.82 and 4.29 times in 2017,
2018 and 2019. It states that the company pays the amount of interest expenses in few days
which is also decreasing in three continuously years. It has estimated that the company capability
⊘ This is a preview!⊘
Do you want full access?
Subscribe today to unlock all pages.
Trusted by 1+ million students worldwide
1 out of 18
Related Documents


Your All-in-One AI-Powered Toolkit for Academic Success.
+13062052269
info@desklib.com
Available 24*7 on WhatsApp / Email
![[object Object]](/_next/static/media/star-bottom.7253800d.svg)
Unlock your academic potential
Copyright © 2020–2026 A2Z Services. All Rights Reserved. Developed and managed by ZUCOL.