Module: Managing Financial Performance - Financial Analysis Report
VerifiedAdded on 2023/01/11
|26
|5936
|25
Report
AI Summary
This report presents a comprehensive financial performance analysis of Sainsbury's and Tesco, comparing their financial health over a period of time. The analysis includes vertical and horizontal trend analysis, along with a detailed examination of profitability, liquidity, efficiency, and gearing ratios. The report further delves into marginal costing, capital budgeting techniques (Net Present Value, Payback Period, and Internal Rate of Return), and provides recommendations based on the findings. Additionally, it touches upon corporate social responsibility (CSR) policies. The student reflects on their learning experience and skill development throughout the assignment, highlighting the challenges faced and improvements made during the re-submission process. The report utilizes financial data to assess the companies' performance, providing valuable insights for financial management and decision-making.
Complete the details marked in the coloured text and leave everything else blank. Where appropriate, copy and paste your
submission after the first pages as indicated. You are reminded of the University regulations on cheating. Except
where the assessment is group-based, the final piece of work which is submitted must be your own work.
Close similarity between submissions is likely to lead to an investigation for cheating. You must submit a
file in an MSWord or equivalent format as tutors will use MSWord to provide feedback including, where
appropriate, annotations in the text.
Student Name Do not complete if subject to anonymous marking Reasonable Adjustments
Student Number Check this box [x] if the Faculty has
notified you that you are eligible for a
Reasonable Adjustment (including
additional time) in relation to the
marking of this assessment. Please
note that action may be taken under the
University’s Student Disciplinary
Procedure against any student making
a false claim for Reasonable
Adjustments.
Course and Year
Module Code
Module Title
Module Tutor
Personal Tutor
First Marker
Name:
First Marker
Signature: Date:
Feedback: General comments on the quality of the work, its successes and where it could be improved
Provisional Uncapped
MarkMarks will be capped if
this was a late submission or
resit assessment and may be
moderated up or down by the
examination board.
%
Feed Forward:How to apply the feedback to future submissions
Quality and use of Standard English and Academic Conventions
Spelling Errors Style is Colloquial Standard is a Cause for Concern
Grammatical Errors Inappropriate Structure If the box above has been ticked you should arrange
a consultation with a member of staff from the Centre
for Academic Success viaPunctuation Errors Inadequate Referencing
Moderation Comments (Please note that moderation is carried out through ‘sampling’. If this section is left blank, your work is not part of the sample.)
Moderation is done via sampling. Your work was not part of the sample.
Moderator Name: Moderator Date:
1
Paraphrase This Document
Need a fresh take? Get an instant paraphrase of this document with our AI Paraphraser
Signature:
Marking Criteria – Please study this page carefully
0 – 39%
Fail
40 – 49%
Fail
50 – 59%
Pass
60 – 69%
Strong Pass
(merit)
70 – 79%
Very Strong
Pass
(distinction)
80 – 100%
Exceptionally
Strong Pass
(distinction)
Criterion 1
Mark:
Criterion 2
Mark:
Criterion 3
Mark:
Criterion 4
Mark:
.
0 – 39%
Fail
40 – 49%
Pass
3rd
50 – 59%
Pass
2:2
60 – 69%
Pass
2:1
70 – 100%
Pass
1st
Criterion 1
Mark:
Criterion 2
Mark:
Criterion 3
Mark:
Criterion 4
Mark:
2
Managing Financial
Performance
3
Performance
3
⊘ This is a preview!⊘
Do you want full access?
Subscribe today to unlock all pages.
Trusted by 1+ million students worldwide
INTRODUCTION...........................................................................................................................1
Critical personal reflection..............................................................................................................1
MAIN BODY..................................................................................................................................2
Question 1........................................................................................................................................2
1. Vertical trend analysis.............................................................................................................2
2. Horizontal trend analysis.........................................................................................................4
3. Profitability ratio analysis........................................................................................................5
4. Liquidity ratio analysis............................................................................................................7
5. Efficiency ratio analysis..........................................................................................................9
6. Gearing ratio analysis............................................................................................................10
Question 2......................................................................................................................................11
4
Paraphrase This Document
Need a fresh take? Get an instant paraphrase of this document with our AI Paraphraser
Part A.............................................................................................................................................11
1. Calculate the contribution of each product............................................................................11
2. Company should stop making product Y..............................................................................12
3. Company should stop making product Z...............................................................................12
4. Discuss how marginal costing calculates and why it is beneficial to calculate product value
of firm........................................................................................................................................12
5. Discuss that profitability will improve by ceasing to make Products Y and Z and what
should company do to improve profitability.............................................................................12
Part B.............................................................................................................................................13
1. Net Present Value..................................................................................................................13
2. Payback Period......................................................................................................................14
3. Internal Rate of Return..........................................................................................................14
4. Recommendation...................................................................................................................15
5. Critically discuss the limitations of project appraisal techniques..........................................15
Question 3......................................................................................................................................15
CONCLUSION..............................................................................................................................18
REFERENCES..............................................................................................................................19
5
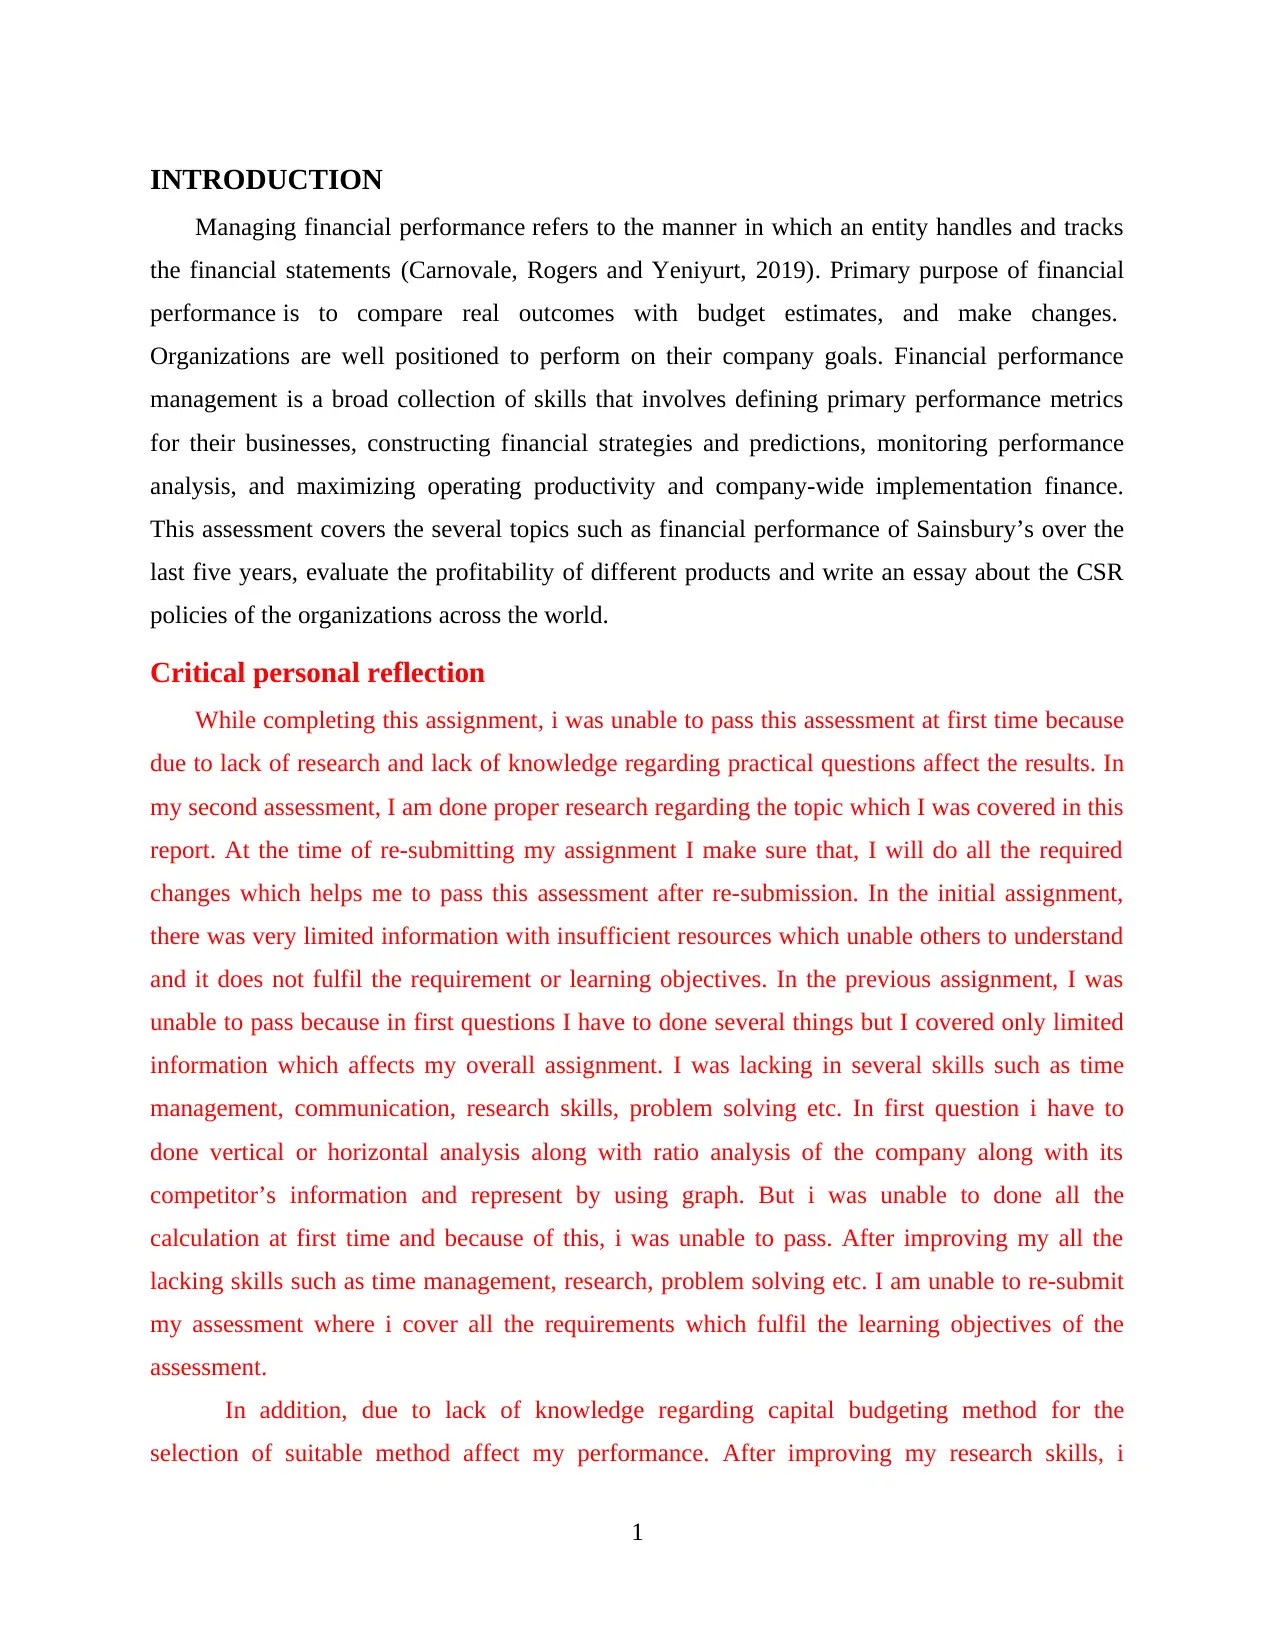
INTRODUCTION
Managing financial performance refers to the manner in which an entity handles and tracks
the financial statements (Carnovale, Rogers and Yeniyurt, 2019). Primary purpose of financial
performance is to compare real outcomes with budget estimates, and make changes.
Organizations are well positioned to perform on their company goals. Financial performance
management is a broad collection of skills that involves defining primary performance metrics
for their businesses, constructing financial strategies and predictions, monitoring performance
analysis, and maximizing operating productivity and company-wide implementation finance.
This assessment covers the several topics such as financial performance of Sainsbury’s over the
last five years, evaluate the profitability of different products and write an essay about the CSR
policies of the organizations across the world.
Critical personal reflection
While completing this assignment, i was unable to pass this assessment at first time because
due to lack of research and lack of knowledge regarding practical questions affect the results. In
my second assessment, I am done proper research regarding the topic which I was covered in this
report. At the time of re-submitting my assignment I make sure that, I will do all the required
changes which helps me to pass this assessment after re-submission. In the initial assignment,
there was very limited information with insufficient resources which unable others to understand
and it does not fulfil the requirement or learning objectives. In the previous assignment, I was
unable to pass because in first questions I have to done several things but I covered only limited
information which affects my overall assignment. I was lacking in several skills such as time
management, communication, research skills, problem solving etc. In first question i have to
done vertical or horizontal analysis along with ratio analysis of the company along with its
competitor’s information and represent by using graph. But i was unable to done all the
calculation at first time and because of this, i was unable to pass. After improving my all the
lacking skills such as time management, research, problem solving etc. I am unable to re-submit
my assessment where i cover all the requirements which fulfil the learning objectives of the
assessment.
In addition, due to lack of knowledge regarding capital budgeting method for the
selection of suitable method affect my performance. After improving my research skills, i
1
⊘ This is a preview!⊘
Do you want full access?
Subscribe today to unlock all pages.
Trusted by 1+ million students worldwide
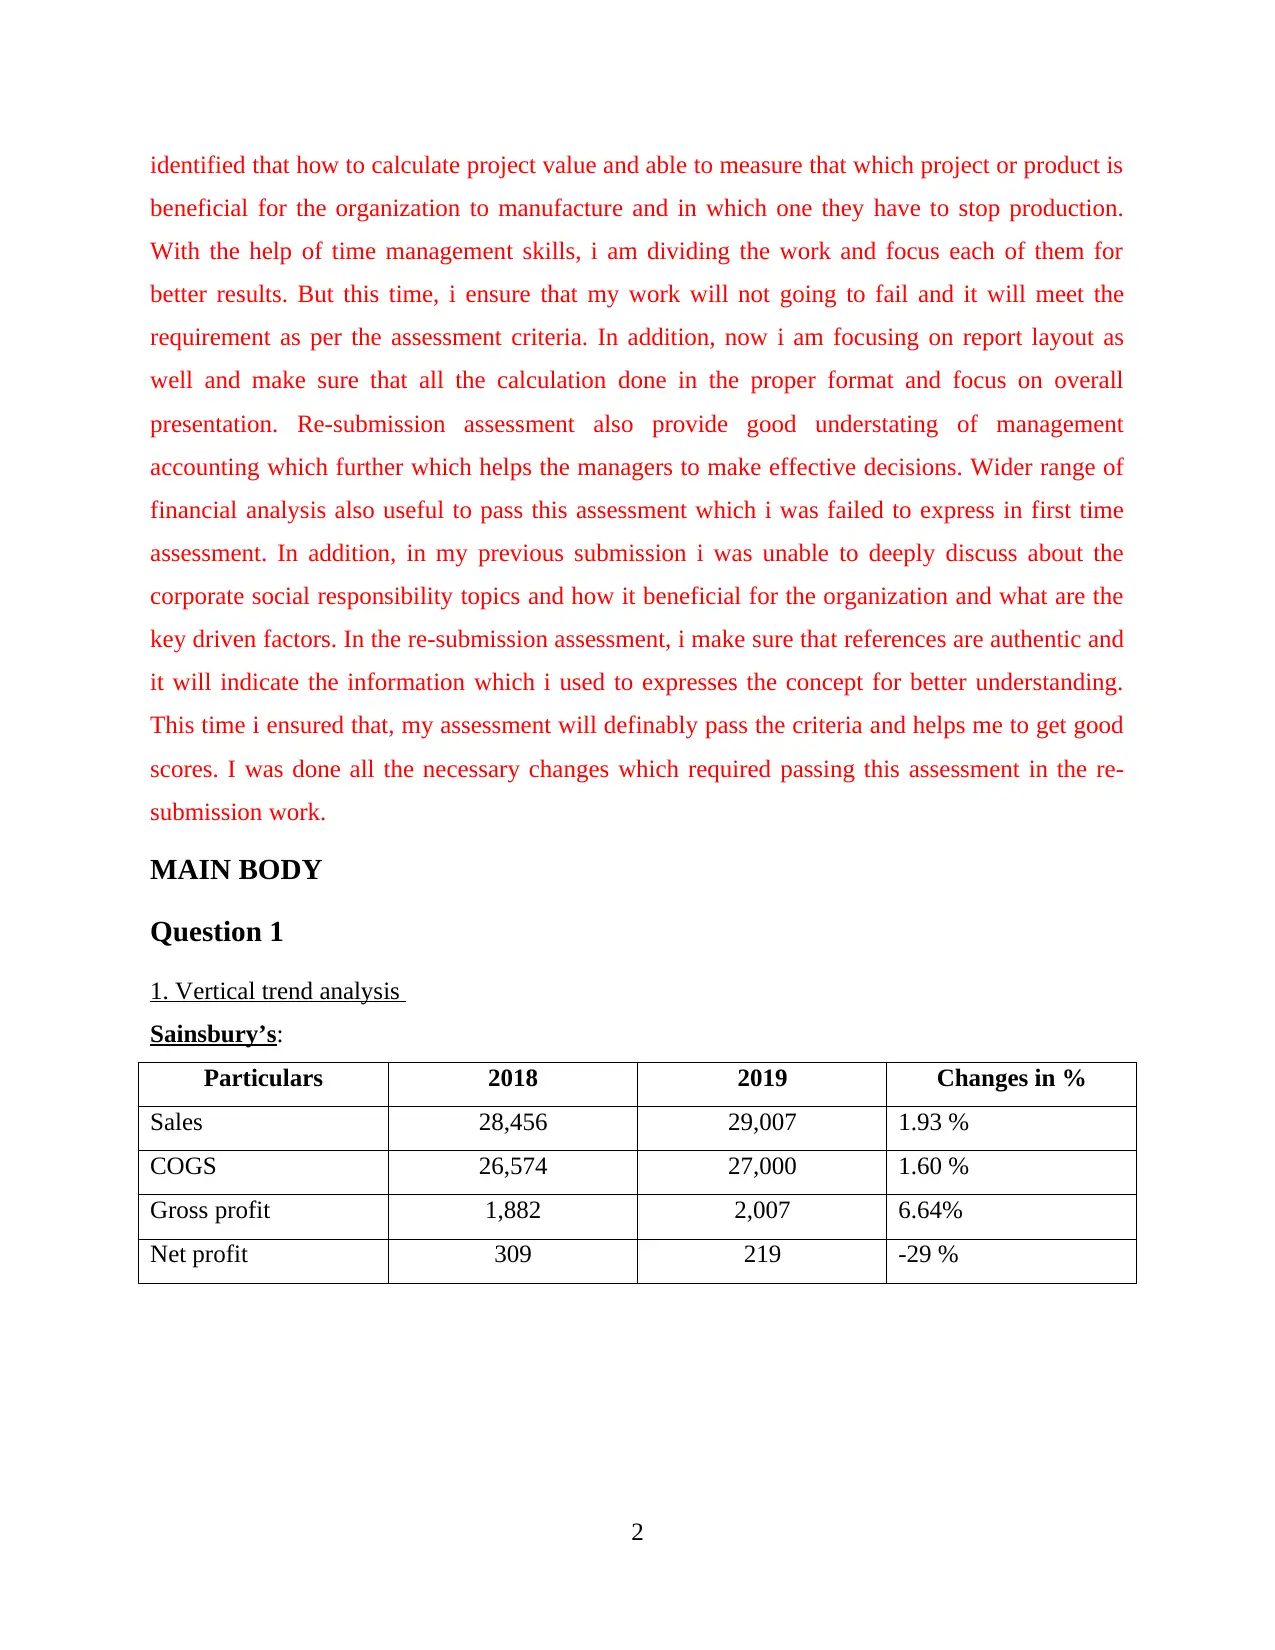
identified that how to calculate project value and able to measure that which project or product is
beneficial for the organization to manufacture and in which one they have to stop production.
With the help of time management skills, i am dividing the work and focus each of them for
better results. But this time, i ensure that my work will not going to fail and it will meet the
requirement as per the assessment criteria. In addition, now i am focusing on report layout as
well and make sure that all the calculation done in the proper format and focus on overall
presentation. Re-submission assessment also provide good understating of management
accounting which further which helps the managers to make effective decisions. Wider range of
financial analysis also useful to pass this assessment which i was failed to express in first time
assessment. In addition, in my previous submission i was unable to deeply discuss about the
corporate social responsibility topics and how it beneficial for the organization and what are the
key driven factors. In the re-submission assessment, i make sure that references are authentic and
it will indicate the information which i used to expresses the concept for better understanding.
This time i ensured that, my assessment will definably pass the criteria and helps me to get good
scores. I was done all the necessary changes which required passing this assessment in the re-
submission work.
MAIN BODY
Question 1
1. Vertical trend analysis
Sainsbury’s:
Particulars 2018 2019 Changes in %
Sales 28,456 29,007 1.93 %
COGS 26,574 27,000 1.60 %
Gross profit 1,882 2,007 6.64%
Net profit 309 219 -29 %
2
Paraphrase This Document
Need a fresh take? Get an instant paraphrase of this document with our AI Paraphraser
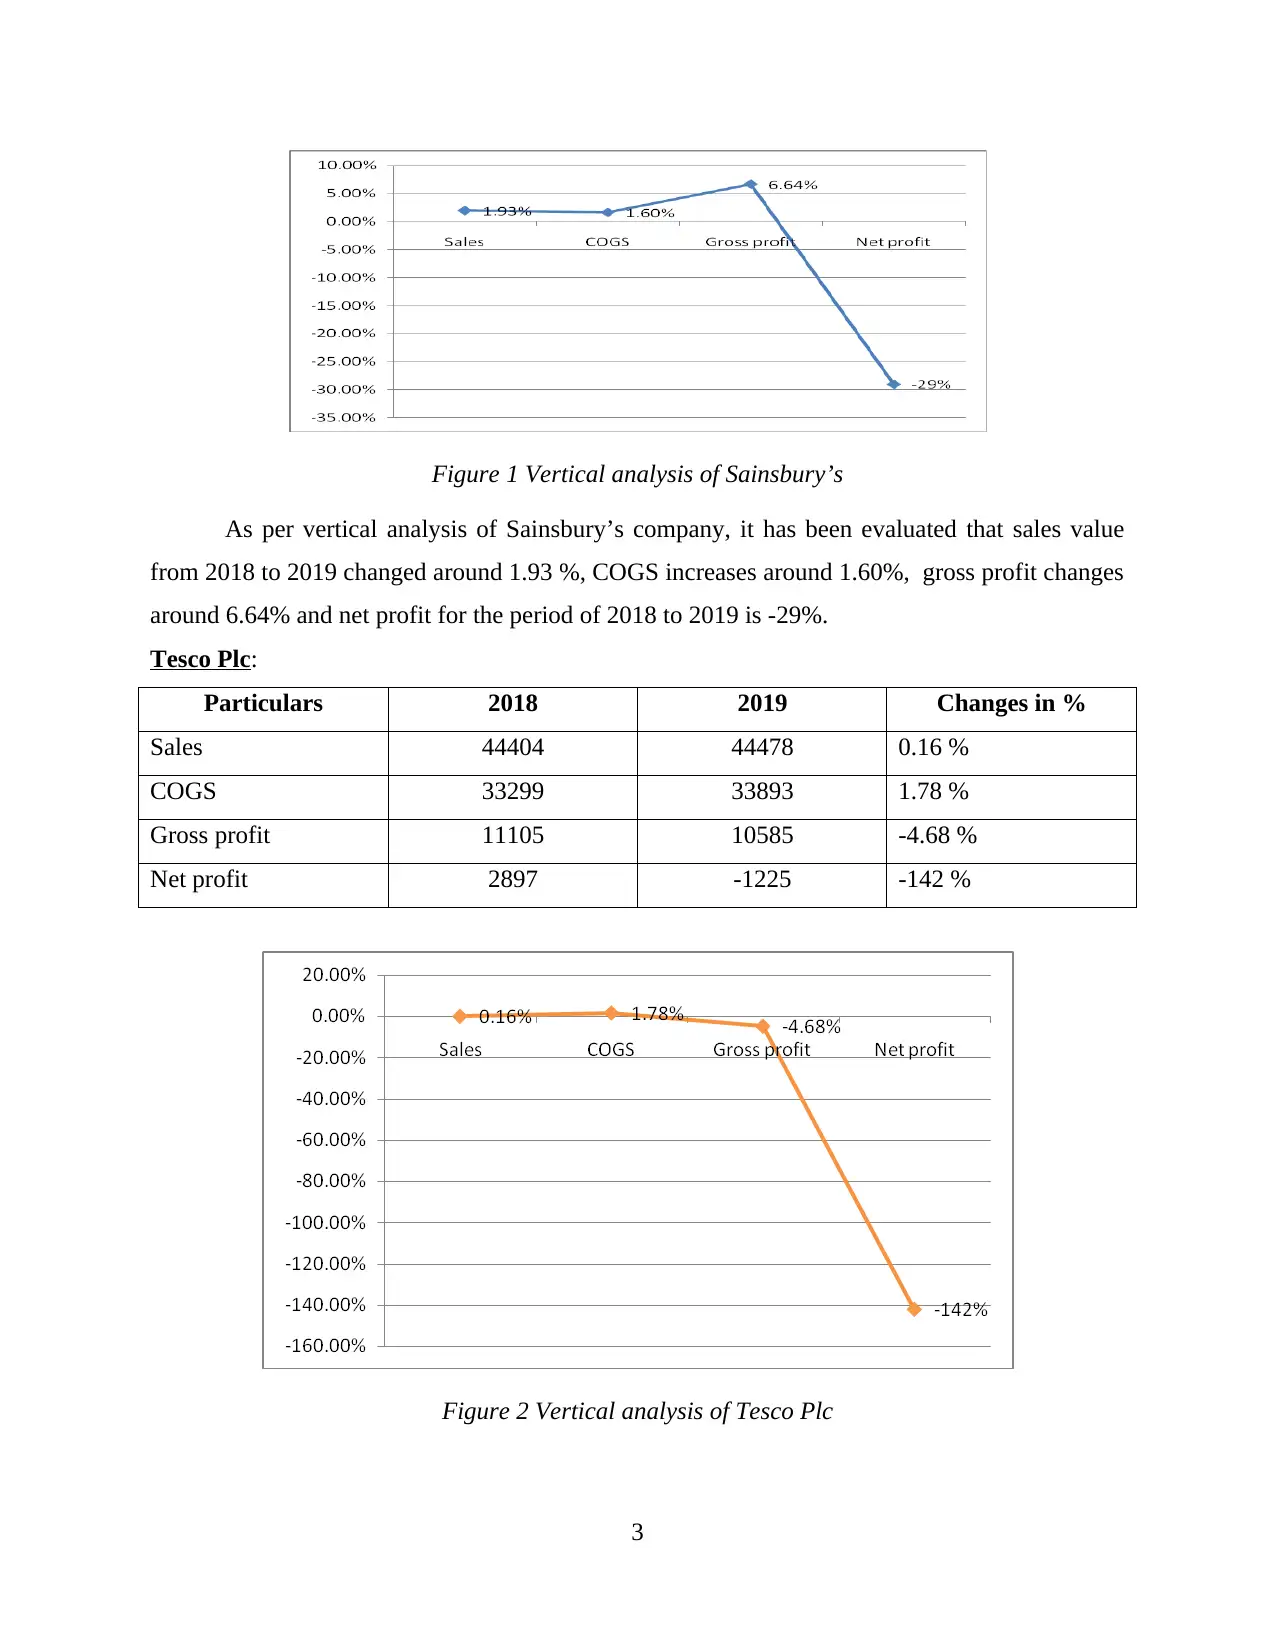
Figure 1 Vertical analysis of Sainsbury’s
As per vertical analysis of Sainsbury’s company, it has been evaluated that sales value
from 2018 to 2019 changed around 1.93 %, COGS increases around 1.60%, gross profit changes
around 6.64% and net profit for the period of 2018 to 2019 is -29%.
Tesco Plc:
Particulars 2018 2019 Changes in %
Sales 44404 44478 0.16 %
COGS 33299 33893 1.78 %
Gross profit 11105 10585 -4.68 %
Net profit 2897 -1225 -142 %
Figure 2 Vertical analysis of Tesco Plc
3
Vertical analysis of Tesco’s is not better than Sainsbury because change in net profit
reduces from the period of 2018 to 2019 around 142%. There are not so much changes in the
sales but gross profit also reduces around 4.68%.
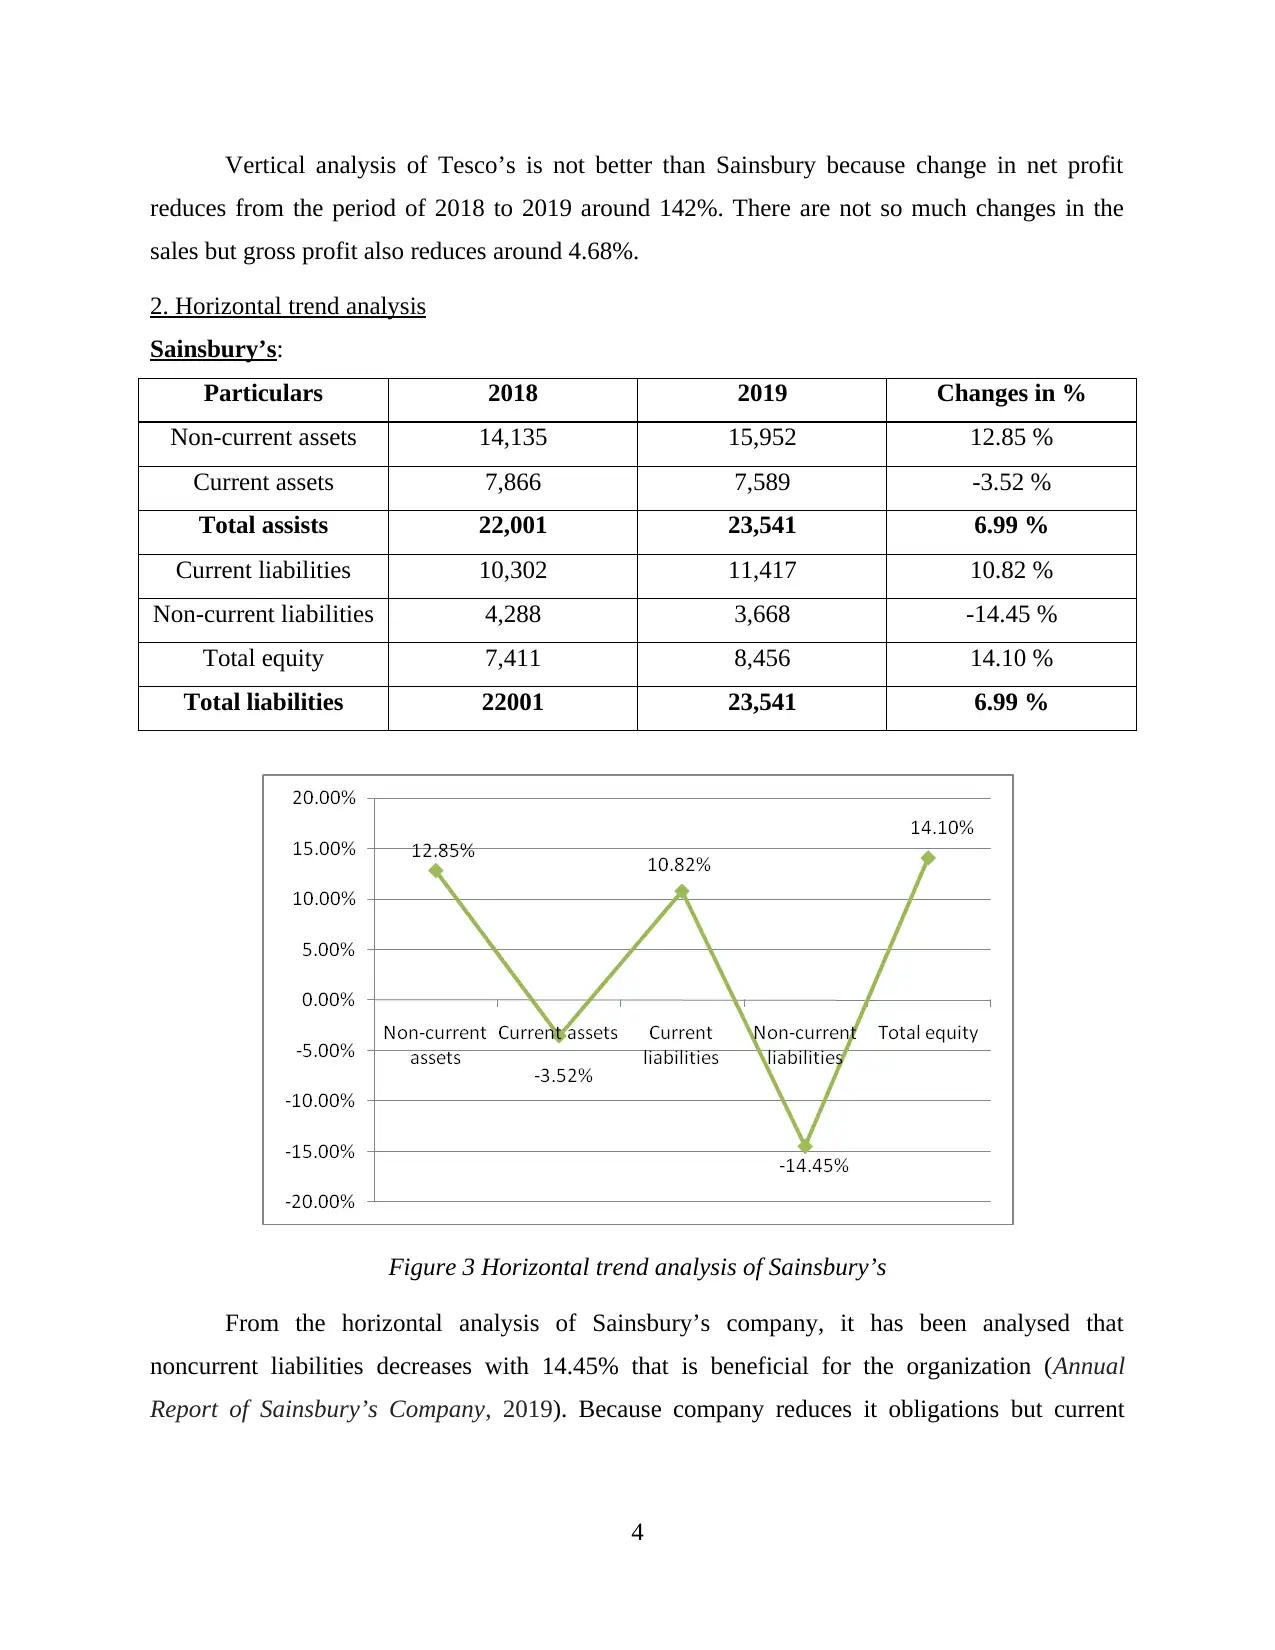
2. Horizontal trend analysis
Sainsbury’s:
Particulars 2018 2019 Changes in %
Non-current assets 14,135 15,952 12.85 %
Current assets 7,866 7,589 -3.52 %
Total assists 22,001 23,541 6.99 %
Current liabilities 10,302 11,417 10.82 %
Non-current liabilities 4,288 3,668 -14.45 %
Total equity 7,411 8,456 14.10 %
Total liabilities 22001 23,541 6.99 %
Figure 3 Horizontal trend analysis of Sainsbury’s
From the horizontal analysis of Sainsbury’s company, it has been analysed that
noncurrent liabilities decreases with 14.45% that is beneficial for the organization (Annual
Report of Sainsbury’s Company, 2019). Because company reduces it obligations but current
4
reduces from the period of 2018 to 2019 around 142%. There are not so much changes in the
sales but gross profit also reduces around 4.68%.
2. Horizontal trend analysis
Sainsbury’s:
Particulars 2018 2019 Changes in %
Non-current assets 14,135 15,952 12.85 %
Current assets 7,866 7,589 -3.52 %
Total assists 22,001 23,541 6.99 %
Current liabilities 10,302 11,417 10.82 %
Non-current liabilities 4,288 3,668 -14.45 %
Total equity 7,411 8,456 14.10 %
Total liabilities 22001 23,541 6.99 %
Figure 3 Horizontal trend analysis of Sainsbury’s
From the horizontal analysis of Sainsbury’s company, it has been analysed that
noncurrent liabilities decreases with 14.45% that is beneficial for the organization (Annual
Report of Sainsbury’s Company, 2019). Because company reduces it obligations but current
4
⊘ This is a preview!⊘
Do you want full access?
Subscribe today to unlock all pages.
Trusted by 1+ million students worldwide
assets also reduces which is not good for the firm because organization unable to pay its short
term obligations.
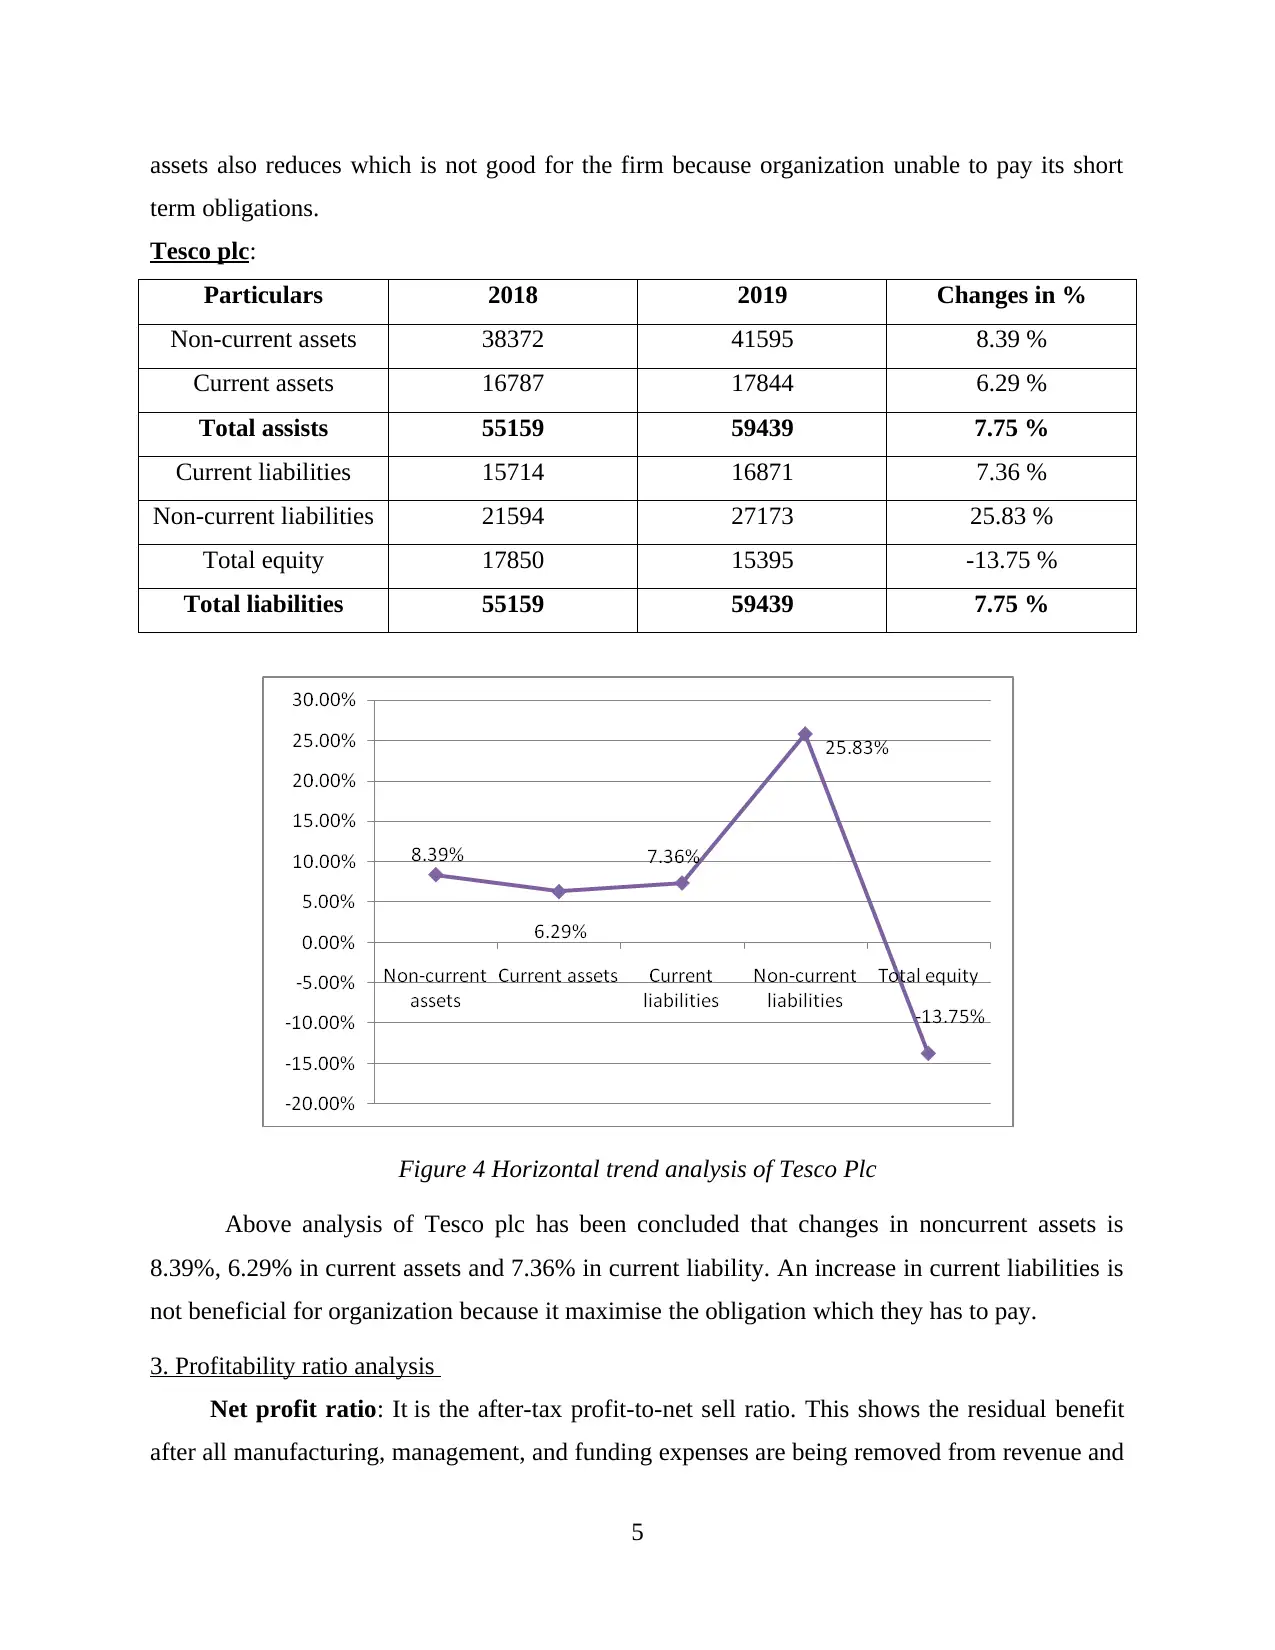
Tesco plc:
Particulars 2018 2019 Changes in %
Non-current assets 38372 41595 8.39 %
Current assets 16787 17844 6.29 %
Total assists 55159 59439 7.75 %
Current liabilities 15714 16871 7.36 %
Non-current liabilities 21594 27173 25.83 %
Total equity 17850 15395 -13.75 %
Total liabilities 55159 59439 7.75 %
Figure 4 Horizontal trend analysis of Tesco Plc
Above analysis of Tesco plc has been concluded that changes in noncurrent assets is
8.39%, 6.29% in current assets and 7.36% in current liability. An increase in current liabilities is
not beneficial for organization because it maximise the obligation which they has to pay.
3. Profitability ratio analysis
Net profit ratio: It is the after-tax profit-to-net sell ratio. This shows the residual benefit
after all manufacturing, management, and funding expenses are being removed from revenue and
5
term obligations.
Tesco plc:
Particulars 2018 2019 Changes in %
Non-current assets 38372 41595 8.39 %
Current assets 16787 17844 6.29 %
Total assists 55159 59439 7.75 %
Current liabilities 15714 16871 7.36 %
Non-current liabilities 21594 27173 25.83 %
Total equity 17850 15395 -13.75 %
Total liabilities 55159 59439 7.75 %
Figure 4 Horizontal trend analysis of Tesco Plc
Above analysis of Tesco plc has been concluded that changes in noncurrent assets is
8.39%, 6.29% in current assets and 7.36% in current liability. An increase in current liabilities is
not beneficial for organization because it maximise the obligation which they has to pay.
3. Profitability ratio analysis
Net profit ratio: It is the after-tax profit-to-net sell ratio. This shows the residual benefit
after all manufacturing, management, and funding expenses are being removed from revenue and
5
Paraphrase This Document
Need a fresh take? Get an instant paraphrase of this document with our AI Paraphraser
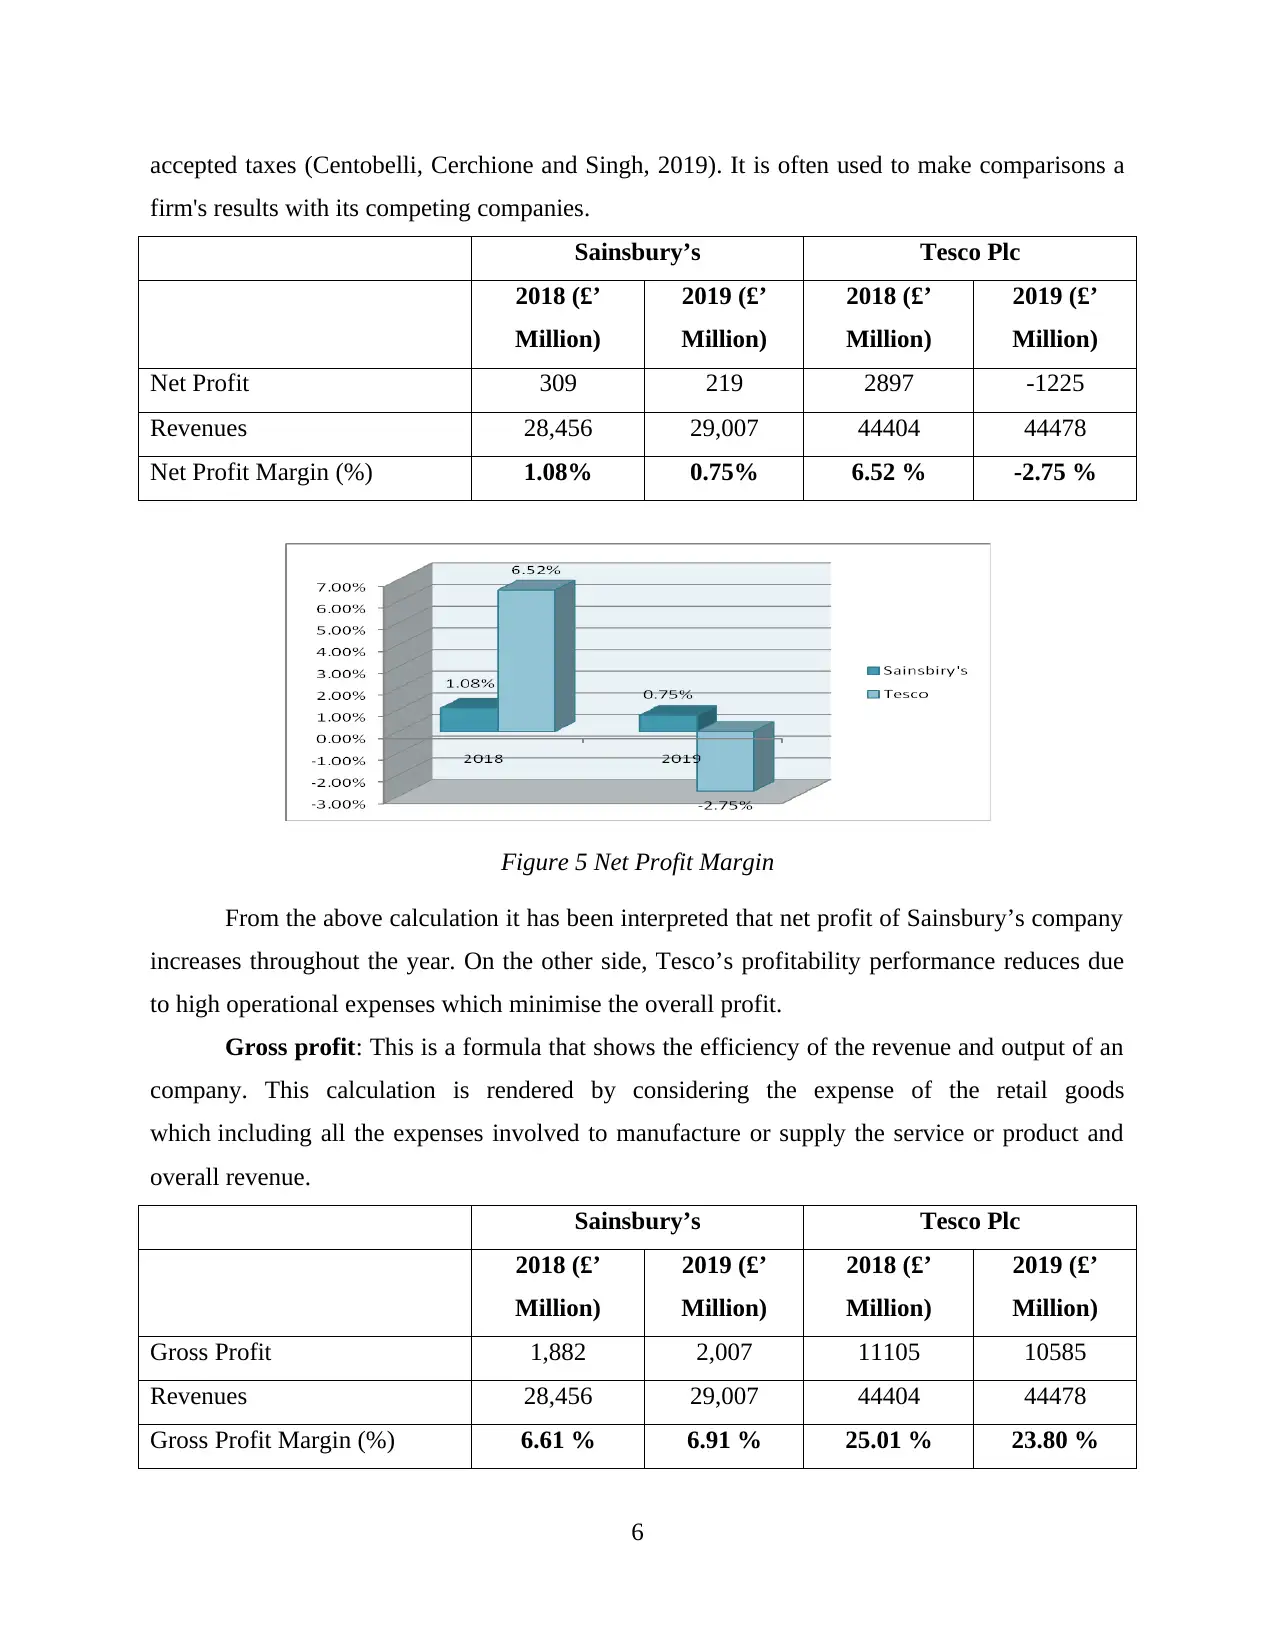
accepted taxes (Centobelli, Cerchione and Singh, 2019). It is often used to make comparisons a
firm's results with its competing companies.
Sainsbury’s Tesco Plc
2018 (£’
Million)
2019 (£’
Million)
2018 (£’
Million)
2019 (£’
Million)
Net Profit 309 219 2897 -1225
Revenues 28,456 29,007 44404 44478
Net Profit Margin (%) 1.08% 0.75% 6.52 % -2.75 %
Figure 5 Net Profit Margin
From the above calculation it has been interpreted that net profit of Sainsbury’s company
increases throughout the year. On the other side, Tesco’s profitability performance reduces due
to high operational expenses which minimise the overall profit.
Gross profit: This is a formula that shows the efficiency of the revenue and output of an
company. This calculation is rendered by considering the expense of the retail goods
which including all the expenses involved to manufacture or supply the service or product and
overall revenue.
Sainsbury’s Tesco Plc
2018 (£’
Million)
2019 (£’
Million)
2018 (£’
Million)
2019 (£’
Million)
Gross Profit 1,882 2,007 11105 10585
Revenues 28,456 29,007 44404 44478
Gross Profit Margin (%) 6.61 % 6.91 % 25.01 % 23.80 %
6
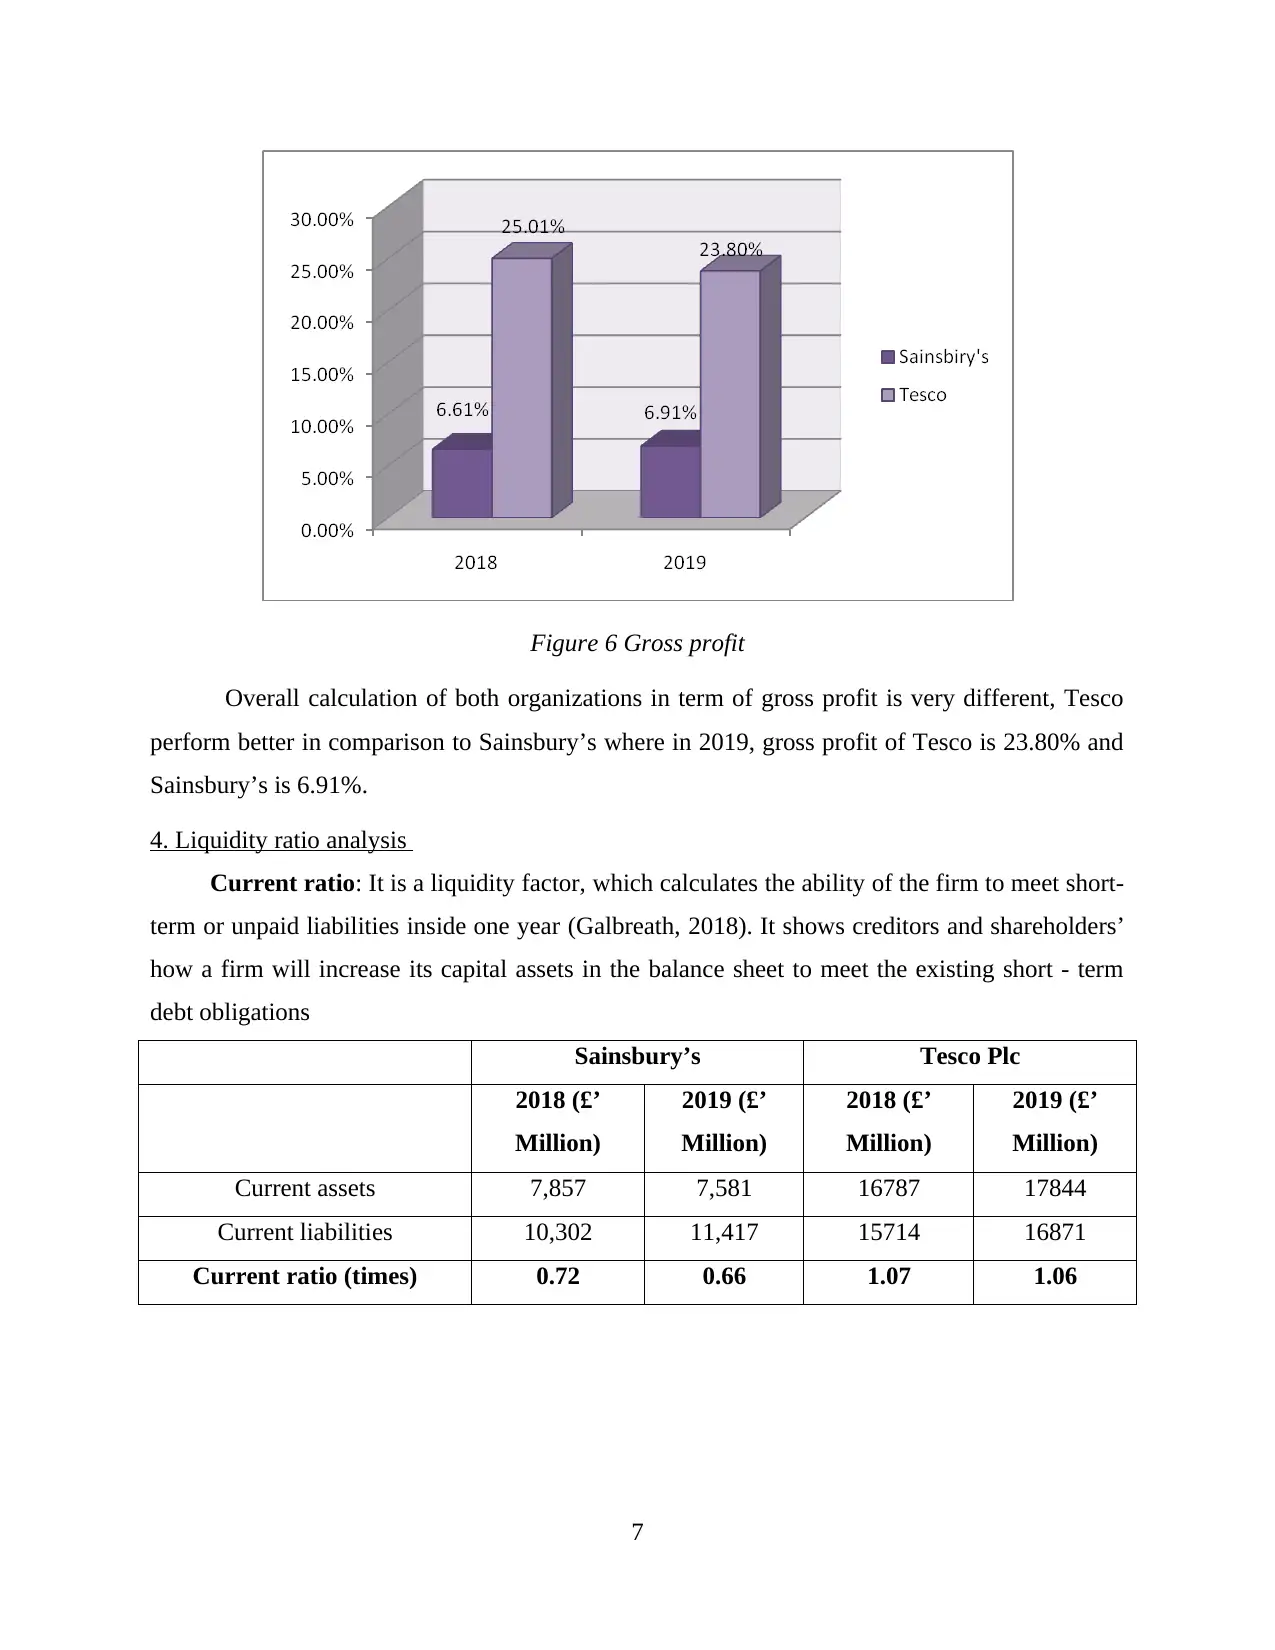
Figure 6 Gross profit
Overall calculation of both organizations in term of gross profit is very different, Tesco
perform better in comparison to Sainsbury’s where in 2019, gross profit of Tesco is 23.80% and
Sainsbury’s is 6.91%.
4. Liquidity ratio analysis
Current ratio: It is a liquidity factor, which calculates the ability of the firm to meet short-
term or unpaid liabilities inside one year (Galbreath, 2018). It shows creditors and shareholders’
how a firm will increase its capital assets in the balance sheet to meet the existing short - term
debt obligations
Sainsbury’s Tesco Plc
2018 (£’
Million)
2019 (£’
Million)
2018 (£’
Million)
2019 (£’
Million)
Current assets 7,857 7,581 16787 17844
Current liabilities 10,302 11,417 15714 16871
Current ratio (times) 0.72 0.66 1.07 1.06
7
⊘ This is a preview!⊘
Do you want full access?
Subscribe today to unlock all pages.
Trusted by 1+ million students worldwide
1 out of 26
Related Documents


Your All-in-One AI-Powered Toolkit for Academic Success.
+13062052269
info@desklib.com
Available 24*7 on WhatsApp / Email
![[object Object]](/_next/static/media/star-bottom.7253800d.svg)
Unlock your academic potential
Copyright © 2020–2026 A2Z Services. All Rights Reserved. Developed and managed by ZUCOL.