RBP020L062S Financial Performance Management Report: Amazon vs Walmart
VerifiedAdded on 2022/11/24
|18
|4215
|453
Report
AI Summary
This report provides a comprehensive financial performance analysis of Amazon and Walmart. It begins with an introduction to financial performance management and identifies Amazon and Walmart as key competitors in the retail industry. The report then presents a detailed ratio analysis of both companies over a two-year period, evaluating their liquidity, solvency, profitability, efficiency, coverage, and market prospect ratios. Following the ratio analysis, the report delves into Kaplan and Norton’s balanced scorecard as a strategic management tool, evaluating its application to Amazon. Finally, the report offers a critical evaluation of the benefits and challenges associated with integrated reporting, concluding with a summary of the key findings and a list of references.

FINANCIAL PERFORMANCE
MANAGEMENT
MANAGEMENT
Paraphrase This Document
Need a fresh take? Get an instant paraphrase of this document with our AI Paraphraser
TABLE OF CONTENTS
INTRODUCTION...........................................................................................................................1
MAIN BODY...................................................................................................................................1
QUESTION- 1.................................................................................................................................1
Criteria for the identification of the competitor...........................................................................1
Ratio Analysis..............................................................................................................................1
Interpretation................................................................................................................................5
QUESTION 2...................................................................................................................................6
Kaplan and Norton’s balanced scorecard as strategic management system and critical success
factor for Amazon........................................................................................................................6
QUESTION 3.................................................................................................................................10
Critical evaluation of benefit and challenges of integrated reporting........................................10
CONCLUSION..............................................................................................................................12
REFERENCES..............................................................................................................................13
INTRODUCTION
Financial performance management is one of the essential functions of the business
wherein the management of the company shall be analysing the financial results of the business
to identify the financial health and well-being of the organization. This shall be done through the
establishing proper monitoring and control over the targeted and the actual performance that is
generated by the employees in the organization. This is significant to determine the achievement
of the organizational objectives of the business and generate the competencies in the industry.
The current project shall be evaluation the performances that are generated by the two companies
Amazon and Walmart through several techniques used by the businesses. The report shall be
presenting the ratio analysis of the past two years of the companies to identify the comparative
performances that are generated by the competitors in the industry. Apart from that it shall also
reflect the balance scorecard as the tool for the strategic management system. Lastly it shall be
highlighting the benefits and the challenges of adopting the integrated reporting.
MAIN BODY
QUESTION- 1
Criteria for the identification of the competitor
The Company A is Amazon and the company B is Walmart, who are considered as the
closest competitors in the retail industry. They both secure the top positions in their own way of
capitalizing over the market share where Amazon dominates the e-commerce segment and the
Walmart reigns over the brick and mortar systems in the industry (Zolfani and Chatterjee, 2019).
Both the businesses offer the larger array of the products and the services which assists in further
increasing its competencies in the market. They are highly superior in terms of the conduct of the
business in the companies.
Ratio Analysis
The ratio analysis of Amazon company for the past two years of 2019 and 2020
identifying the financial performance that is generated by the company are the following:-
Amazon
S.N
O RATIOS FORMULA CALCULATION
1
⊘ This is a preview!⊘
Do you want full access?
Subscribe today to unlock all pages.
Trusted by 1+ million students worldwide
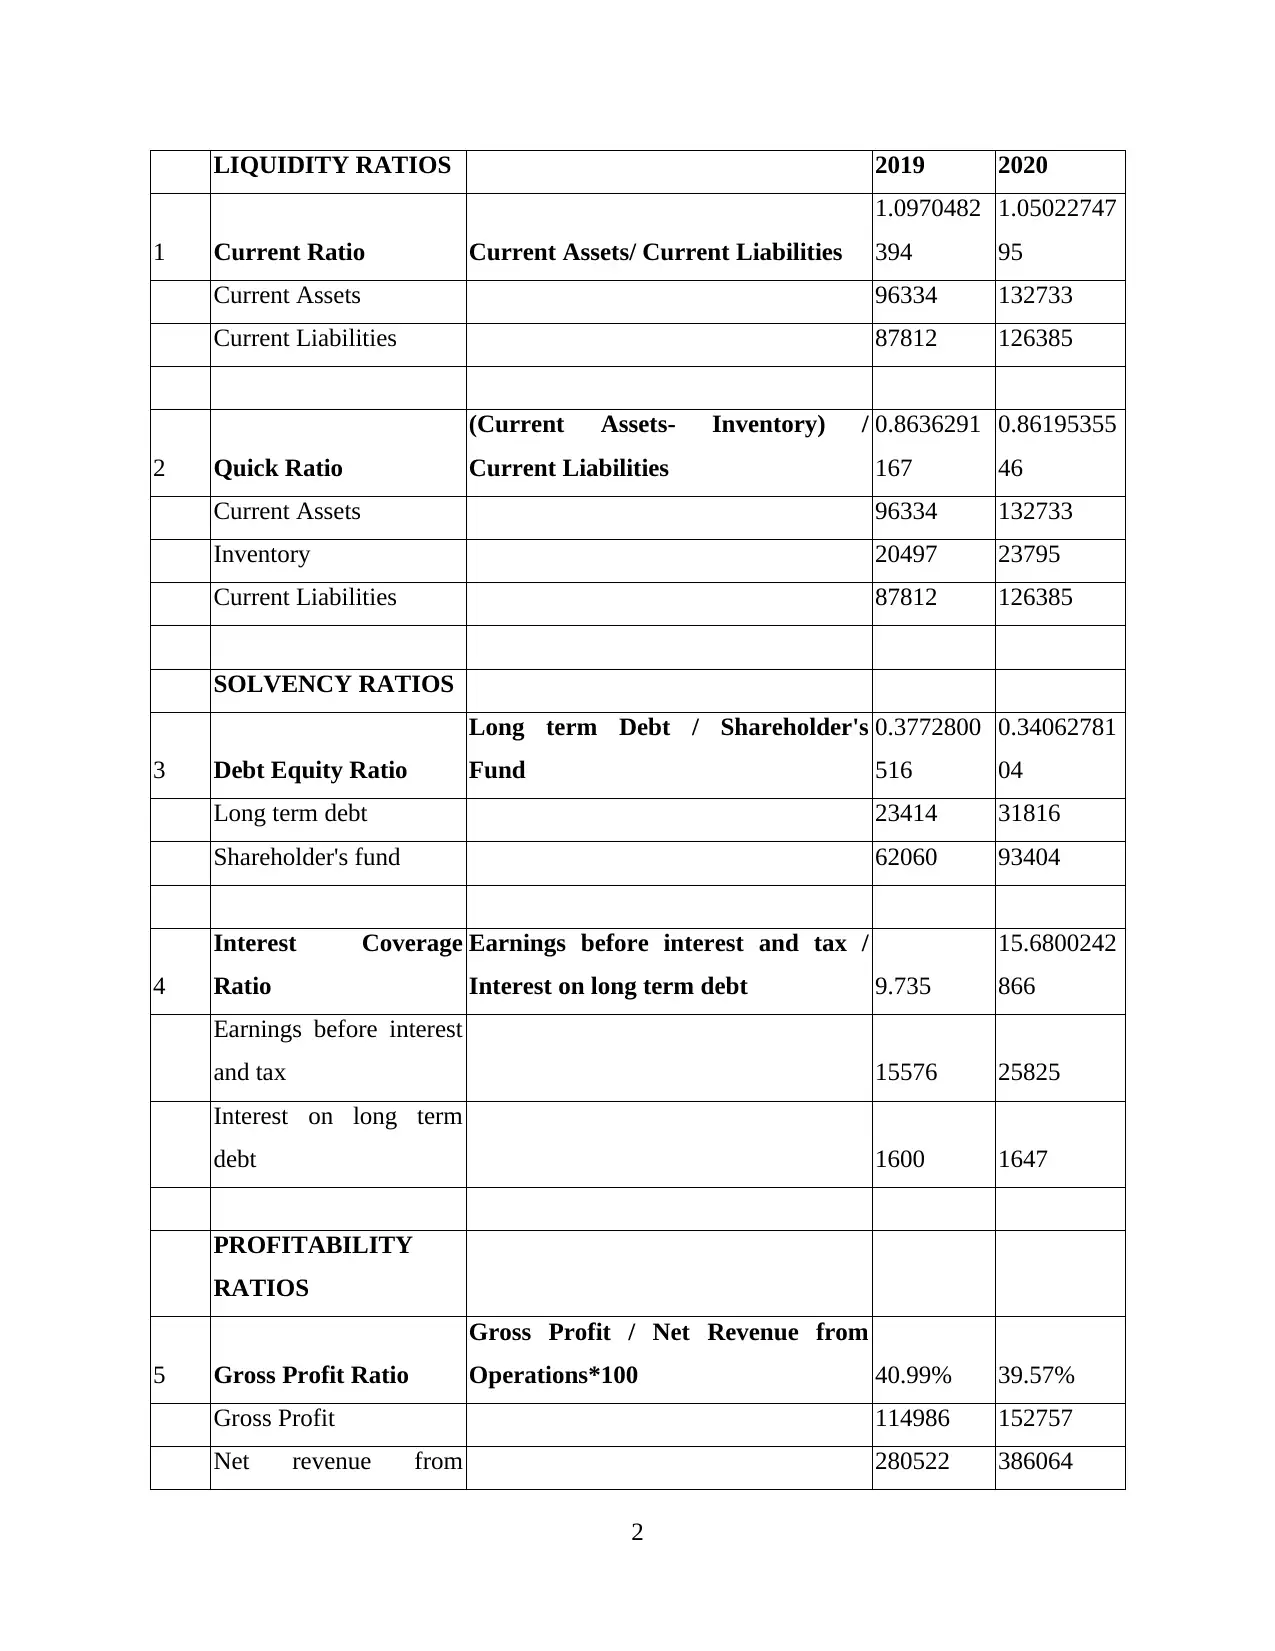
LIQUIDITY RATIOS 2019 2020
1 Current Ratio Current Assets/ Current Liabilities
1.0970482
394
1.05022747
95
Current Assets 96334 132733
Current Liabilities 87812 126385
2 Quick Ratio
(Current Assets- Inventory) /
Current Liabilities
0.8636291
167
0.86195355
46
Current Assets 96334 132733
Inventory 20497 23795
Current Liabilities 87812 126385
SOLVENCY RATIOS
3 Debt Equity Ratio
Long term Debt / Shareholder's
Fund
0.3772800
516
0.34062781
04
Long term debt 23414 31816
Shareholder's fund 62060 93404
4
Interest Coverage
Ratio
Earnings before interest and tax /
Interest on long term debt 9.735
15.6800242
866
Earnings before interest
and tax 15576 25825
Interest on long term
debt 1600 1647
PROFITABILITY
RATIOS
5 Gross Profit Ratio
Gross Profit / Net Revenue from
Operations*100 40.99% 39.57%
Gross Profit 114986 152757
Net revenue from 280522 386064
2
Paraphrase This Document
Need a fresh take? Get an instant paraphrase of this document with our AI Paraphraser
operations
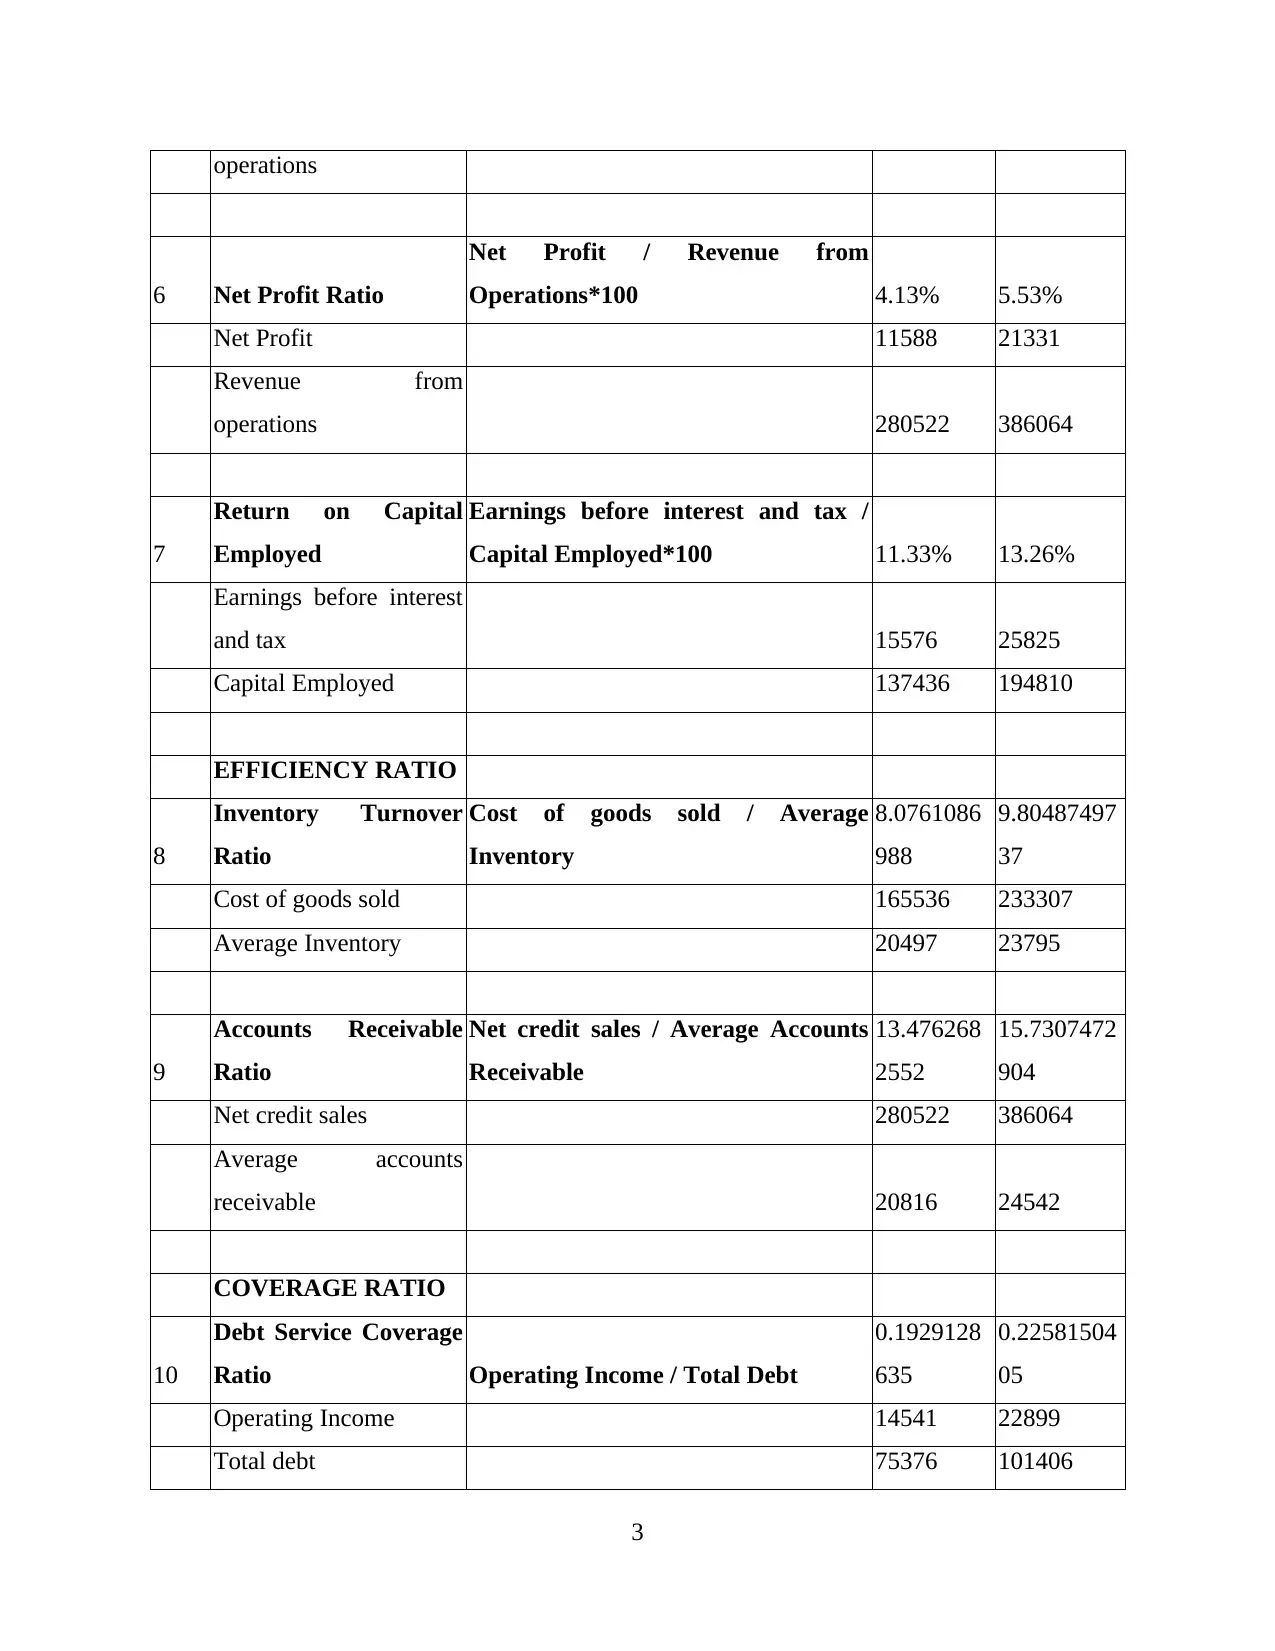
6 Net Profit Ratio
Net Profit / Revenue from
Operations*100 4.13% 5.53%
Net Profit 11588 21331
Revenue from
operations 280522 386064
7
Return on Capital
Employed
Earnings before interest and tax /
Capital Employed*100 11.33% 13.26%
Earnings before interest
and tax 15576 25825
Capital Employed 137436 194810
EFFICIENCY RATIO
8
Inventory Turnover
Ratio
Cost of goods sold / Average
Inventory
8.0761086
988
9.80487497
37
Cost of goods sold 165536 233307
Average Inventory 20497 23795
9
Accounts Receivable
Ratio
Net credit sales / Average Accounts
Receivable
13.476268
2552
15.7307472
904
Net credit sales 280522 386064
Average accounts
receivable 20816 24542
COVERAGE RATIO
10
Debt Service Coverage
Ratio Operating Income / Total Debt
0.1929128
635
0.22581504
05
Operating Income 14541 22899
Total debt 75376 101406
3
MARKET
PROSPECT RATIO
11 Earning per Share
Earnings available to equity
shareholders / Number of shares
outstanding 23.46 42.64
Earnings available to
equity shareholders 11588 21331
Number of shares
outstanding 494 500.25
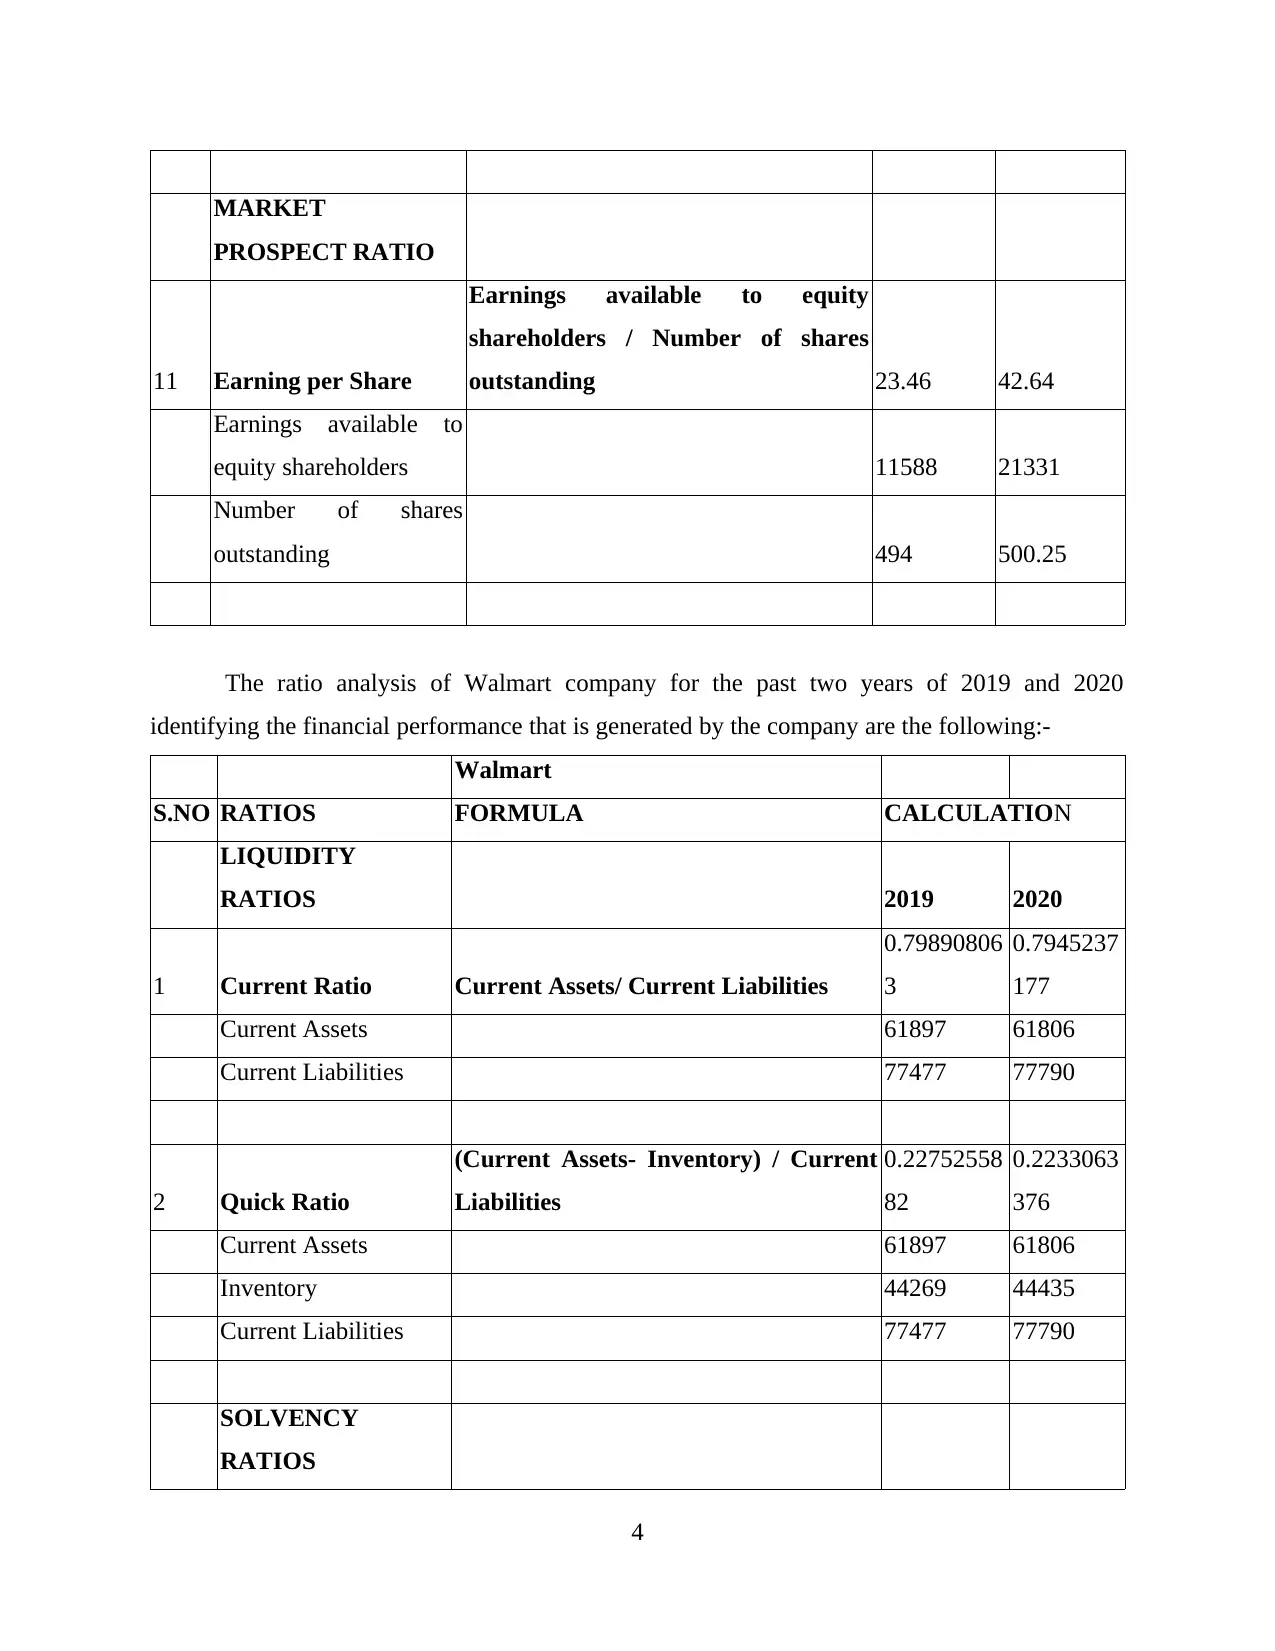
The ratio analysis of Walmart company for the past two years of 2019 and 2020
identifying the financial performance that is generated by the company are the following:-
Walmart
S.NO RATIOS FORMULA CALCULATION
LIQUIDITY
RATIOS 2019 2020
1 Current Ratio Current Assets/ Current Liabilities
0.79890806
3
0.7945237
177
Current Assets 61897 61806
Current Liabilities 77477 77790
2 Quick Ratio
(Current Assets- Inventory) / Current
Liabilities
0.22752558
82
0.2233063
376
Current Assets 61897 61806
Inventory 44269 44435
Current Liabilities 77477 77790
SOLVENCY
RATIOS
4
PROSPECT RATIO
11 Earning per Share
Earnings available to equity
shareholders / Number of shares
outstanding 23.46 42.64
Earnings available to
equity shareholders 11588 21331
Number of shares
outstanding 494 500.25
The ratio analysis of Walmart company for the past two years of 2019 and 2020
identifying the financial performance that is generated by the company are the following:-
Walmart
S.NO RATIOS FORMULA CALCULATION
LIQUIDITY
RATIOS 2019 2020
1 Current Ratio Current Assets/ Current Liabilities
0.79890806
3
0.7945237
177
Current Assets 61897 61806
Current Liabilities 77477 77790
2 Quick Ratio
(Current Assets- Inventory) / Current
Liabilities
0.22752558
82
0.2233063
376
Current Assets 61897 61806
Inventory 44269 44435
Current Liabilities 77477 77790
SOLVENCY
RATIOS
4
⊘ This is a preview!⊘
Do you want full access?
Subscribe today to unlock all pages.
Trusted by 1+ million students worldwide
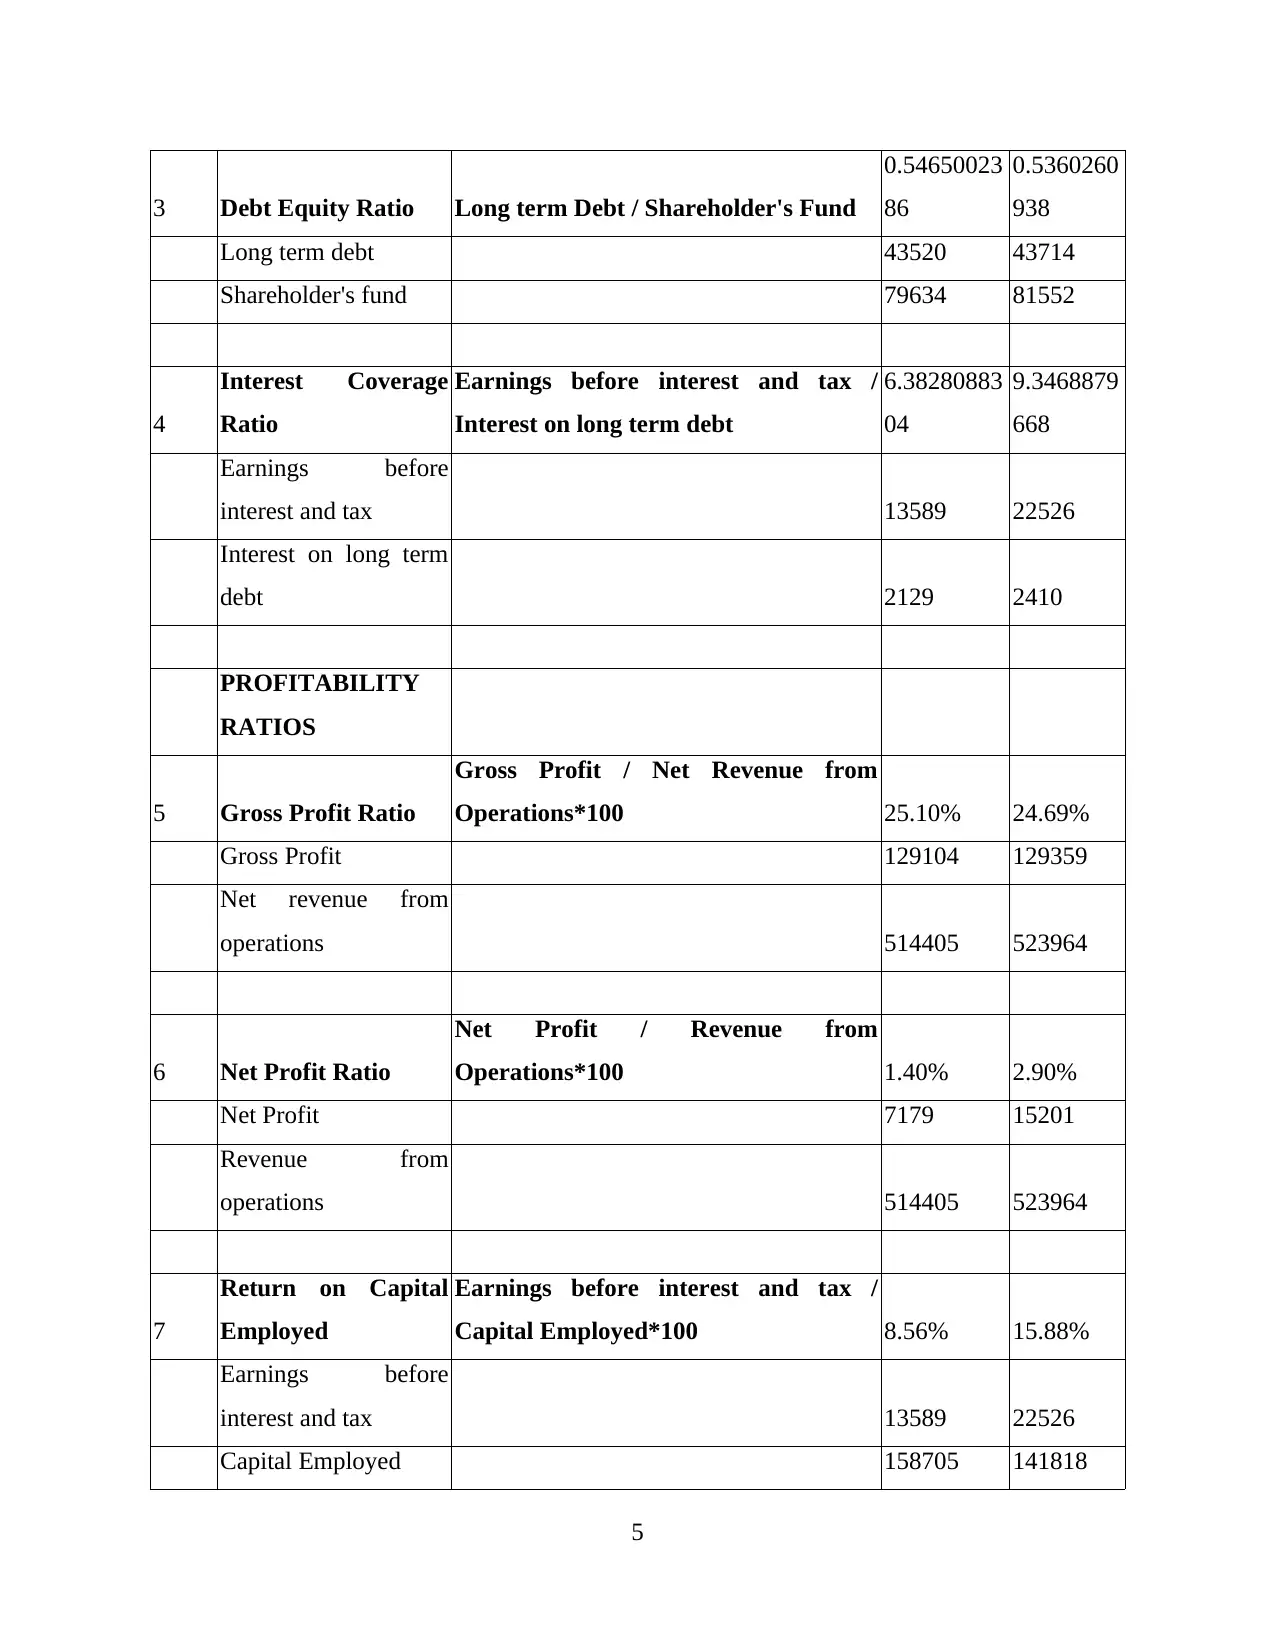
3 Debt Equity Ratio Long term Debt / Shareholder's Fund
0.54650023
86
0.5360260
938
Long term debt 43520 43714
Shareholder's fund 79634 81552
4
Interest Coverage
Ratio
Earnings before interest and tax /
Interest on long term debt
6.38280883
04
9.3468879
668
Earnings before
interest and tax 13589 22526
Interest on long term
debt 2129 2410
PROFITABILITY
RATIOS
5 Gross Profit Ratio
Gross Profit / Net Revenue from
Operations*100 25.10% 24.69%
Gross Profit 129104 129359
Net revenue from
operations 514405 523964
6 Net Profit Ratio
Net Profit / Revenue from
Operations*100 1.40% 2.90%
Net Profit 7179 15201
Revenue from
operations 514405 523964
7
Return on Capital
Employed
Earnings before interest and tax /
Capital Employed*100 8.56% 15.88%
Earnings before
interest and tax 13589 22526
Capital Employed 158705 141818
5
Paraphrase This Document
Need a fresh take? Get an instant paraphrase of this document with our AI Paraphraser
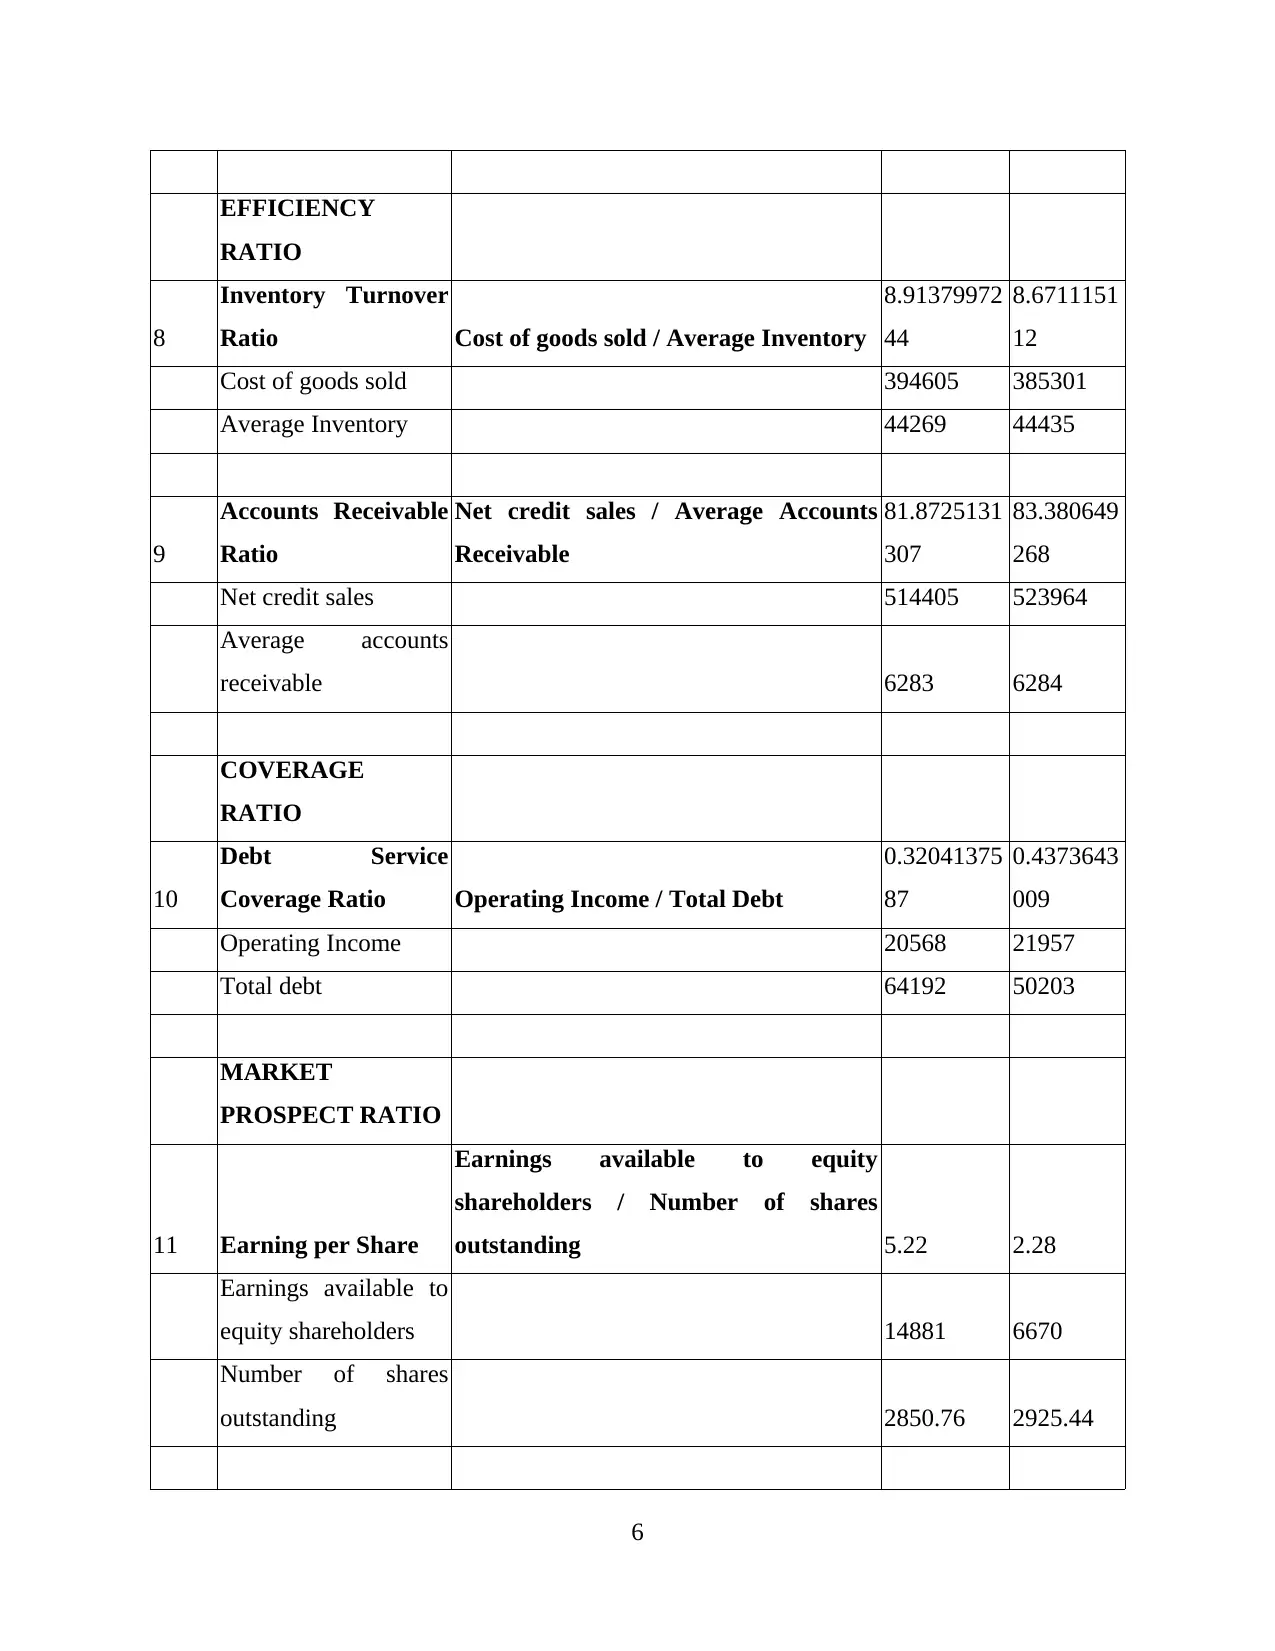
EFFICIENCY
RATIO
8
Inventory Turnover
Ratio Cost of goods sold / Average Inventory
8.91379972
44
8.6711151
12
Cost of goods sold 394605 385301
Average Inventory 44269 44435
9
Accounts Receivable
Ratio
Net credit sales / Average Accounts
Receivable
81.8725131
307
83.380649
268
Net credit sales 514405 523964
Average accounts
receivable 6283 6284
COVERAGE
RATIO
10
Debt Service
Coverage Ratio Operating Income / Total Debt
0.32041375
87
0.4373643
009
Operating Income 20568 21957
Total debt 64192 50203
MARKET
PROSPECT RATIO
11 Earning per Share
Earnings available to equity
shareholders / Number of shares
outstanding 5.22 2.28
Earnings available to
equity shareholders 14881 6670
Number of shares
outstanding 2850.76 2925.44
6
RATIO
8
Inventory Turnover
Ratio Cost of goods sold / Average Inventory
8.91379972
44
8.6711151
12
Cost of goods sold 394605 385301
Average Inventory 44269 44435
9
Accounts Receivable
Ratio
Net credit sales / Average Accounts
Receivable
81.8725131
307
83.380649
268
Net credit sales 514405 523964
Average accounts
receivable 6283 6284
COVERAGE
RATIO
10
Debt Service
Coverage Ratio Operating Income / Total Debt
0.32041375
87
0.4373643
009
Operating Income 20568 21957
Total debt 64192 50203
MARKET
PROSPECT RATIO
11 Earning per Share
Earnings available to equity
shareholders / Number of shares
outstanding 5.22 2.28
Earnings available to
equity shareholders 14881 6670
Number of shares
outstanding 2850.76 2925.44
6
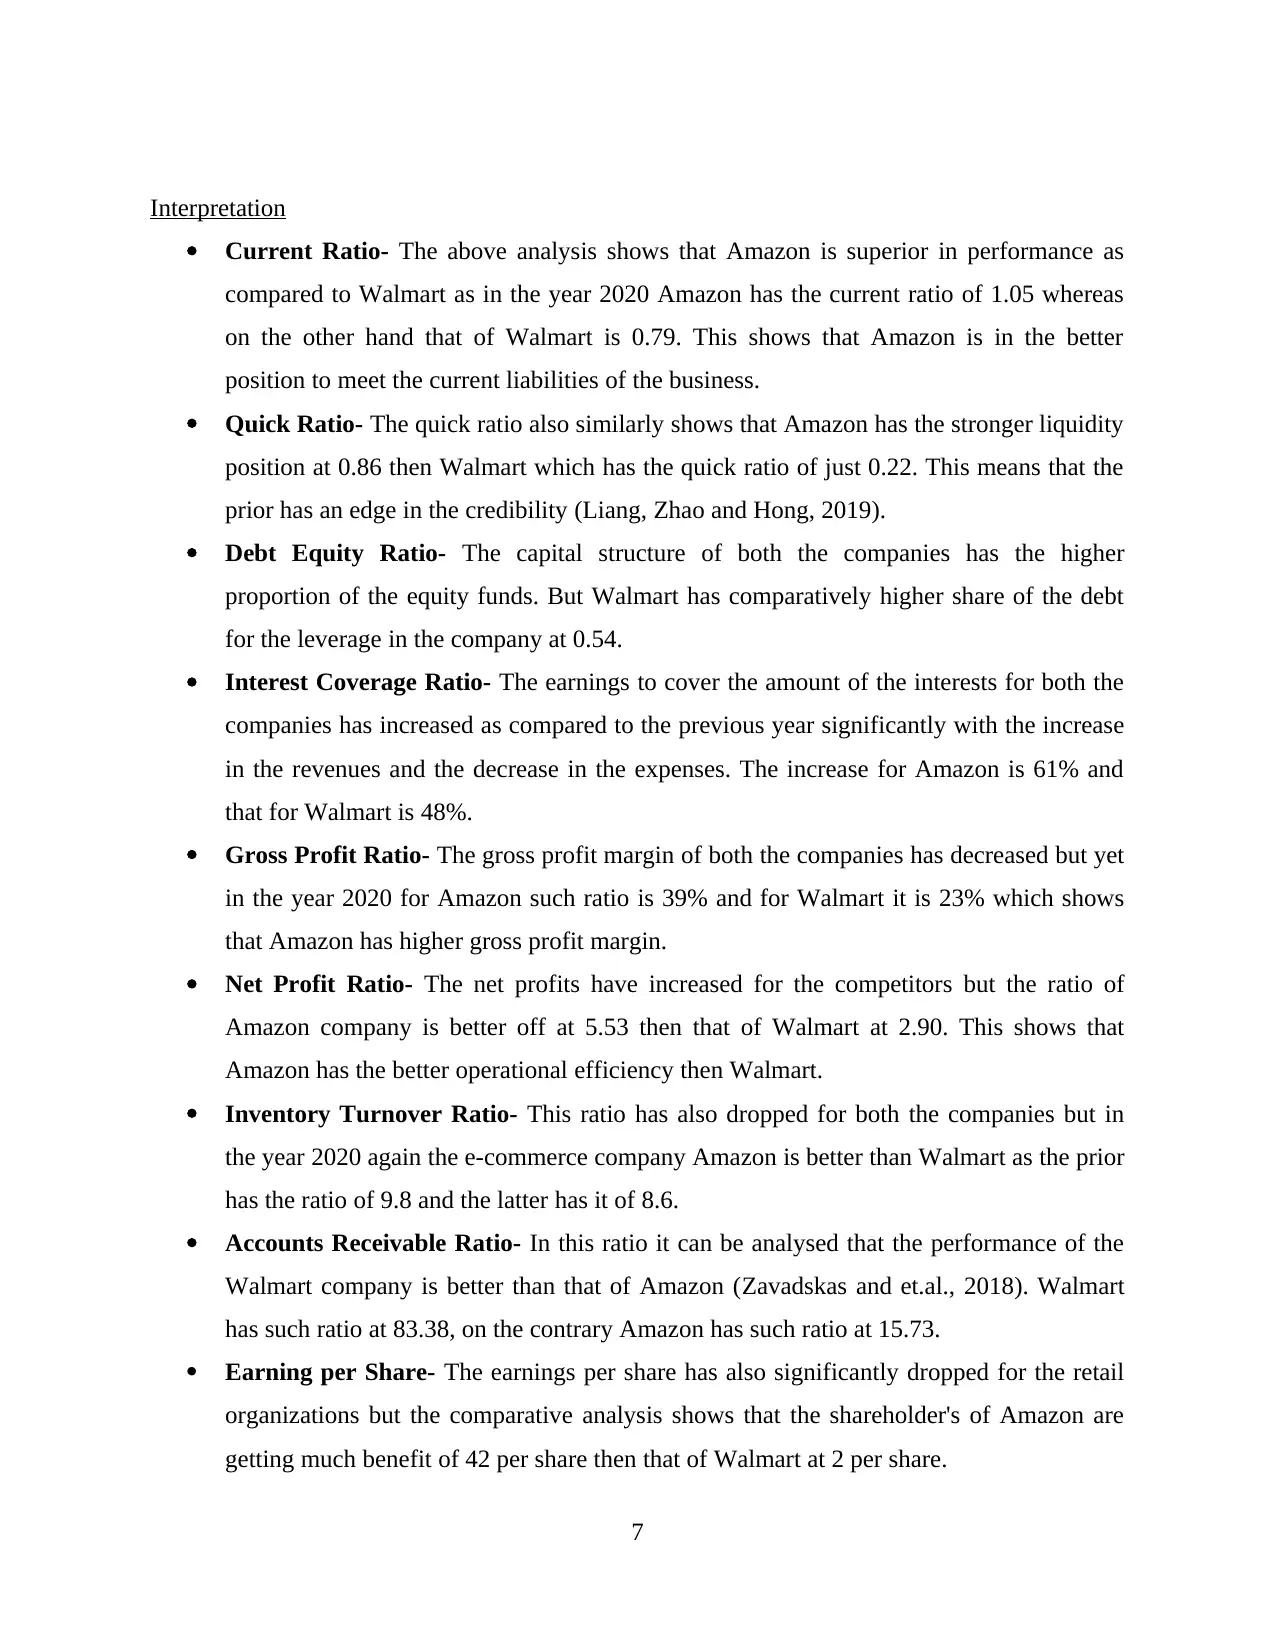
Interpretation
Current Ratio- The above analysis shows that Amazon is superior in performance as
compared to Walmart as in the year 2020 Amazon has the current ratio of 1.05 whereas
on the other hand that of Walmart is 0.79. This shows that Amazon is in the better
position to meet the current liabilities of the business.
Quick Ratio- The quick ratio also similarly shows that Amazon has the stronger liquidity
position at 0.86 then Walmart which has the quick ratio of just 0.22. This means that the
prior has an edge in the credibility (Liang, Zhao and Hong, 2019).
Debt Equity Ratio- The capital structure of both the companies has the higher
proportion of the equity funds. But Walmart has comparatively higher share of the debt
for the leverage in the company at 0.54.
Interest Coverage Ratio- The earnings to cover the amount of the interests for both the
companies has increased as compared to the previous year significantly with the increase
in the revenues and the decrease in the expenses. The increase for Amazon is 61% and
that for Walmart is 48%.
Gross Profit Ratio- The gross profit margin of both the companies has decreased but yet
in the year 2020 for Amazon such ratio is 39% and for Walmart it is 23% which shows
that Amazon has higher gross profit margin.
Net Profit Ratio- The net profits have increased for the competitors but the ratio of
Amazon company is better off at 5.53 then that of Walmart at 2.90. This shows that
Amazon has the better operational efficiency then Walmart.
Inventory Turnover Ratio- This ratio has also dropped for both the companies but in
the year 2020 again the e-commerce company Amazon is better than Walmart as the prior
has the ratio of 9.8 and the latter has it of 8.6.
Accounts Receivable Ratio- In this ratio it can be analysed that the performance of the
Walmart company is better than that of Amazon (Zavadskas and et.al., 2018). Walmart
has such ratio at 83.38, on the contrary Amazon has such ratio at 15.73.
Earning per Share- The earnings per share has also significantly dropped for the retail
organizations but the comparative analysis shows that the shareholder's of Amazon are
getting much benefit of 42 per share then that of Walmart at 2 per share.
7
⊘ This is a preview!⊘
Do you want full access?
Subscribe today to unlock all pages.
Trusted by 1+ million students worldwide
QUESTION 2
Kaplan and Norton’s balanced scorecard as strategic management system and critical success
factor for Amazon
The balanced scorecard is a type of strategy management tool which is very helpful for
the business in order to manage and maintain the business and its working. The balanced
scorecard is a type of strategic planning and management tool which is used in order to align all
day- to- day activities in order to grow and develop the business. in addition to this it also
includes communicating all the outcomes to the relevant stakeholders and to measure and
monitor the progress of company. the balanced scorecard is a tool which is helpful for the
company in order to manage the working of the business in proper and effective manner. The
balanced scorecard is a fully integrated strategic management system and is a way of measuring
the performance of the company.
As per the views of Quesado, Aibar Guzmán and Lima Rodrigues (2018) the use of
balanced scorecard is very beneficial as it will assist the company in bringing structure to
business strategy. This is pertaining to the fact that the major perspective of BSC involves all the
major items and because of this it provides a structure to the business strategy. On the other
hand, Krylov (2019) argues that major benefit of using the balanced scorecard is that will assist
in making communication easier and this will promote better alignment with help of proper focus
on the key aspect and perspective of business growth. Moreover, Sewell, Mason and Venter
(2017) articulated that fact that the use of balanced scorecard will integrate and connect the
individual worker with the goals of the organization. This is pertaining to the fact that all the
perspective under the balanced scorecard are connected with the ultimate vision of the company.
In against of this Malagueño, Lopez-Valeiras and Gomez-Conde (2018) criticized the fact
that the use of balanced scorecard can result in more complications. This is particularly because
of the reason that it takes a lot of time as there are four perspective relating to the business
growth and this makes it a little complicated. In addition to this, Balanced scorecard in 2020:
advantages and disadvantages, (2021) stated that the use of balanced scorecard also requires a
lot use of data. This is pertaining to the fact that all the different perspective need to be studied in
detail and because of this the manager or strategic planner need to do a lot of research and this
will undertake use of lot many data.
Amazon Balanced scorecard
8
Paraphrase This Document
Need a fresh take? Get an instant paraphrase of this document with our AI Paraphraser
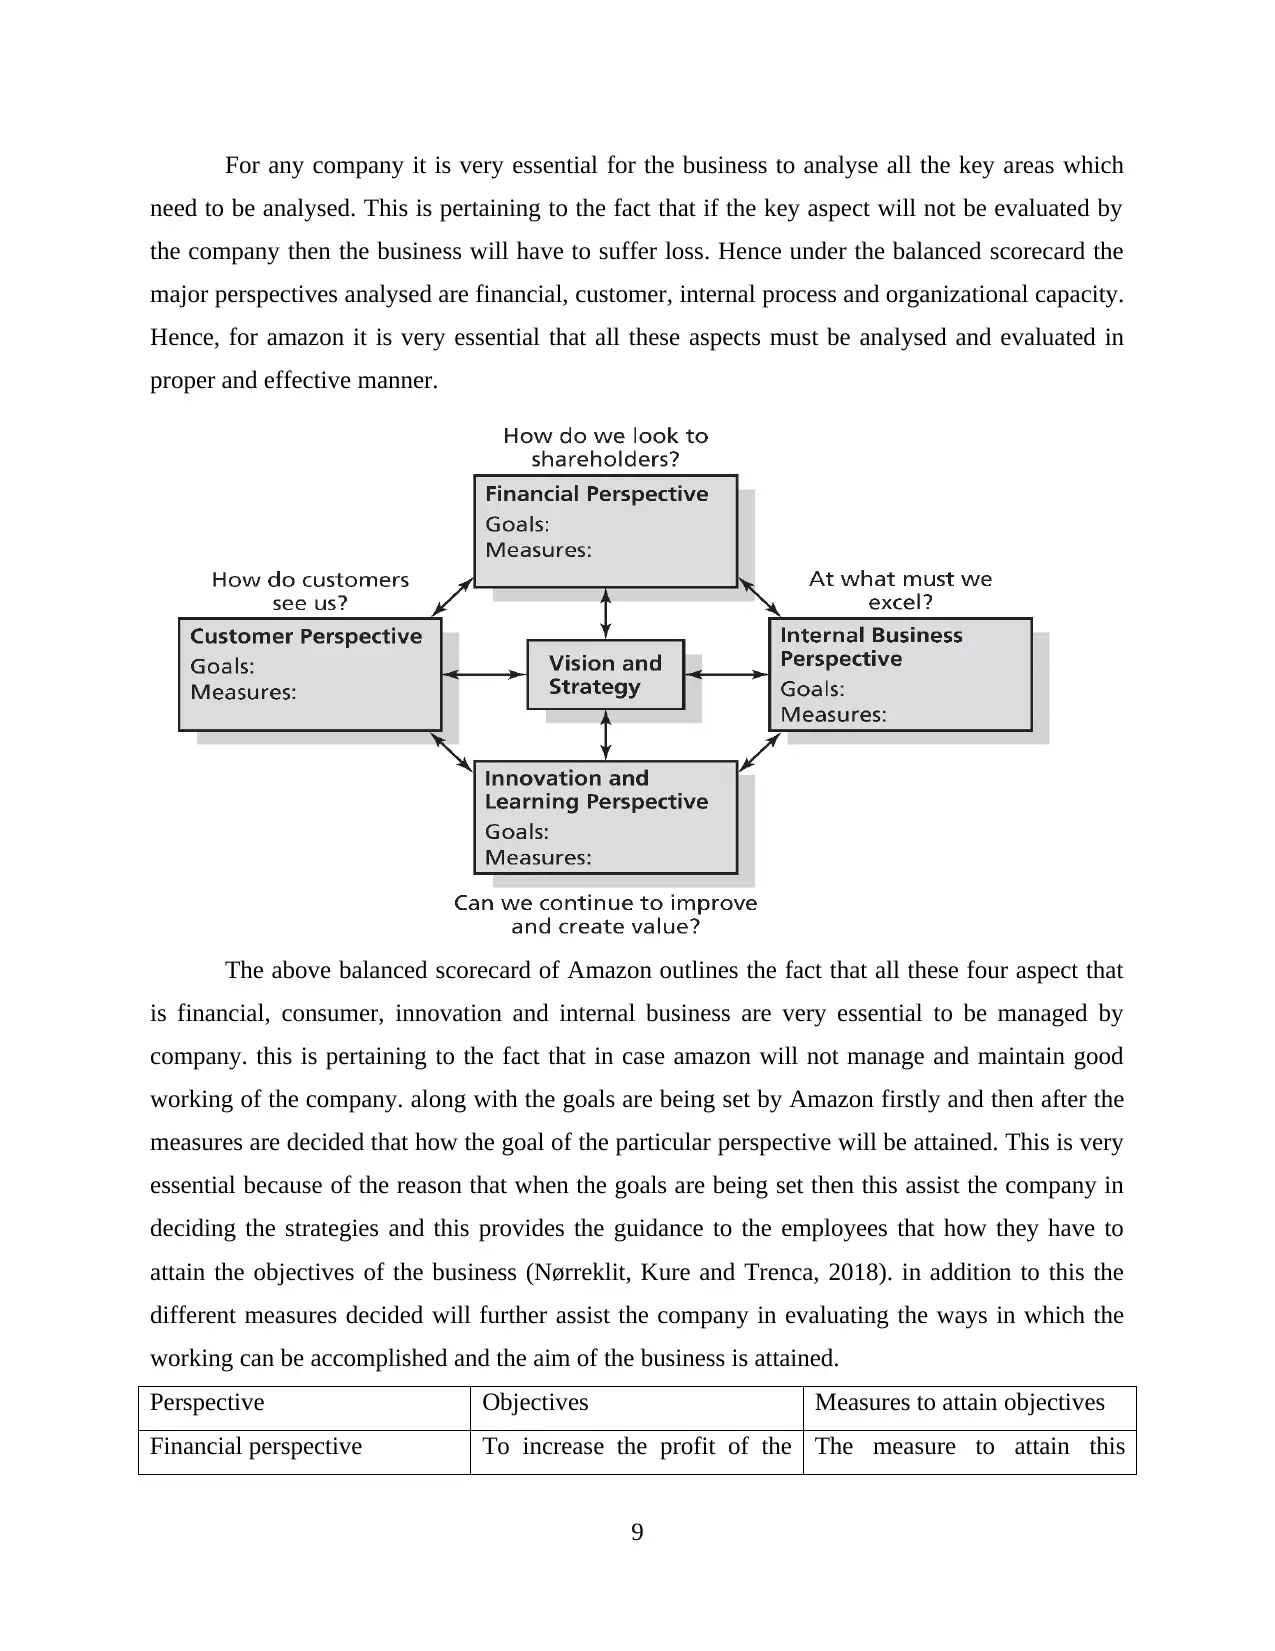
For any company it is very essential for the business to analyse all the key areas which
need to be analysed. This is pertaining to the fact that if the key aspect will not be evaluated by
the company then the business will have to suffer loss. Hence under the balanced scorecard the
major perspectives analysed are financial, customer, internal process and organizational capacity.
Hence, for amazon it is very essential that all these aspects must be analysed and evaluated in
proper and effective manner.
The above balanced scorecard of Amazon outlines the fact that all these four aspect that
is financial, consumer, innovation and internal business are very essential to be managed by
company. this is pertaining to the fact that in case amazon will not manage and maintain good
working of the company. along with the goals are being set by Amazon firstly and then after the
measures are decided that how the goal of the particular perspective will be attained. This is very
essential because of the reason that when the goals are being set then this assist the company in
deciding the strategies and this provides the guidance to the employees that how they have to
attain the objectives of the business (Nørreklit, Kure and Trenca, 2018). in addition to this the
different measures decided will further assist the company in evaluating the ways in which the
working can be accomplished and the aim of the business is attained.
Perspective Objectives Measures to attain objectives
Financial perspective To increase the profit of the The measure to attain this
9
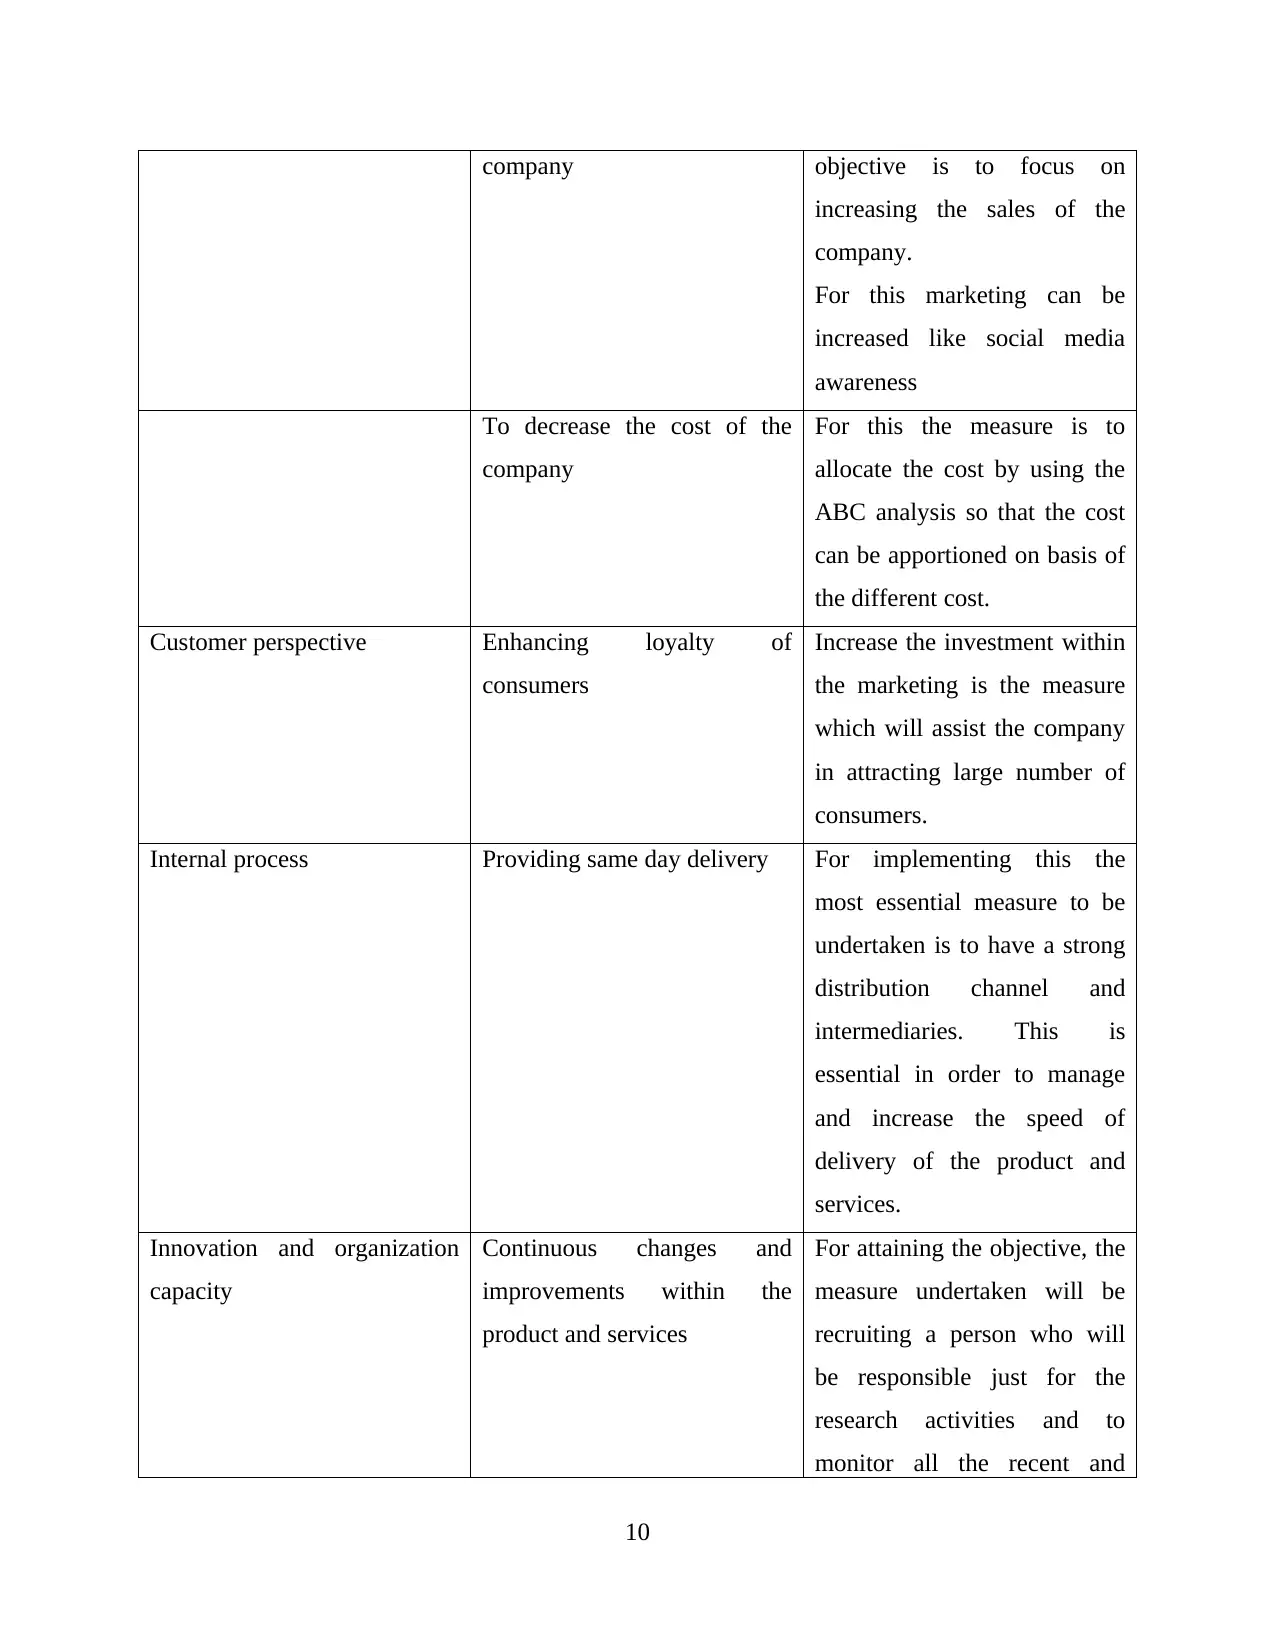
company objective is to focus on
increasing the sales of the
company.
For this marketing can be
increased like social media
awareness
To decrease the cost of the
company
For this the measure is to
allocate the cost by using the
ABC analysis so that the cost
can be apportioned on basis of
the different cost.
Customer perspective Enhancing loyalty of
consumers
Increase the investment within
the marketing is the measure
which will assist the company
in attracting large number of
consumers.
Internal process Providing same day delivery For implementing this the
most essential measure to be
undertaken is to have a strong
distribution channel and
intermediaries. This is
essential in order to manage
and increase the speed of
delivery of the product and
services.
Innovation and organization
capacity
Continuous changes and
improvements within the
product and services
For attaining the objective, the
measure undertaken will be
recruiting a person who will
be responsible just for the
research activities and to
monitor all the recent and
10
⊘ This is a preview!⊘
Do you want full access?
Subscribe today to unlock all pages.
Trusted by 1+ million students worldwide
1 out of 18
Related Documents


Your All-in-One AI-Powered Toolkit for Academic Success.
+13062052269
info@desklib.com
Available 24*7 on WhatsApp / Email
![[object Object]](/_next/static/media/star-bottom.7253800d.svg)
Unlock your academic potential
Copyright © 2020–2026 A2Z Services. All Rights Reserved. Developed and managed by ZUCOL.