Financial Performance Analysis Report: Super Entertainers Overview

Verified

Added on  2022/11/18

|12
|1124
|183
Report
AI Summary
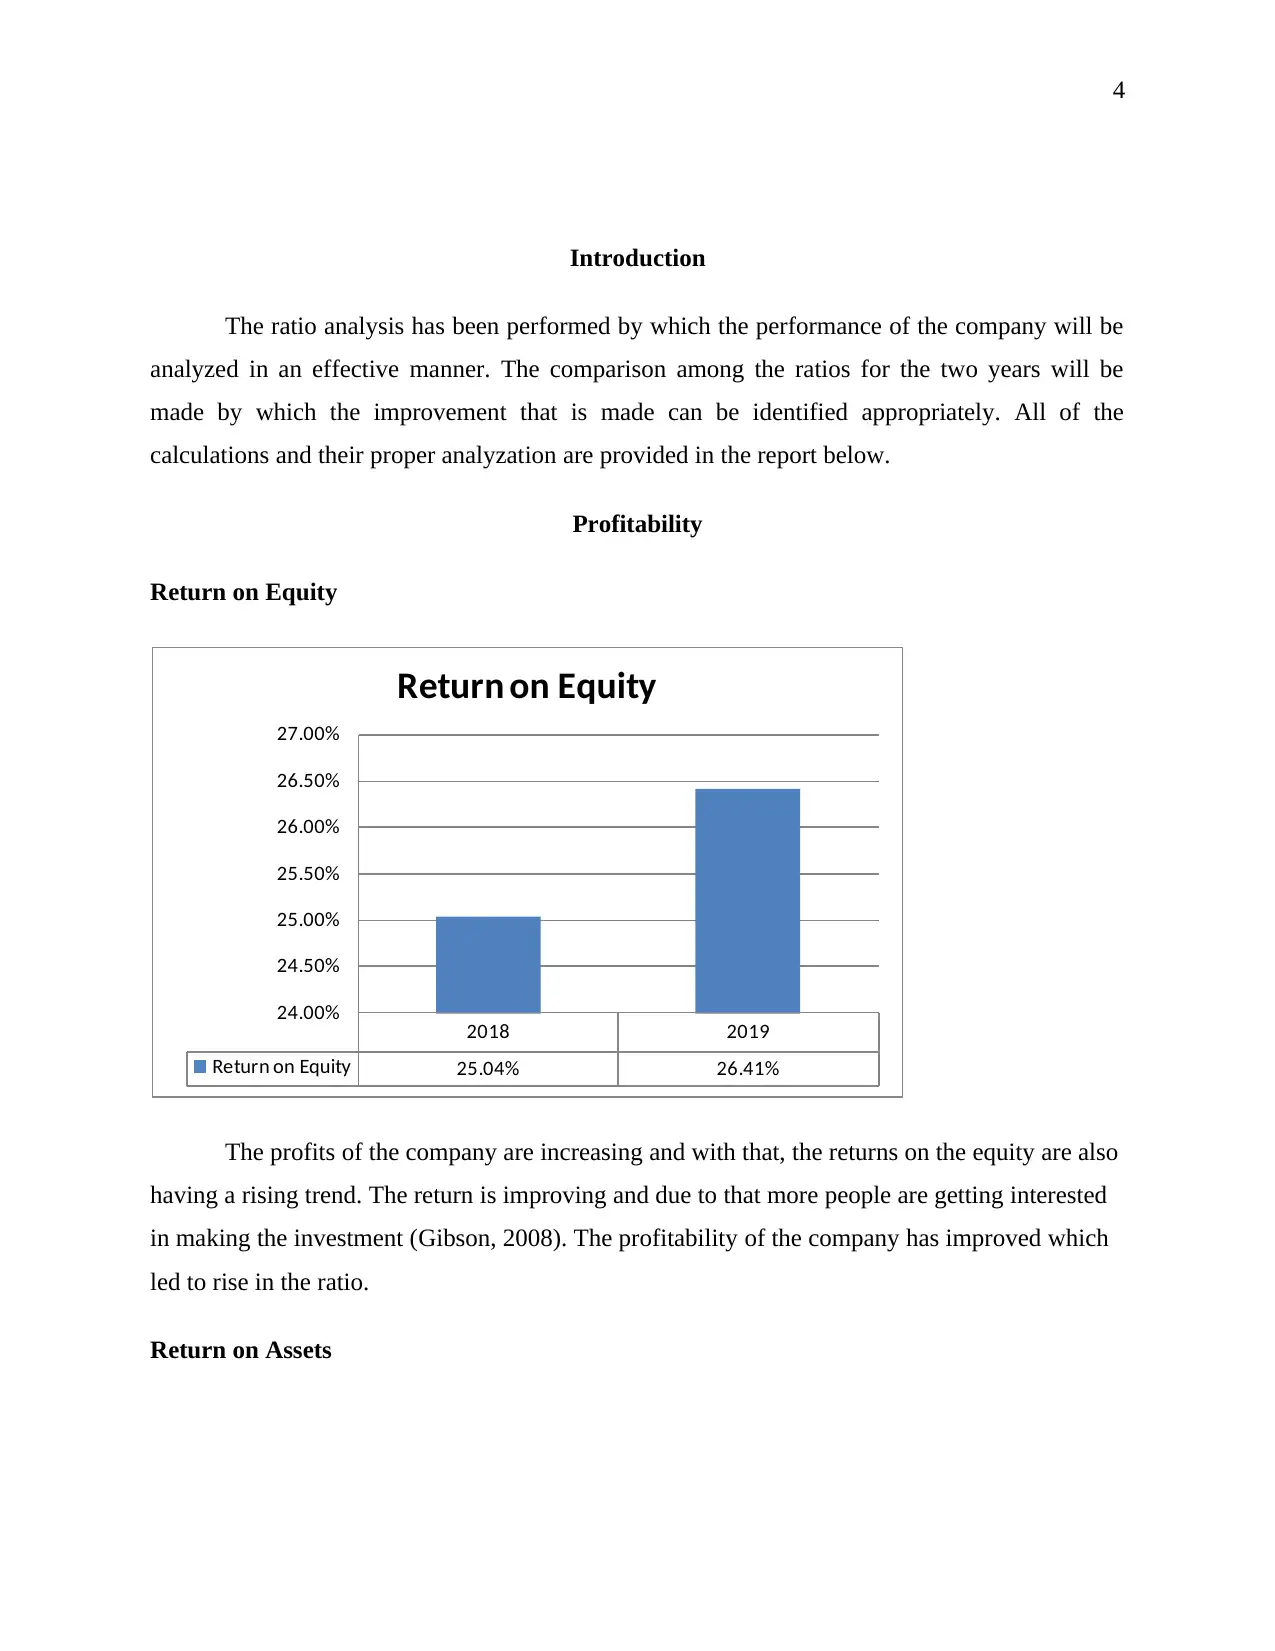
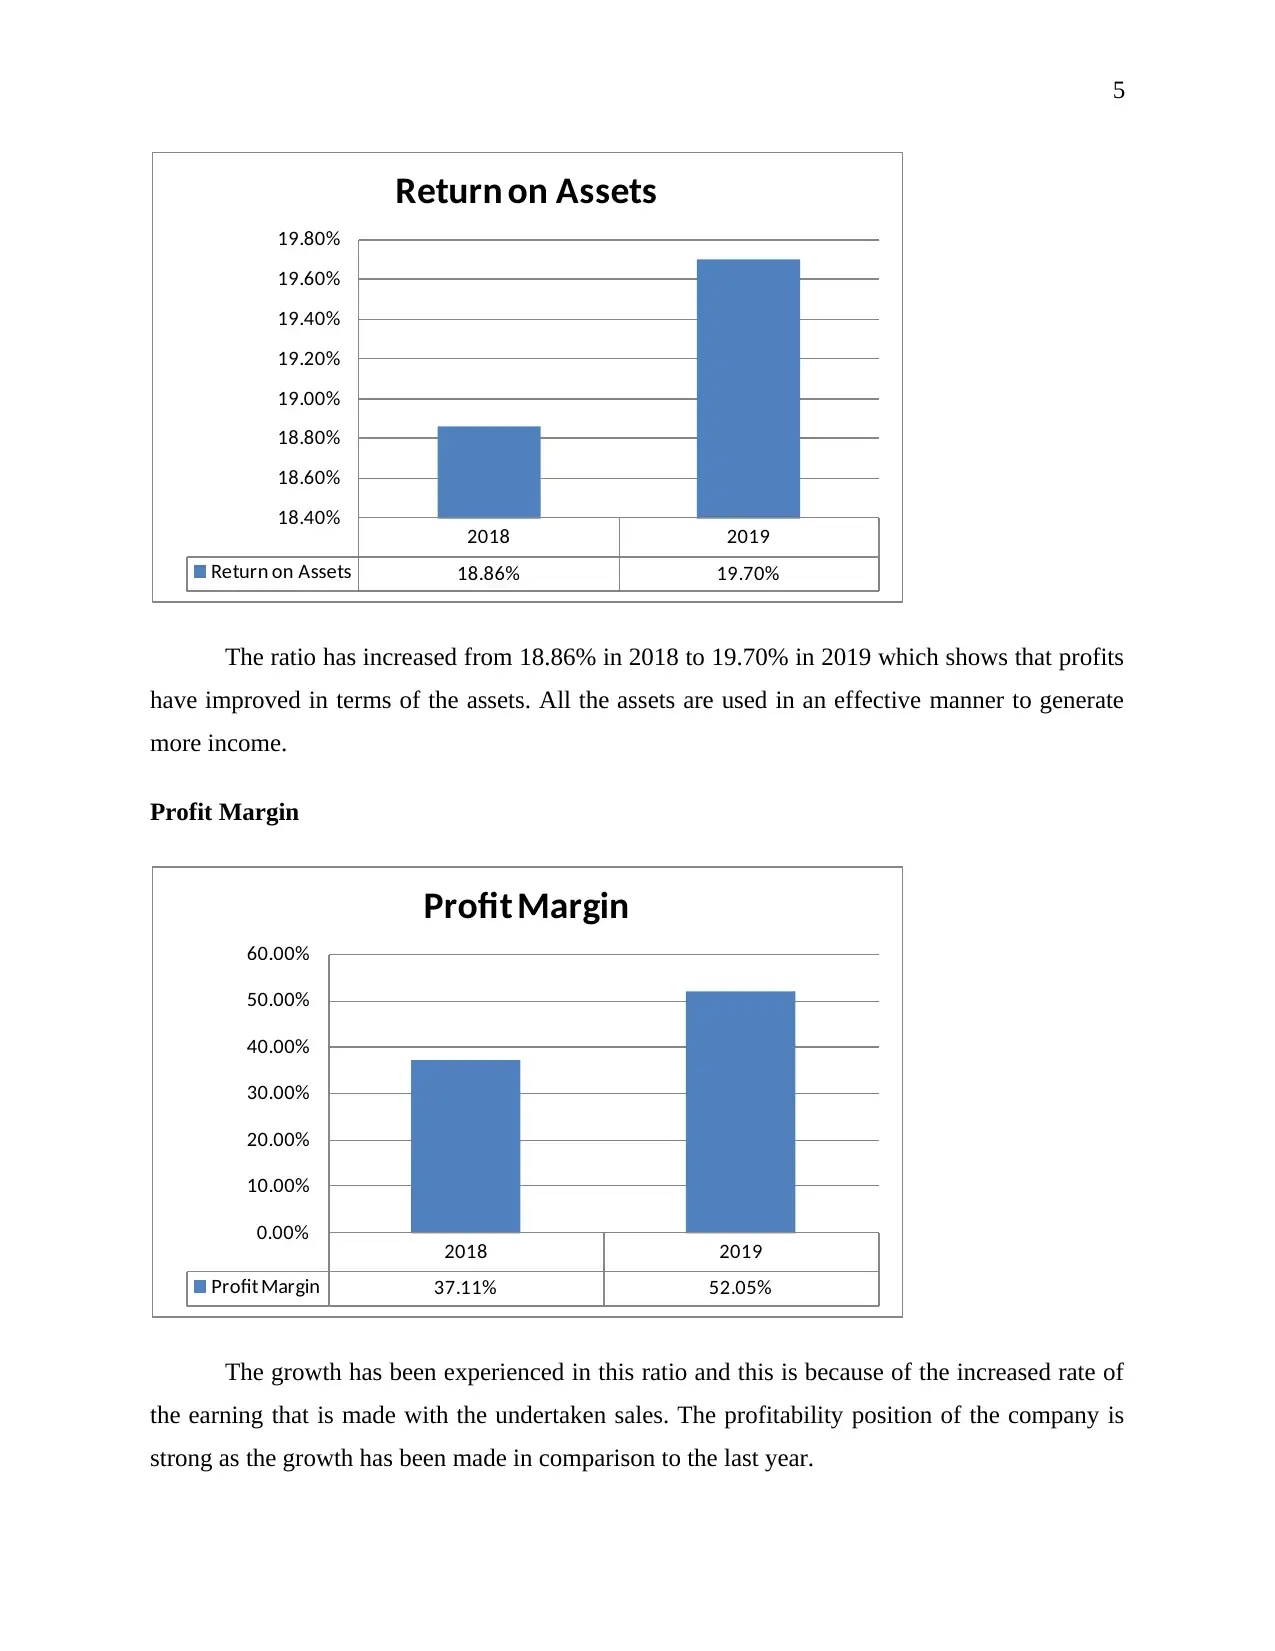
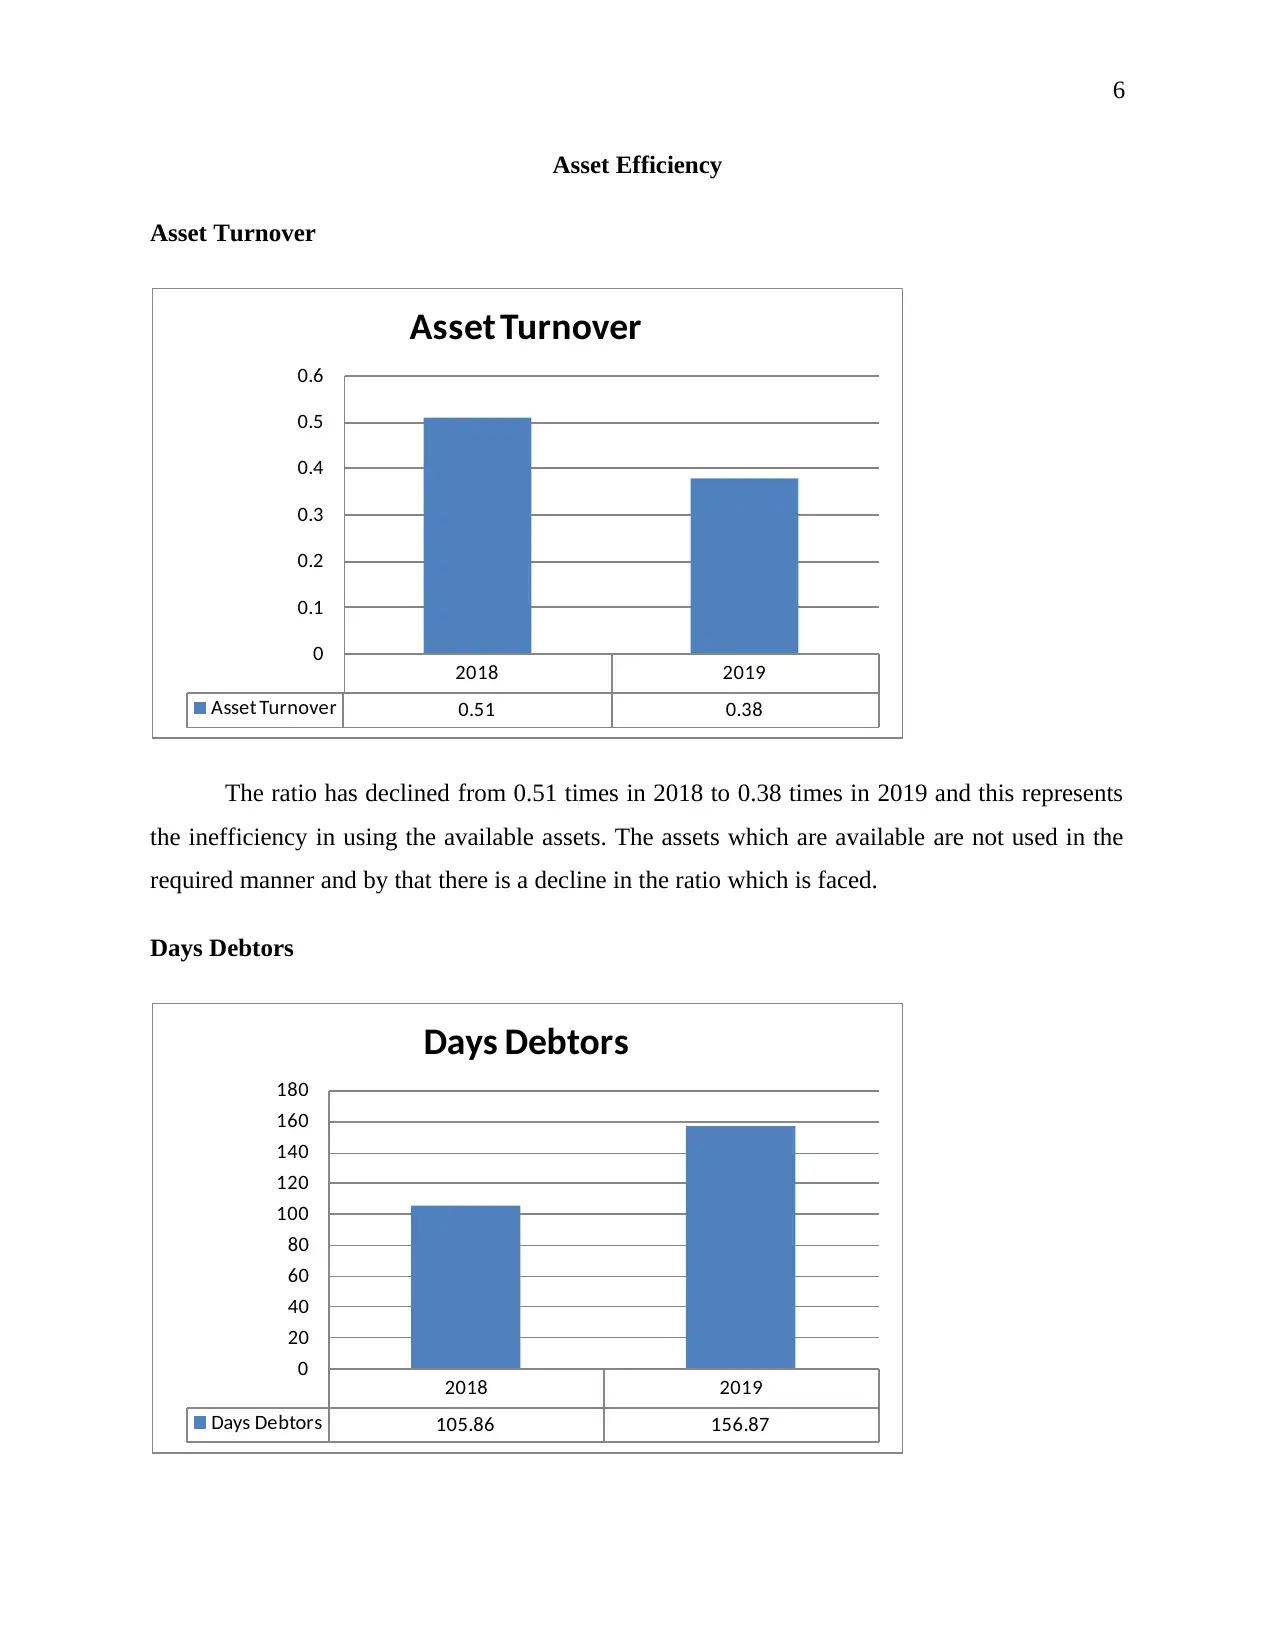
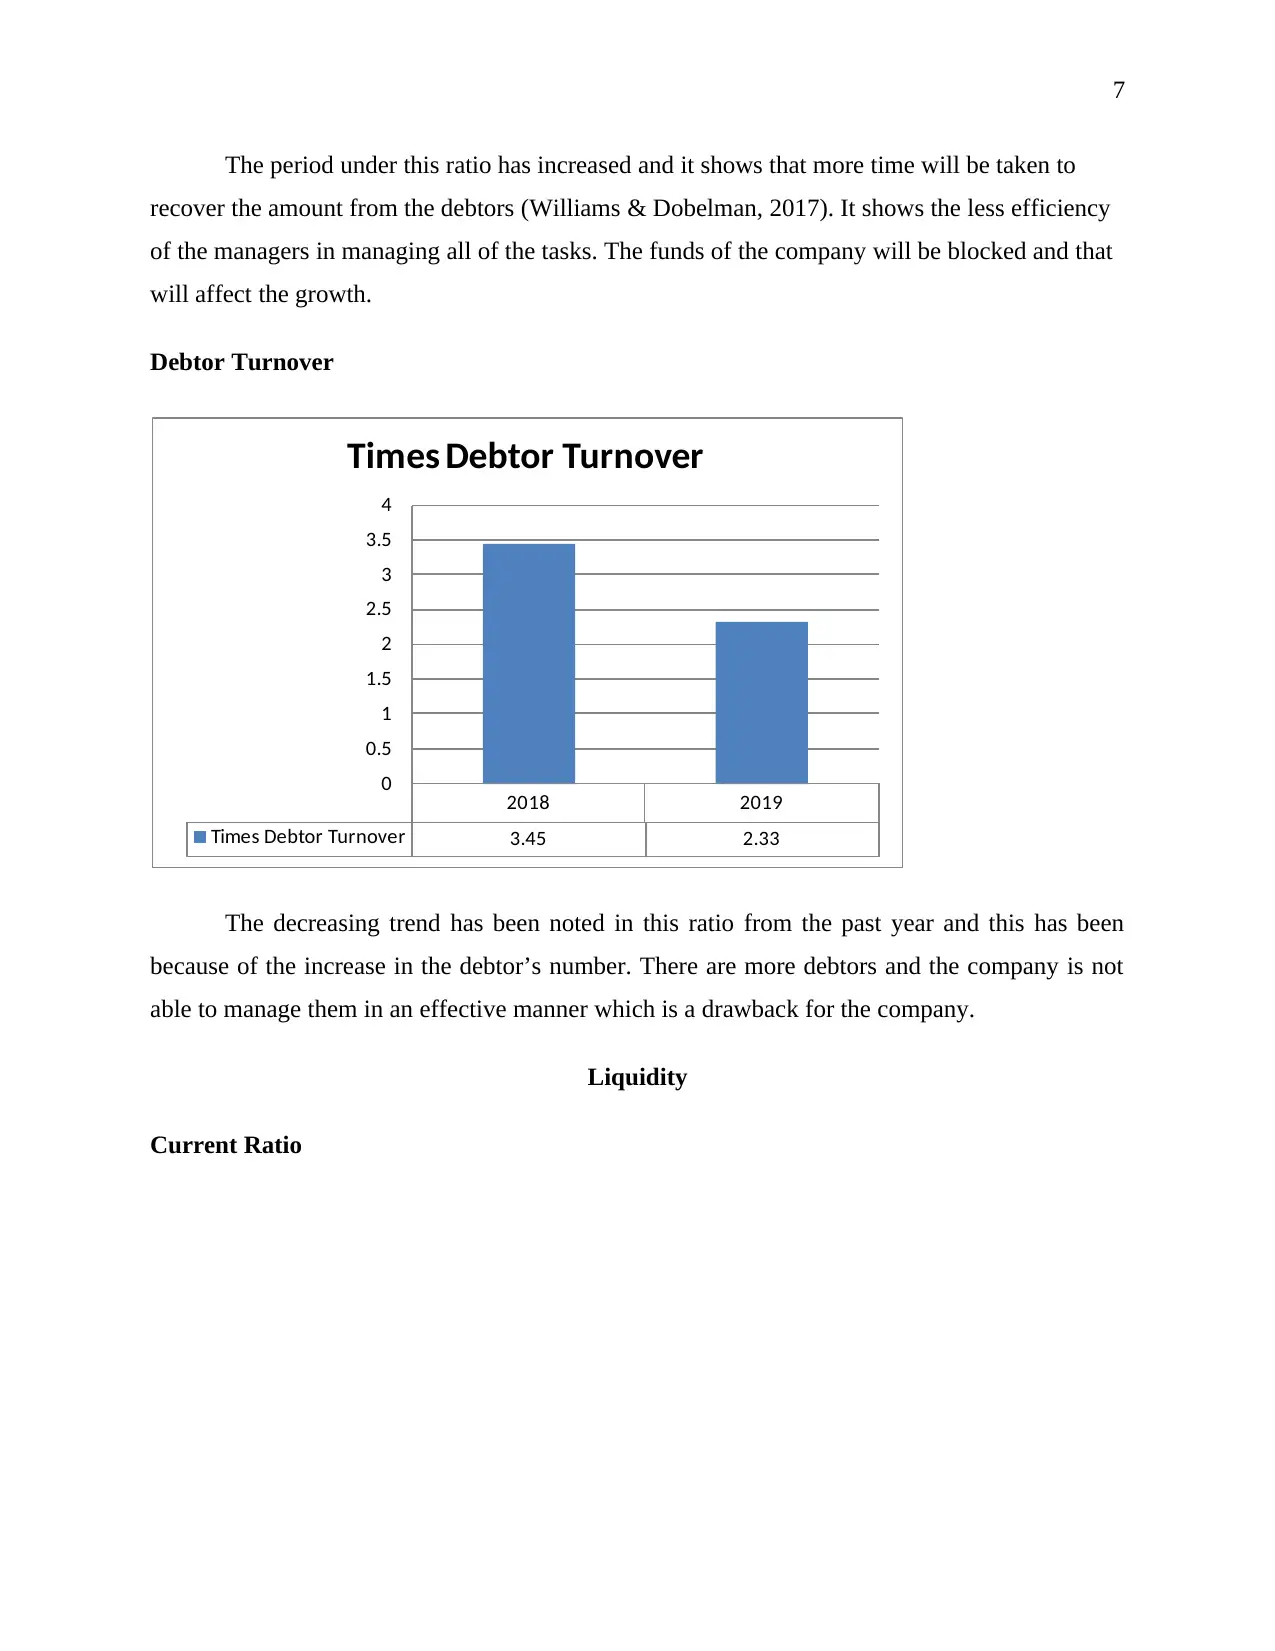
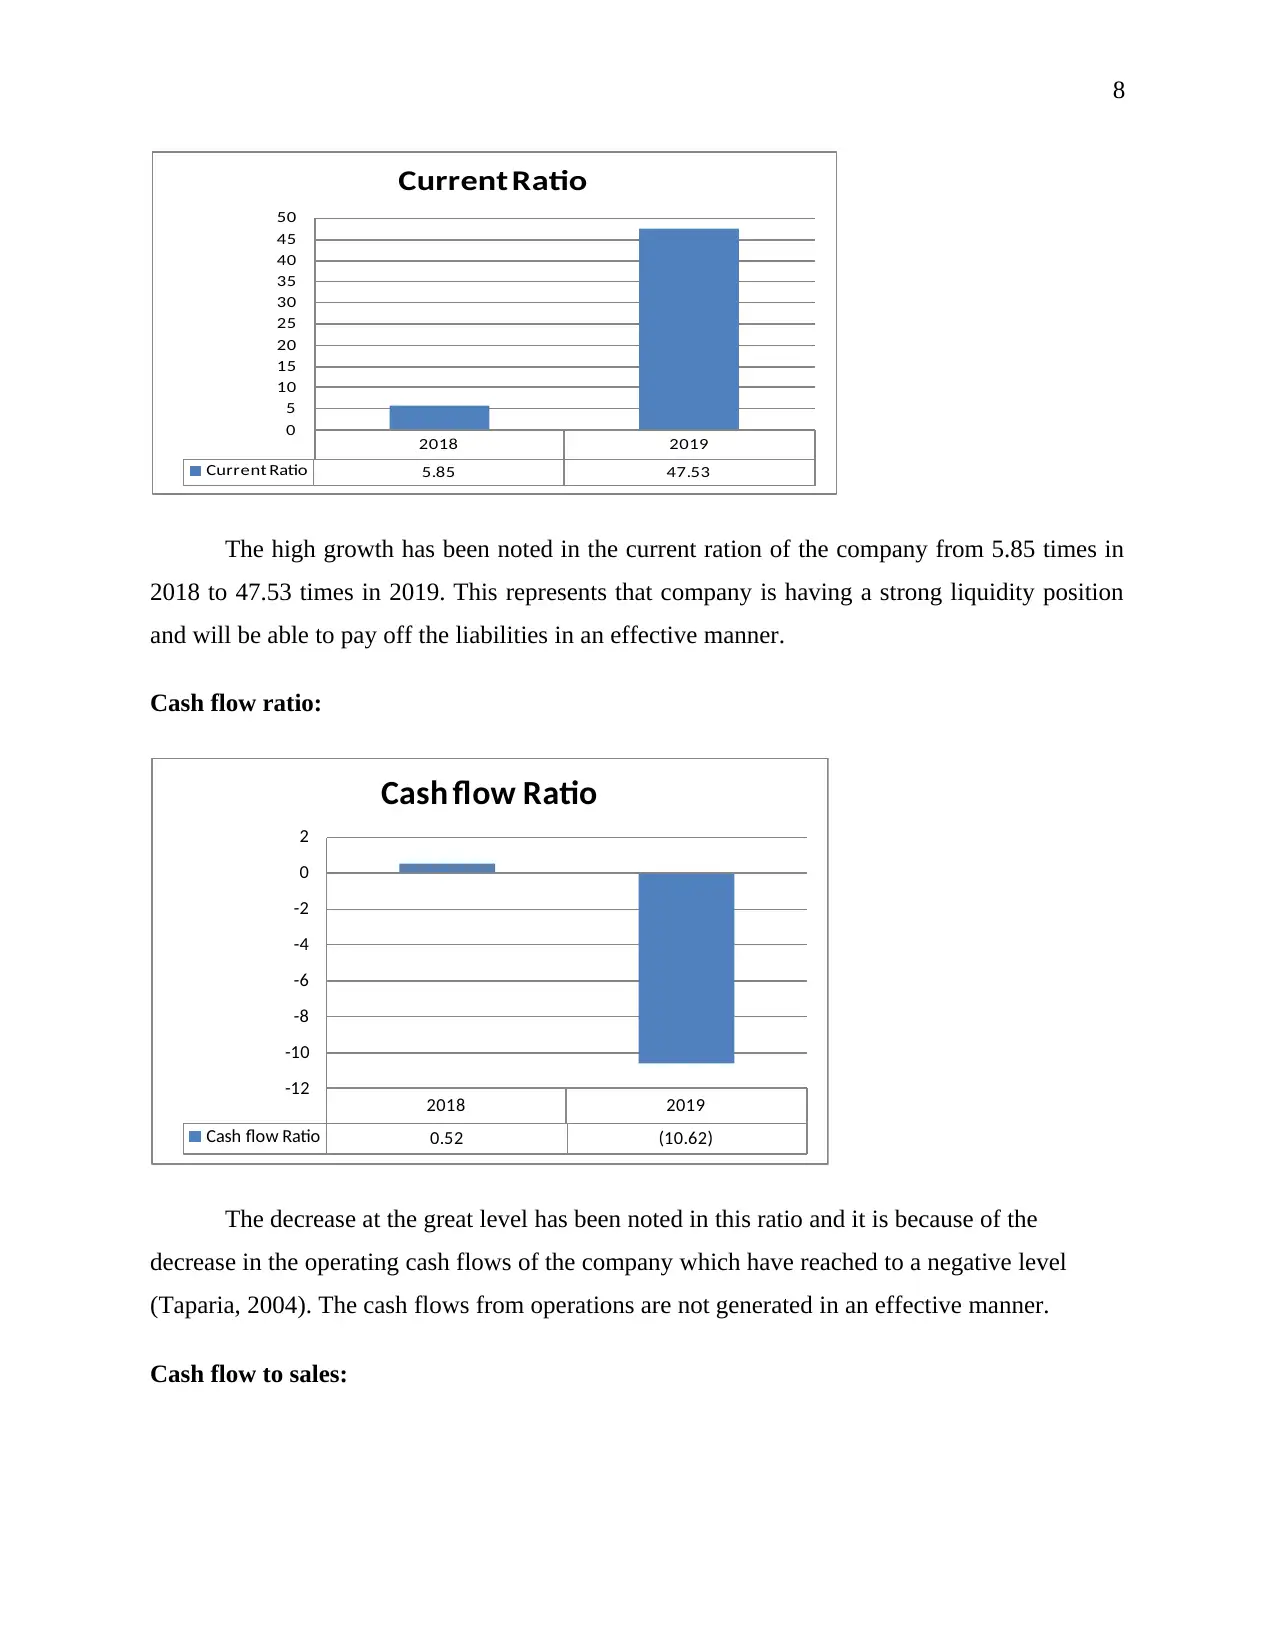
This report presents a comprehensive financial performance analysis of Super Entertainers, evaluating its performance using ratio analysis for the years 2018 and 2019. The analysis covers key areas, including profitability, asset efficiency, liquidity, and capital structure. The report identifies a growing profitability trend, with improvements in return on equity and assets, indicating effective use of resources. Although the company maintains a strong liquidity position, with a high current ratio, operating cash flows are negative. The capital structure is healthy, with higher equity funds compared to debt, resulting in a high solvency ratio. However, the analysis highlights inefficiencies in managing debtors, requiring improvement. The report concludes with limitations, such as the use of historical data and the need for qualitative aspects, and provides references to support the findings. This report provides valuable insights into the financial health and operational efficiency of Super Entertainers.
Document Page
1
Performance evaluation
tabler-icon-diamond-filled.svg

Secure Best Marks with AI Grader

Need help grading? Try our AI Grader for instant feedback on your assignments.
Document Page
2
Executive Summary
The evaluation of the performance has been made for the Super entertainers by the help
of the ratios. It has been identified that the profitability in the company is growing which will be
helpful in future development. The operating cash flows are negative but the liquidity is
maintained by the company in effective manner. The equity funds are higher in the company in
comparison to debts and due to that enjoys high solvency ratio. The management is not made in
the appropriate manner for the collection from debtors and that needs improvement.
Document Page
3
Table of Contents
Executive Summary.........................................................................................................................2
Introduction......................................................................................................................................4
Profitability......................................................................................................................................4
Asset Efficiency...............................................................................................................................6
Liquidity..........................................................................................................................................7
Capital Structure..............................................................................................................................9
Limitations.....................................................................................................................................11
Conclusion.....................................................................................................................................11
References......................................................................................................................................12
Document Page
4
Introduction
The ratio analysis has been performed by which the performance of the company will be
analyzed in an effective manner. The comparison among the ratios for the two years will be
made by which the improvement that is made can be identified appropriately. All of the
calculations and their proper analyzation are provided in the report below.
Profitability
Return on Equity
2018 2019
Return on Equity 25.04% 26.41%
24.00%
24.50%
25.00%
25.50%
26.00%
26.50%
27.00%
Return on Equity
The profits of the company are increasing and with that, the returns on the equity are also
having a rising trend. The return is improving and due to that more people are getting interested
in making the investment (Gibson, 2008). The profitability of the company has improved which
led to rise in the ratio.
Return on Assets
tabler-icon-diamond-filled.svg

Secure Best Marks with AI Grader

Need help grading? Try our AI Grader for instant feedback on your assignments.
Document Page
5
2018 2019
Return on Assets 18.86% 19.70%
18.40%
18.60%
18.80%
19.00%
19.20%
19.40%
19.60%
19.80%
Return on Assets
The ratio has increased from 18.86% in 2018 to 19.70% in 2019 which shows that profits
have improved in terms of the assets. All the assets are used in an effective manner to generate
more income.
Profit Margin
2018 2019
Profit Margin 37.11% 52.05%
0.00%
10.00%
20.00%
30.00%
40.00%
50.00%
60.00%
Profit Margin
The growth has been experienced in this ratio and this is because of the increased rate of
the earning that is made with the undertaken sales. The profitability position of the company is
strong as the growth has been made in comparison to the last year.
Document Page
6
Asset Efficiency
Asset Turnover
2018 2019
Asset Turnover 0.51 0.38
0
0.1
0.2
0.3
0.4
0.5
0.6
Asset Turnover
The ratio has declined from 0.51 times in 2018 to 0.38 times in 2019 and this represents
the inefficiency in using the available assets. The assets which are available are not used in the
required manner and by that there is a decline in the ratio which is faced.
Days Debtors
2018 2019
Days Debtors 105.86 156.87
0
20
40
60
80
100
120
140
160
180
Days Debtors
Document Page
7
The period under this ratio has increased and it shows that more time will be taken to
recover the amount from the debtors (Williams & Dobelman, 2017). It shows the less efficiency
of the managers in managing all of the tasks. The funds of the company will be blocked and that
will affect the growth.
Debtor Turnover
2018 2019
Times Debtor Turnover 3.45 2.33
0
0.5
1
1.5
2
2.5
3
3.5
4
Times Debtor Turnover
The decreasing trend has been noted in this ratio from the past year and this has been
because of the increase in the debtor’s number. There are more debtors and the company is not
able to manage them in an effective manner which is a drawback for the company.
Liquidity
Current Ratio
tabler-icon-diamond-filled.svg

Paraphrase This Document

Need a fresh take? Get an instant paraphrase of this document with our AI Paraphraser
Document Page
8
2018 2019
Current Ratio 5.85 47.53
0
5
10
15
20
25
30
35
40
45
50
Current Ratio
The high growth has been noted in the current ration of the company from 5.85 times in
2018 to 47.53 times in 2019. This represents that company is having a strong liquidity position
and will be able to pay off the liabilities in an effective manner.
Cash flow ratio:
2018 2019
Cash flow Ratio 0.52 (10.62)
-12
-10
-8
-6
-4
-2
0
2
Cash flow Ratio
The decrease at the great level has been noted in this ratio and it is because of the
decrease in the operating cash flows of the company which have reached to a negative level
(Taparia, 2004). The cash flows from operations are not generated in an effective manner.
Cash flow to sales:
Document Page
9
2018 2019
Cash flow to sales 10.33% -34.52%
-40.00%
-35.00%
-30.00%
-25.00%
-20.00%
-15.00%
-10.00%
-5.00%
0.00%
5.00%
10.00%
15.00%
Cash flow to sales
This has also declined and the reason is the negative cash-flow which is generated from
the operations. The improvement will have to be made for future development.
Capital Structure
Debt to Equity
2018 2019
Debt to Equity 32.76% 34.07%
32.00%
32.50%
33.00%
33.50%
34.00%
34.50%
Debt to Equity
Debt to equity ratio of Super Entertainers is increasing from 32.76% in 2018 to 34.07%
in 2019 which shows that the debt in comparison to the equity is rising in the business. The loan
has been taken and that has resulted in an increase in the debts.
Document Page
10
Debt ratio:
The total liabilities which are the company is maintaining in respect to the total assets are
increasing and that shows there is increase in the debt. The level is still in control and will not be
harming the solvency position of the business.
Interest Coverage Ratio
2018 2019
Interest Coverage Ratio 21.8 11.09
0
5
10
15
20
25
Interest Coverage Ratio
The interest coverage has declined in the current year and this shows that the profits are
now less capable of covering the interest (Maaloul & Zéghal, 2015). The interest which is there
tabler-icon-diamond-filled.svg

Secure Best Marks with AI Grader

Need help grading? Try our AI Grader for instant feedback on your assignments.
Document Page
11
will be covered in an effective manner with the available earnings and no risk will be faced in
that respect.
Limitations
The main limitation which is identified in the analyzation is the use of historical data
which tells about the past performance and future aspects are not taken into account. There is
also the need to include the qualitative aspects as only the numerical data is used. It is highly
required that other information should also be included in analyzation.
Conclusion
The report has presented about the performance of the business with the help of various
ratios. The profitability is analyzed and it shows that there are enough profits which are
maintained and an increase is noted. The liquidity is also maintained and company will be able to
meet with the obligations. There is a need to improve the management by which the collection
period will be improved. The capital structure is maintained and company is able to cover the
interest charge properly.
Document Page
12
References
Gibson, C. (2008). Financial Reporting and Analysis: Using Financial Accounting Information
(11 ed.). NY: Cengage Learning.
Maaloul, A., & Zéghal, D. (2015). Financial statement informativeness and intellectual capital
disclosure: An empirical analysis. Journal of Financial Reporting and
Accounting, 13(1), 66-90.
Taparia, J. (2004). Understanding Financial Statements: A Journalist's Guide. NY: Marion
Street Press, Inc.
Williams, E. E., & Dobelman, J. A. (2017). Financial statement analysis. World Scientific Book
Chapters, 109-169.
chevron_up_icon
1 out of 12
circle_padding
hide_on_mobile
zoom_out_icon
logo.png

Your All-in-One AI-Powered Toolkit for Academic Success.

Available 24*7 on WhatsApp / Email

[object Object]