Financial Performance Analysis of Lynch Quality Goods: 2016-2018
VerifiedAdded on  2022/10/14
|28
|5156
|143
Homework Assignment
AI Summary
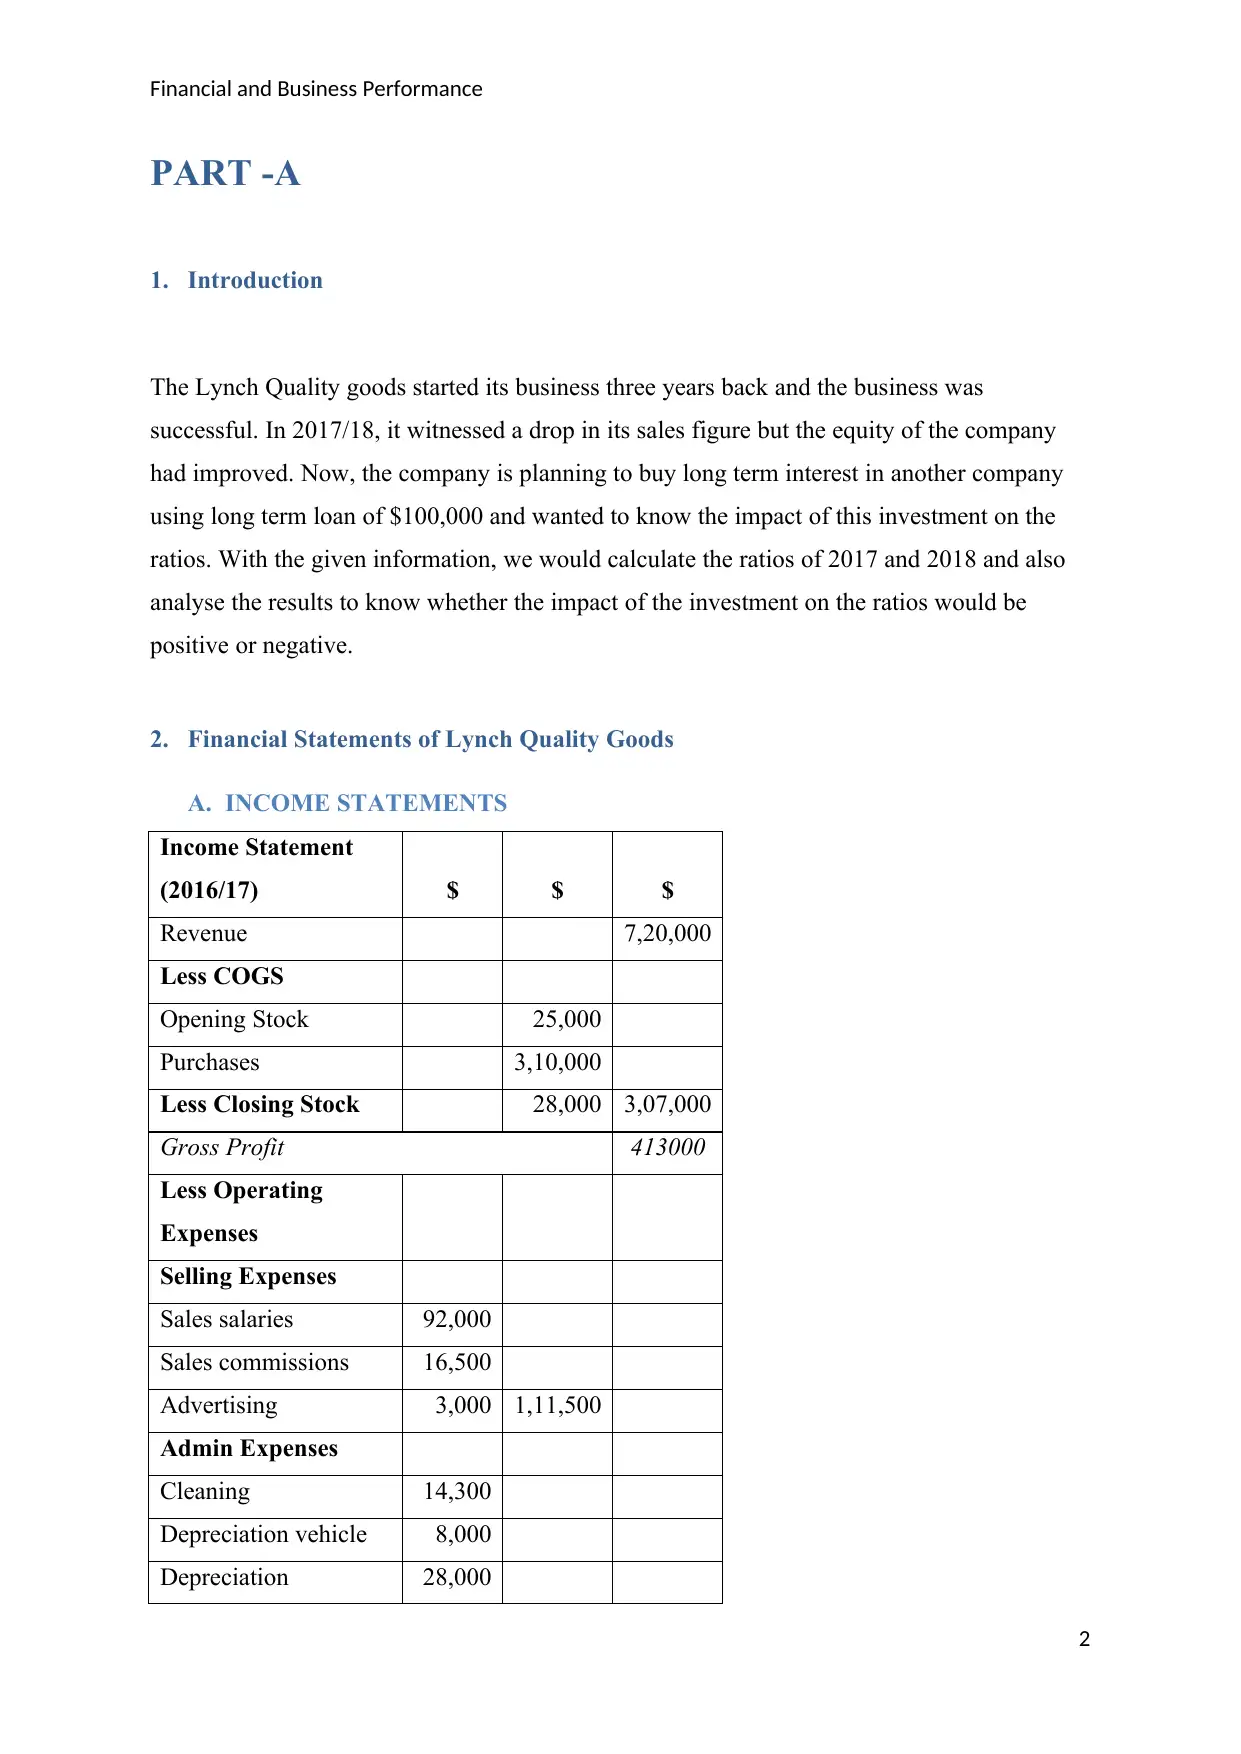
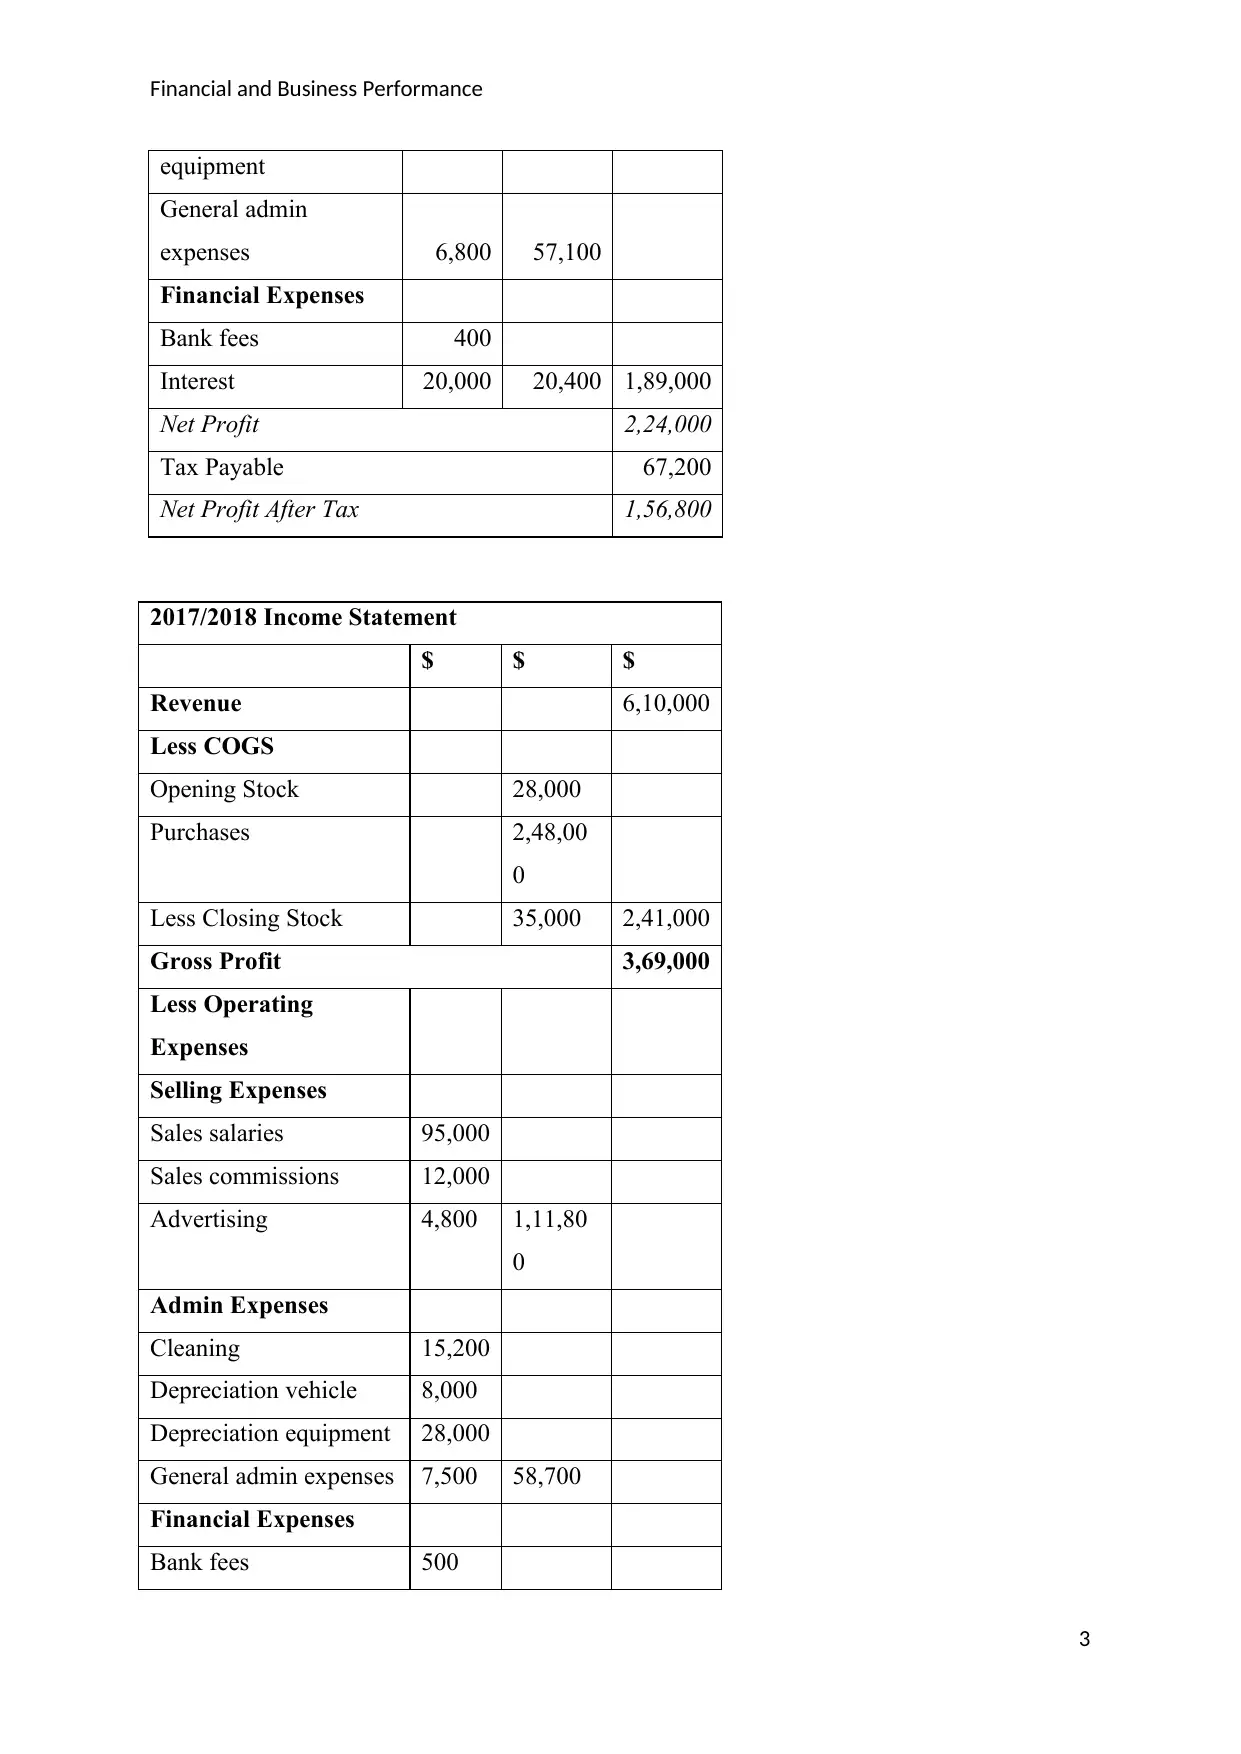
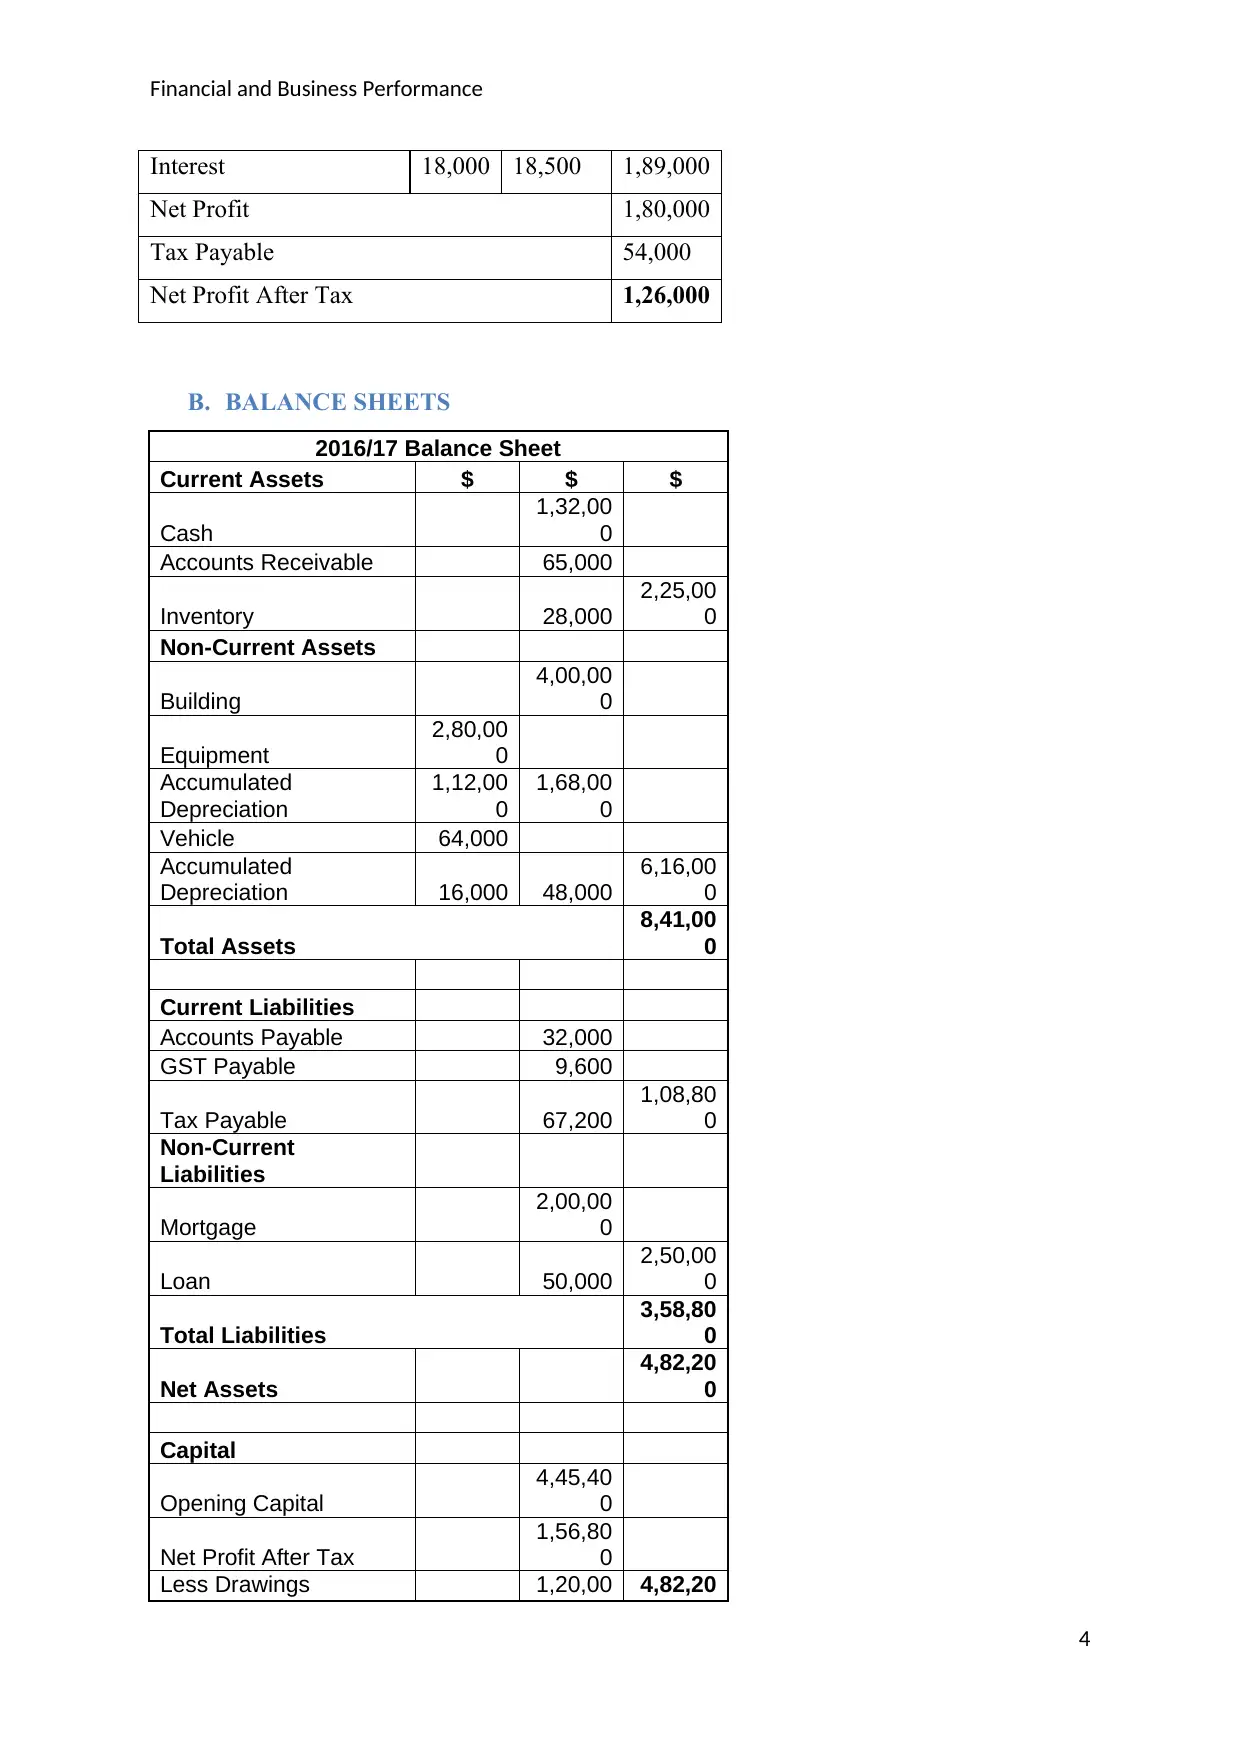
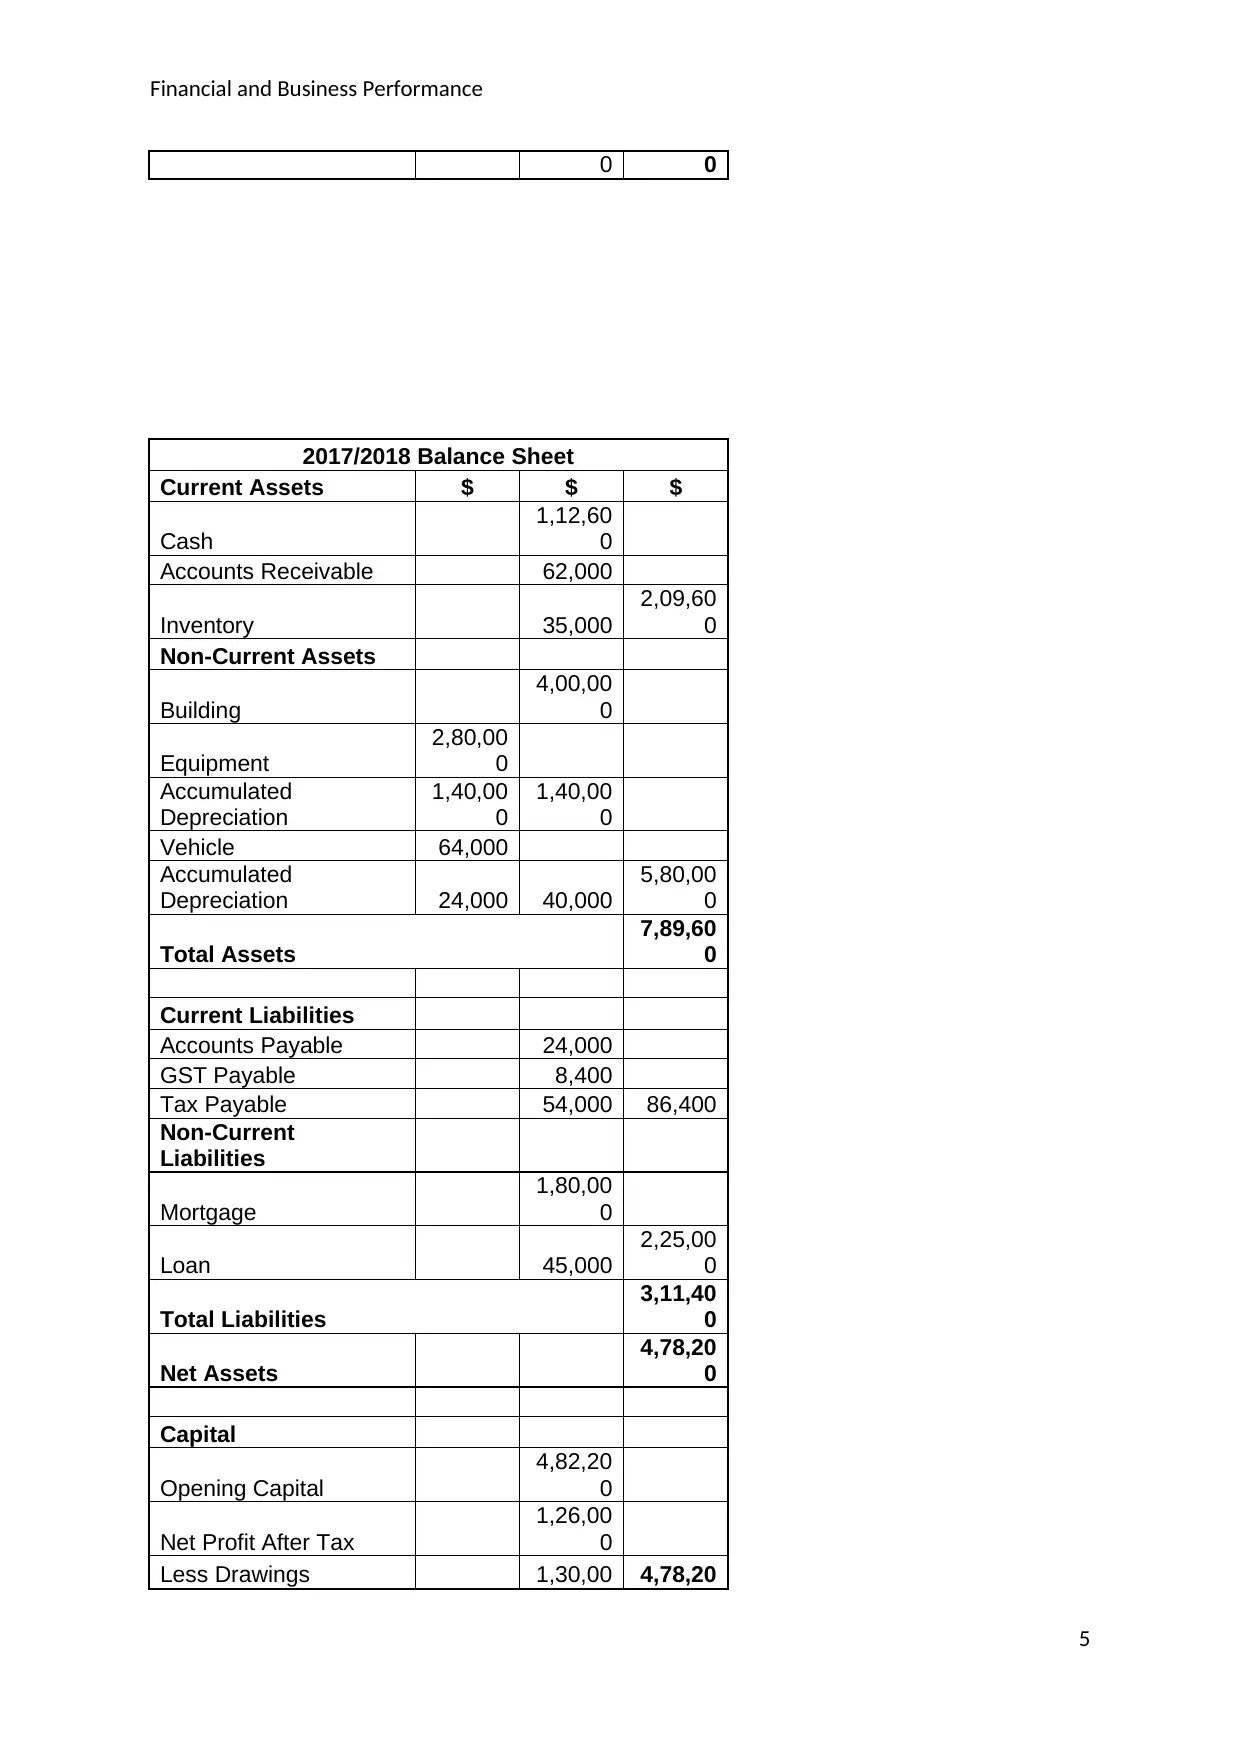
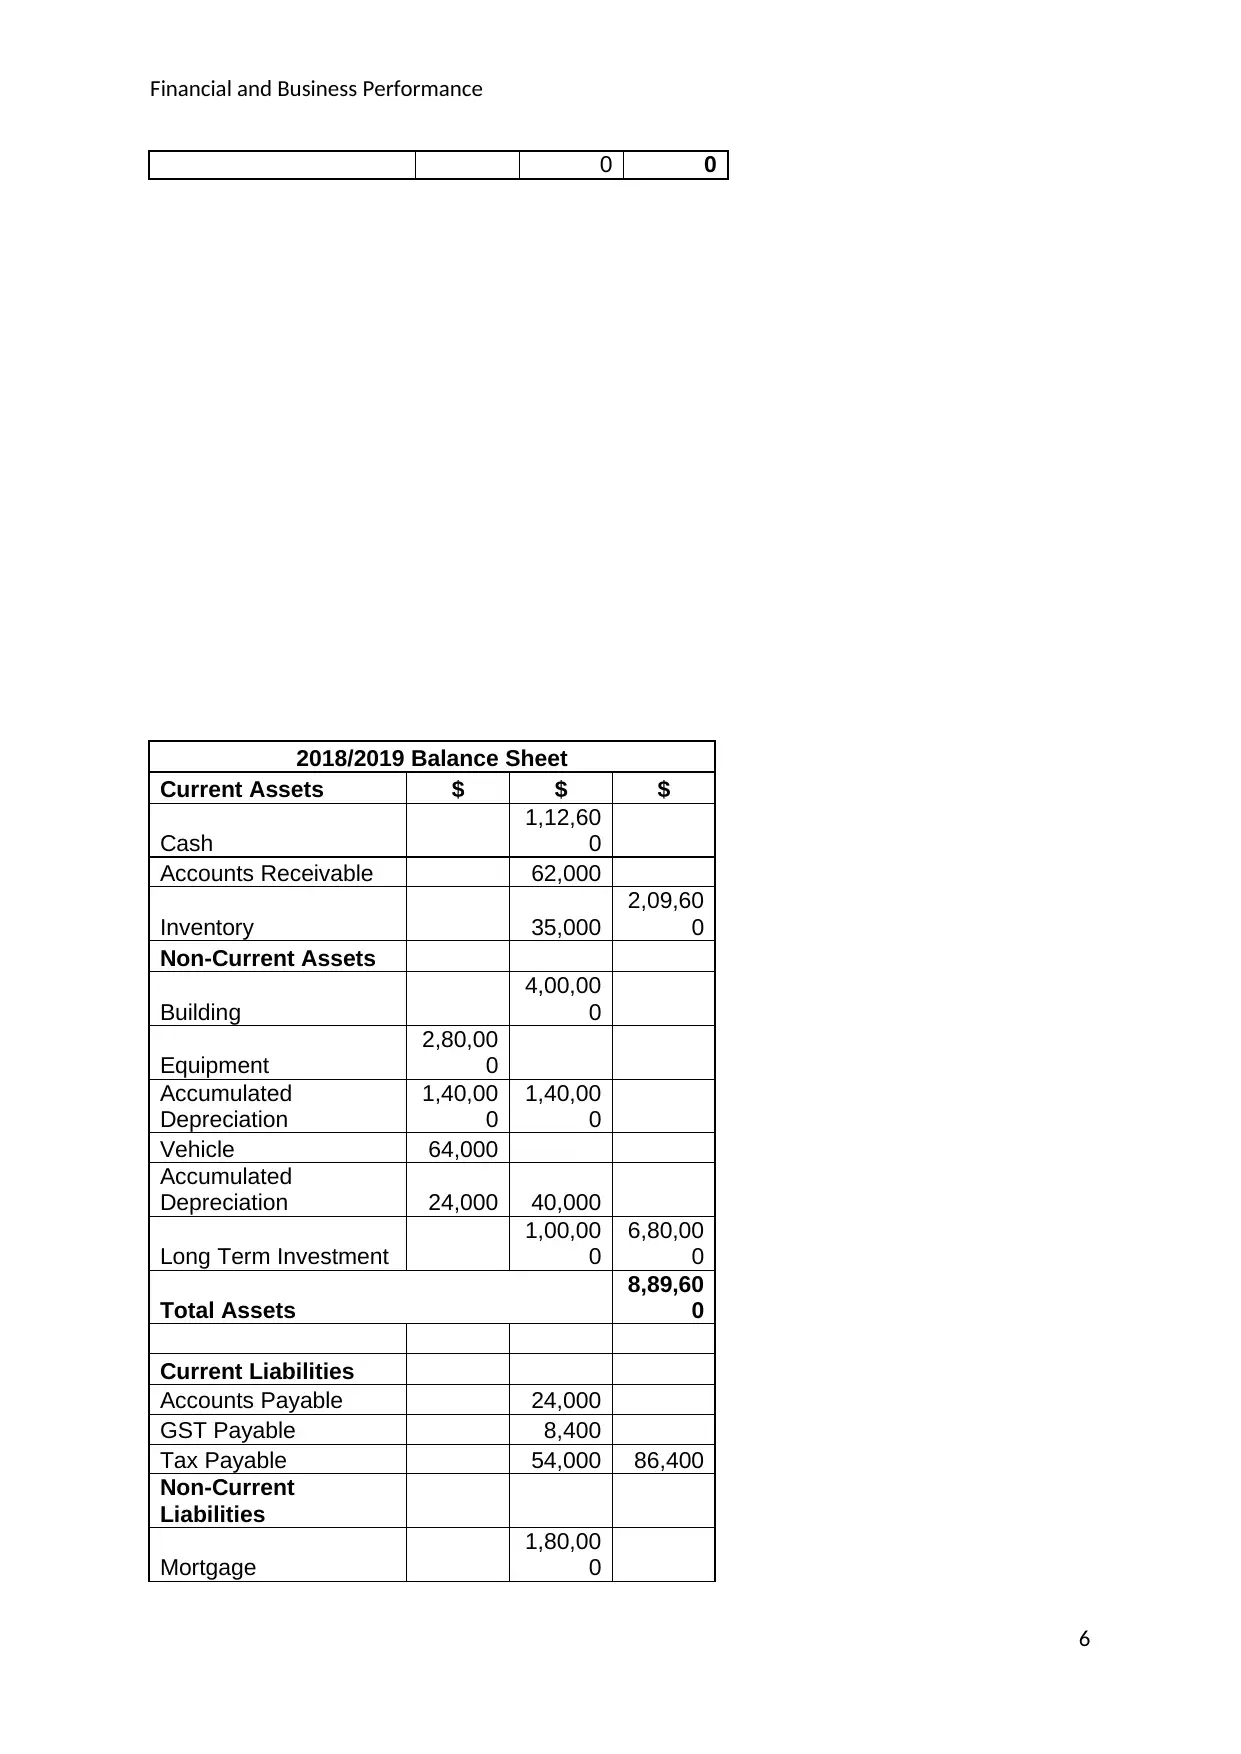
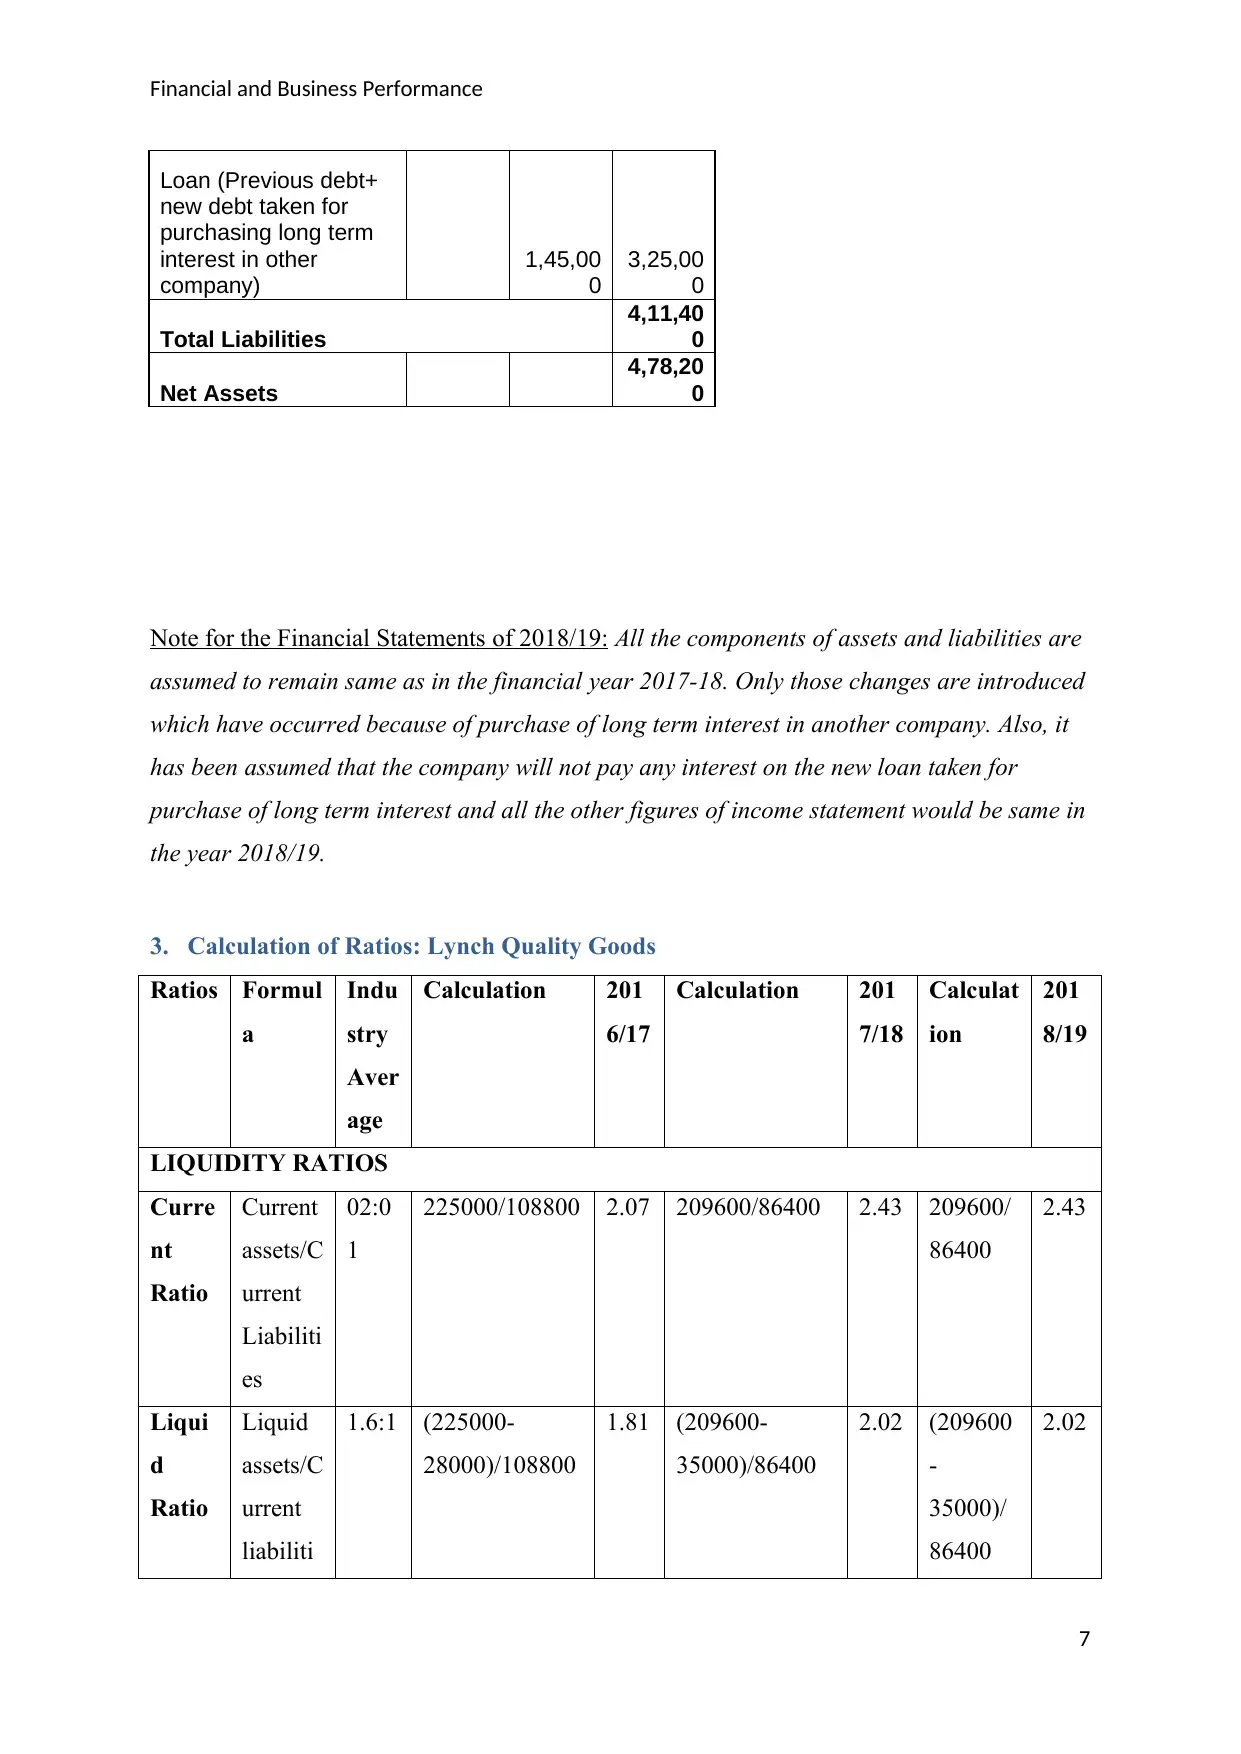
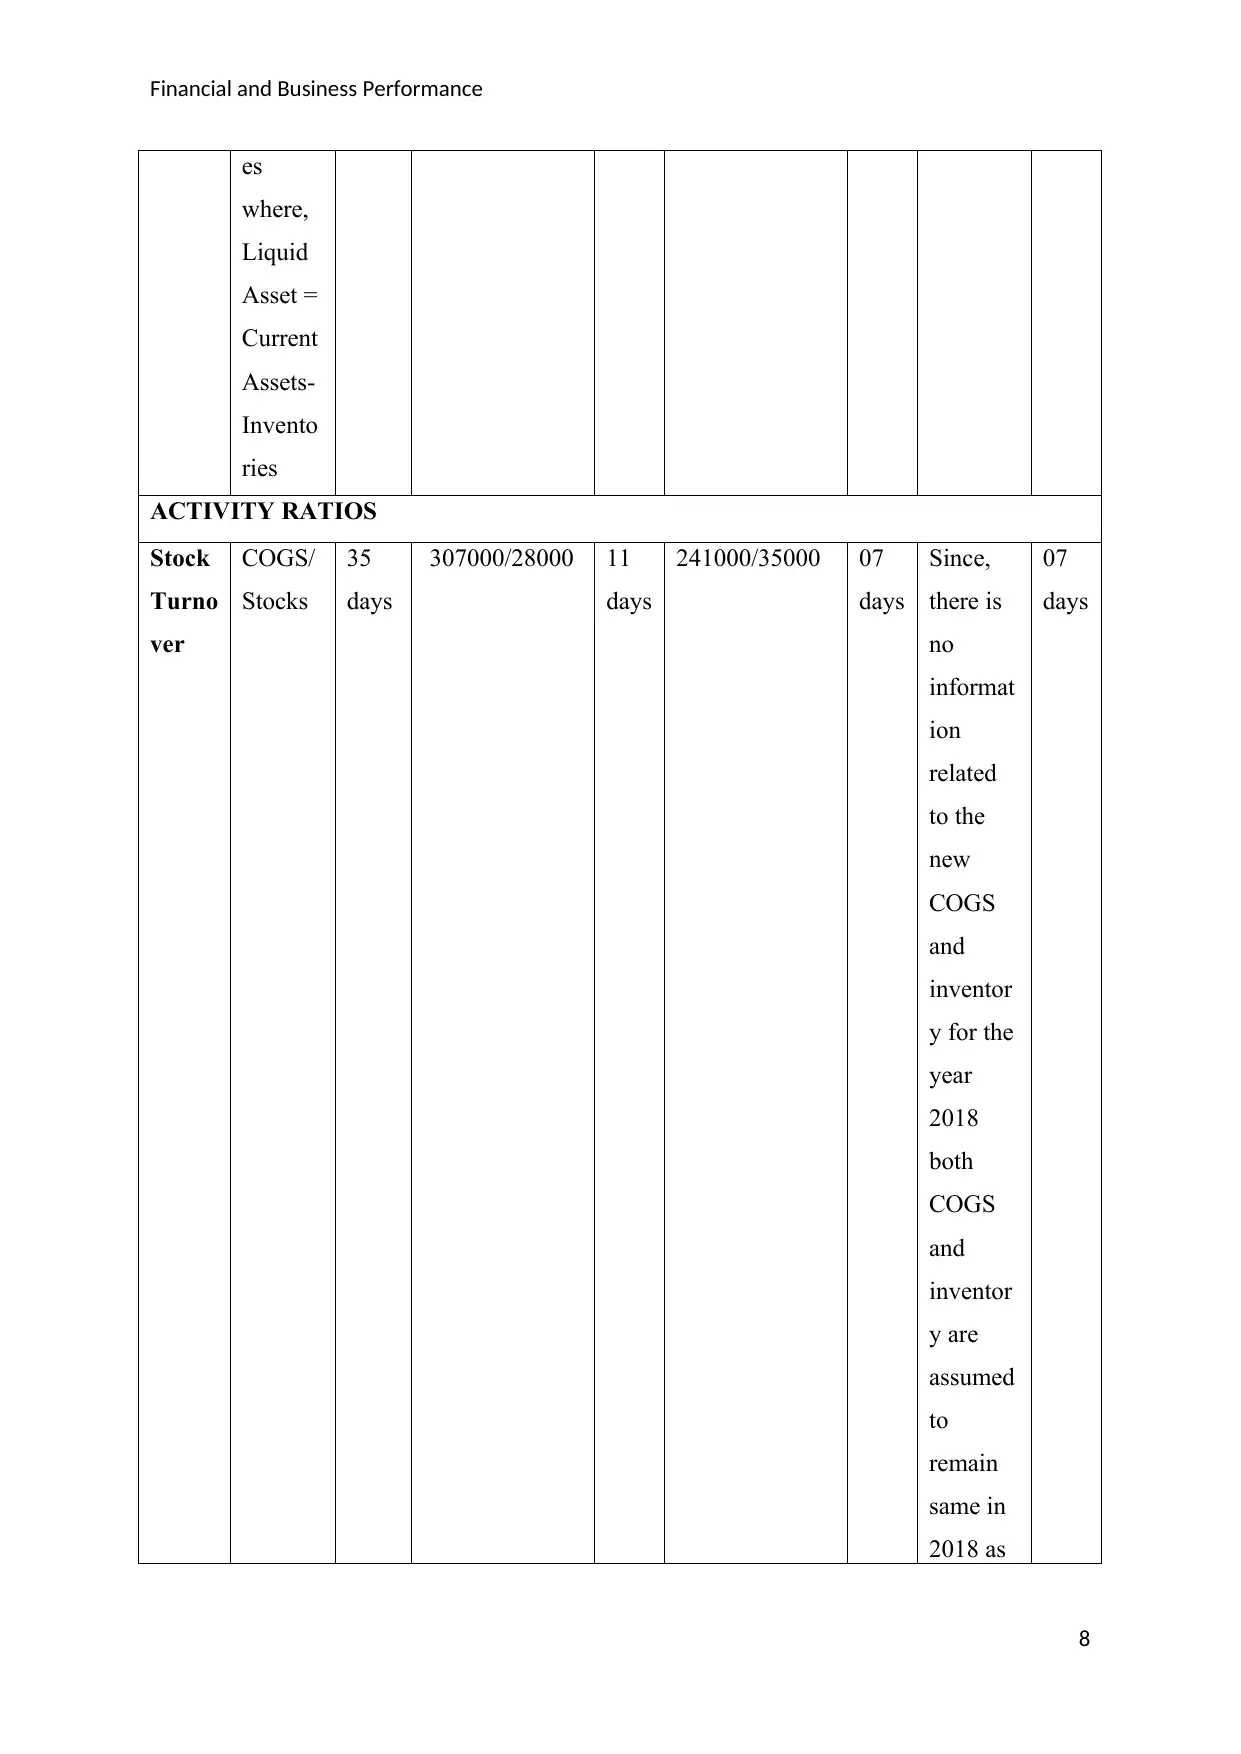
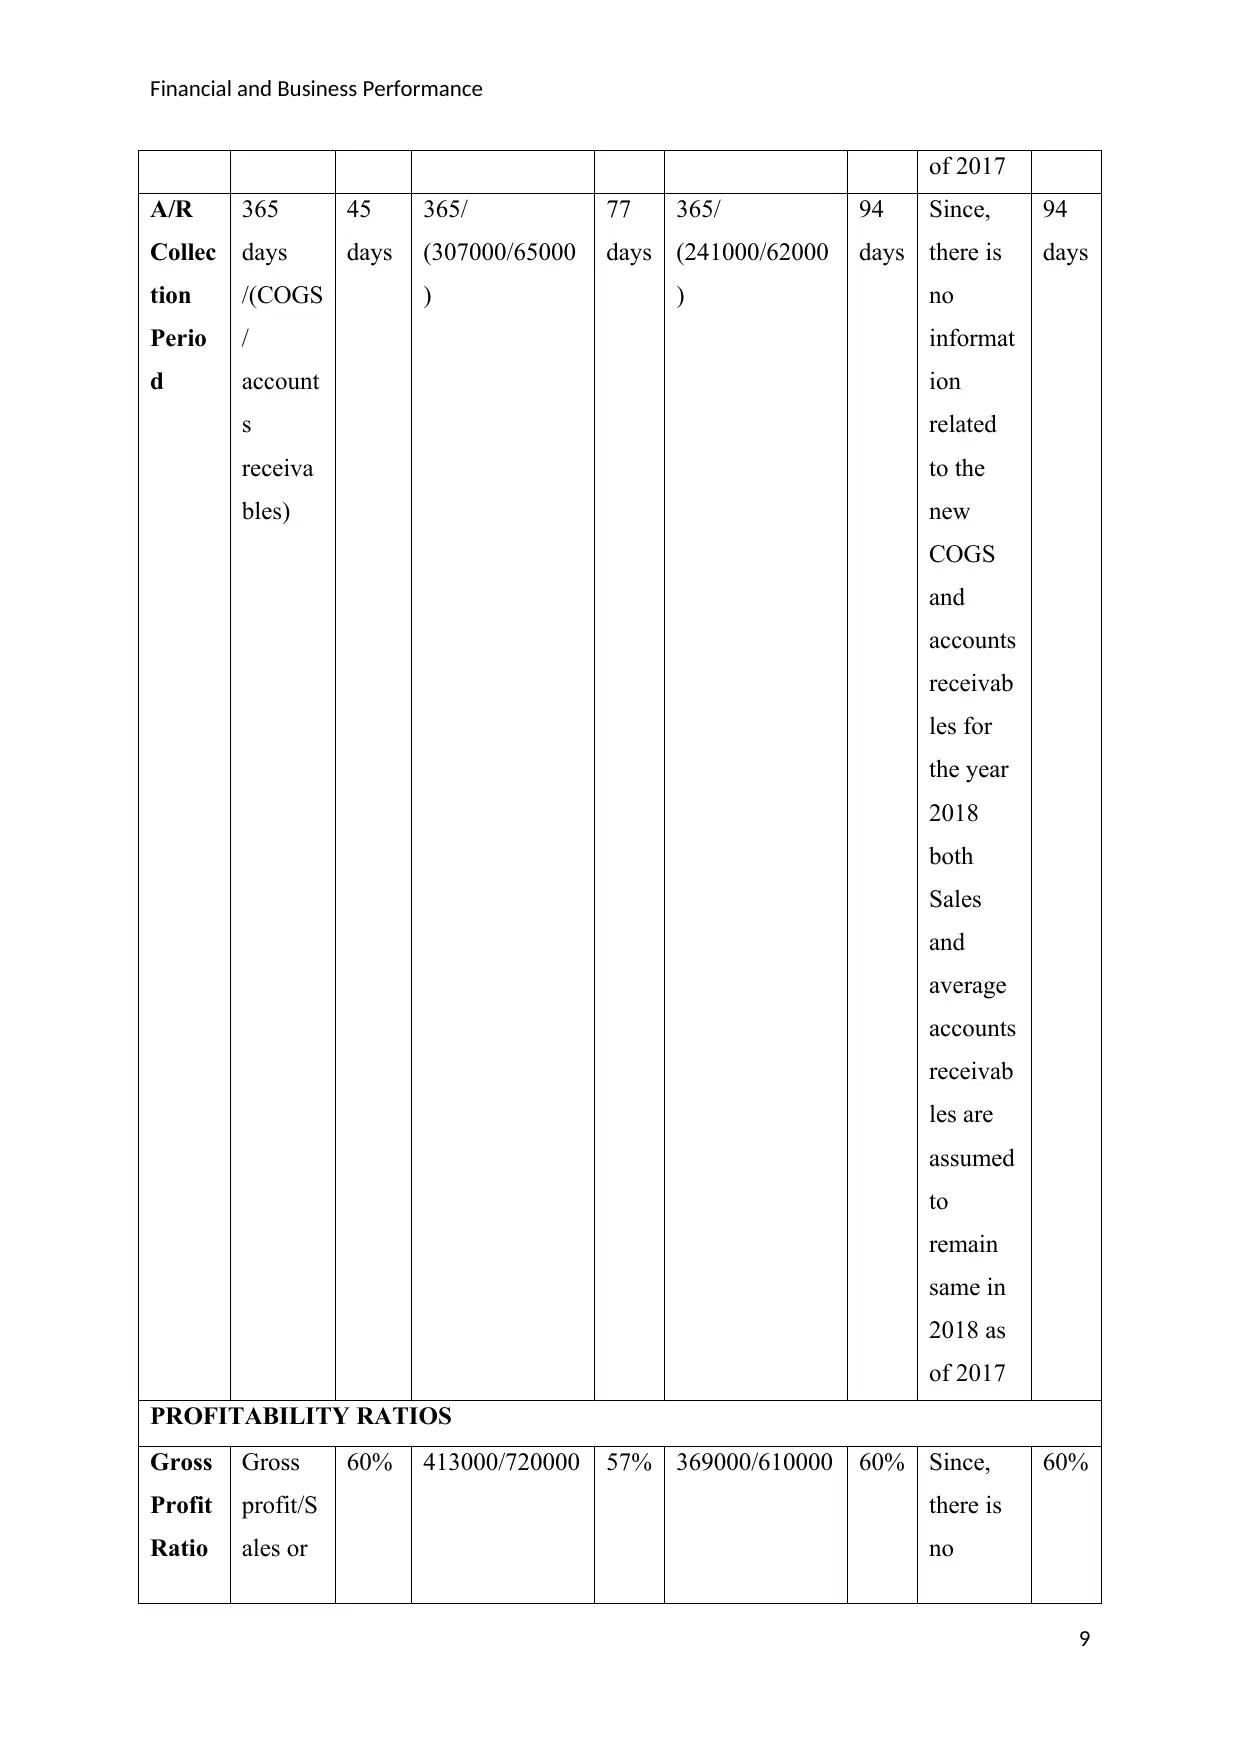
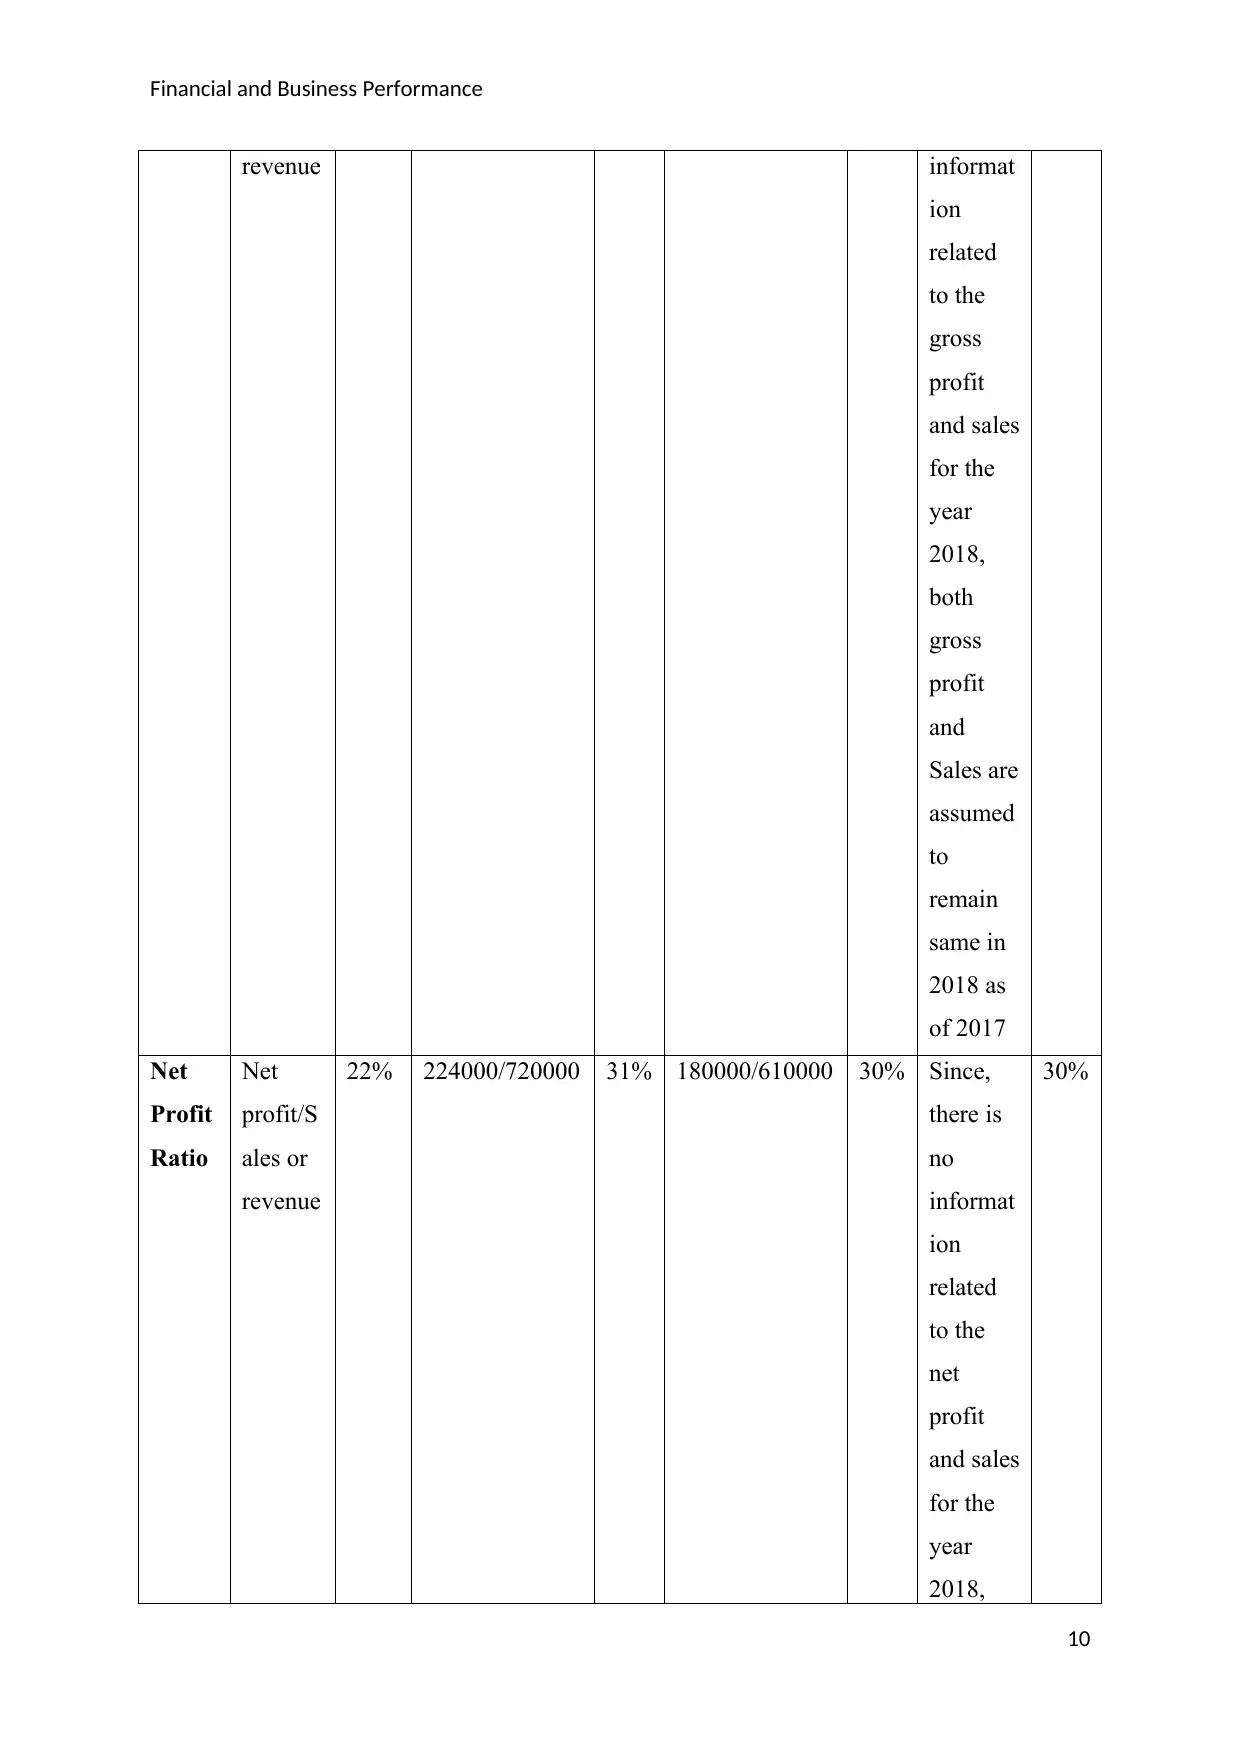
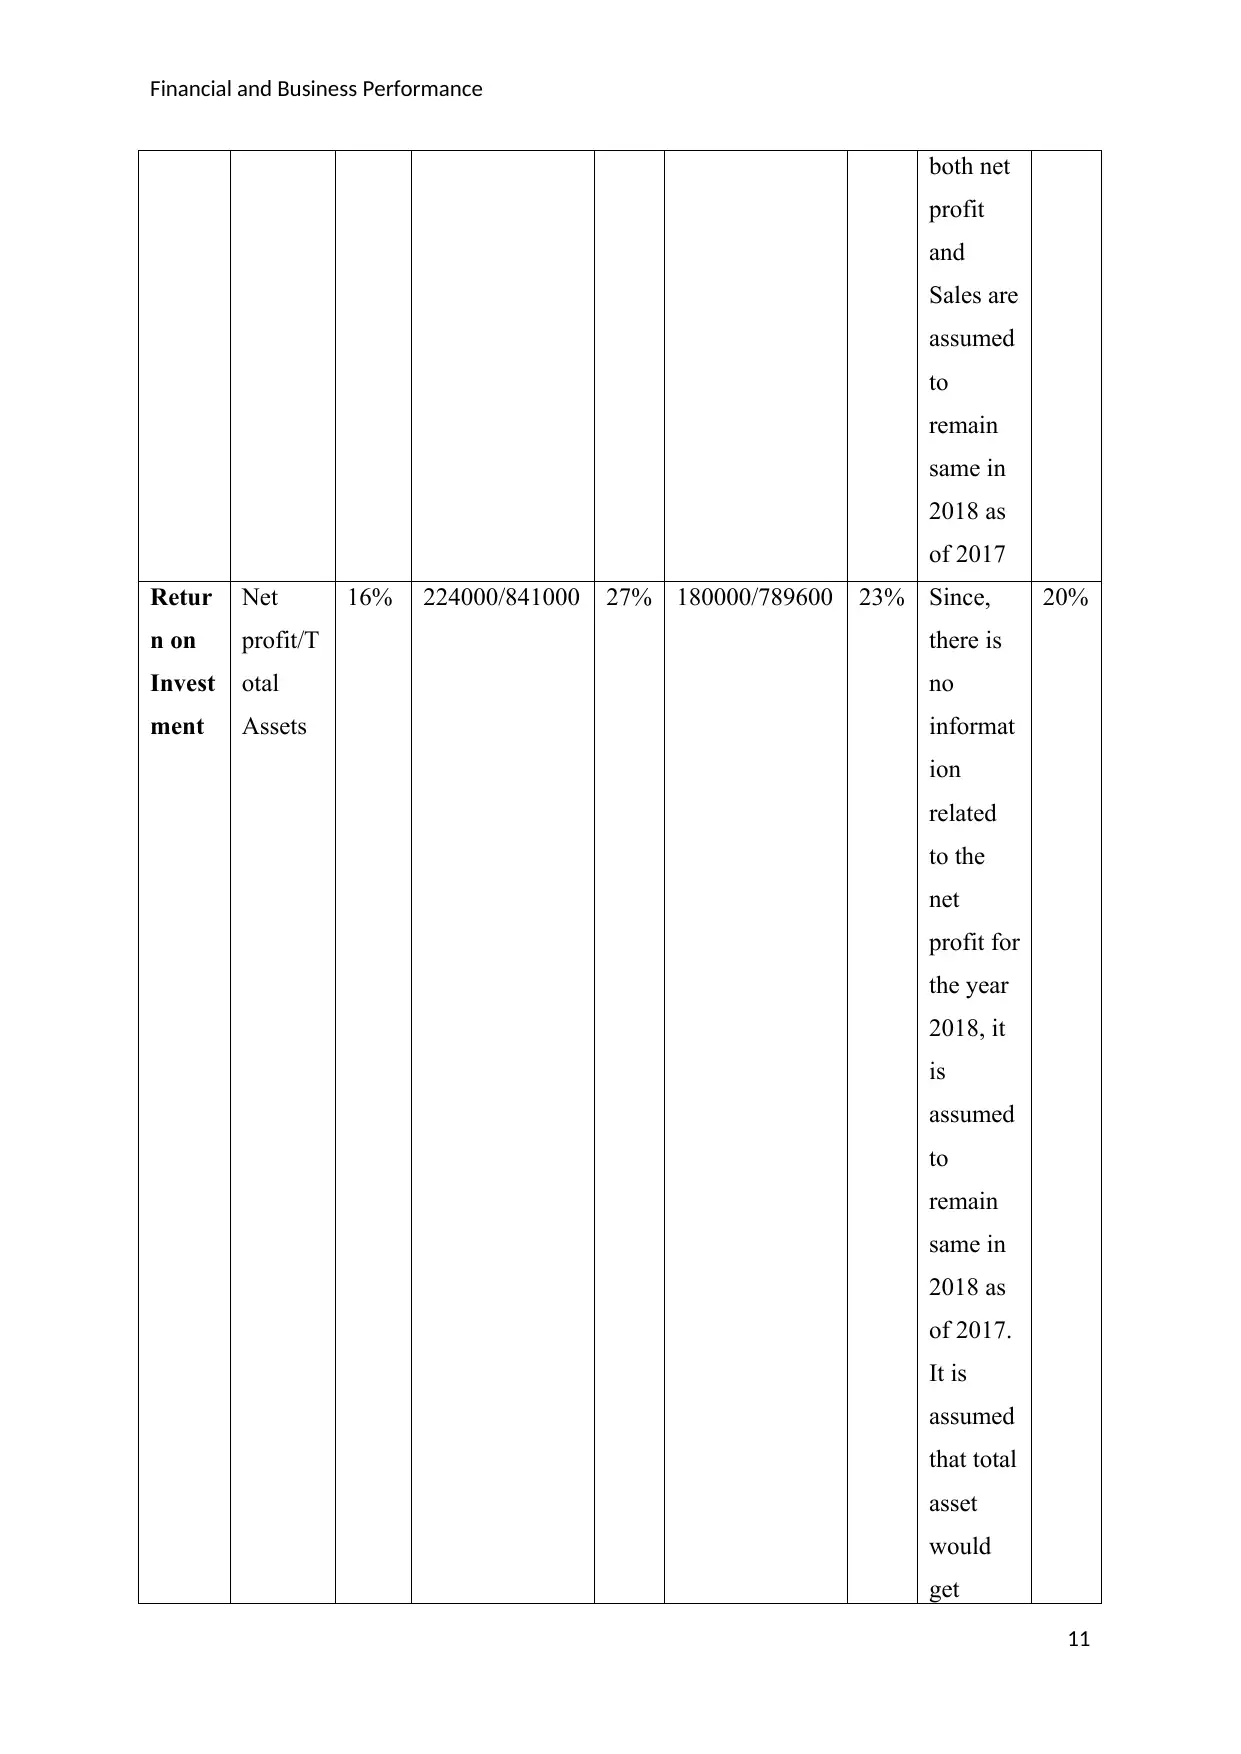
This assignment presents a comprehensive financial and business performance analysis of Lynch Quality Goods. It begins with an introduction to the company and its financial situation, including a discussion of a recent investment decision. The core of the analysis involves the calculation and interpretation of various financial ratios for the years 2016, 2017, and 2018. These ratios include liquidity ratios (current and liquid ratios), activity ratios (stock turnover and accounts receivable collection period), profitability ratios (gross profit, net profit, return on investment, and return on equity), and leverage ratios (debt to equity and debt to total assets). The analysis compares the company's performance over the three-year period, assesses the impact of the investment on these ratios, and provides recommendations. The document also includes financial statements and supporting calculations.

Running Head: Provide financial
and
business performance information
Financial
and
Business Performance
Information
and
business performance information
Financial
and
Business Performance
Information
Paraphrase This Document
Need a fresh take? Get an instant paraphrase of this document with our AI Paraphraser

Financial and Business Performance
Contents
PART -A...............................................................................................................................................2
1. Introduction...................................................................................................................................2
2. Financial Statements of Lynch Quality Goods...............................................................................2
A. INCOME STATEMENTS.........................................................................................................2
B. BALANCE SHEETS.................................................................................................................4
3. Calculation of Ratios: Lynch Quality Goods.................................................................................7
3.1 Liquidity Ratios.........................................................................................................................13
3.2 Activity Ratios...........................................................................................................................14
3.3 Profitability Ratios...............................................................................................................15
3.4 Leverage Ratios.........................................................................................................................16
4. Other Recommendations.............................................................................................................16
5. Conclusion...................................................................................................................................17
Appendix.............................................................................................................................................17
PART –A (Question 3)........................................................................................................................17
Requirements of Lynch Quality Goods...........................................................................................18
Questions Related to the Information Provided...............................................................................18
PART –B.............................................................................................................................................19
Answer 1.............................................................................................................................................19
Answer2..............................................................................................................................................21
Answer3..............................................................................................................................................22
Answer4..............................................................................................................................................23
References...........................................................................................................................................25
1

Financial and Business Performance
PART -A
1. Introduction
The Lynch Quality goods started its business three years back and the business was
successful. In 2017/18, it witnessed a drop in its sales figure but the equity of the company
had improved. Now, the company is planning to buy long term interest in another company
using long term loan of $100,000 and wanted to know the impact of this investment on the
ratios. With the given information, we would calculate the ratios of 2017 and 2018 and also
analyse the results to know whether the impact of the investment on the ratios would be
positive or negative.
2. Financial Statements of Lynch Quality Goods
A. INCOME STATEMENTS
Income Statement
(2016/17) $ $ $
Revenue 7,20,000
Less COGS
Opening Stock 25,000
Purchases 3,10,000
Less Closing Stock 28,000 3,07,000
Gross Profit 413000
Less Operating
Expenses
Selling Expenses
Sales salaries 92,000
Sales commissions 16,500
Advertising 3,000 1,11,500
Admin Expenses
Cleaning 14,300
Depreciation vehicle 8,000
Depreciation 28,000
2
⊘ This is a preview!⊘
Do you want full access?
Subscribe today to unlock all pages.

Trusted by 1+ million students worldwide

Financial and Business Performance
equipment
General admin
expenses 6,800 57,100
Financial Expenses
Bank fees 400
Interest 20,000 20,400 1,89,000
Net Profit 2,24,000
Tax Payable 67,200
Net Profit After Tax 1,56,800
2017/2018 Income Statement
$ $ $
Revenue 6,10,000
Less COGS
Opening Stock 28,000
Purchases 2,48,00
0
Less Closing Stock 35,000 2,41,000
Gross Profit 3,69,000
Less Operating
Expenses
Selling Expenses
Sales salaries 95,000
Sales commissions 12,000
Advertising 4,800 1,11,80
0
Admin Expenses
Cleaning 15,200
Depreciation vehicle 8,000
Depreciation equipment 28,000
General admin expenses 7,500 58,700
Financial Expenses
Bank fees 500
3
Paraphrase This Document
Need a fresh take? Get an instant paraphrase of this document with our AI Paraphraser

Financial and Business Performance
Interest 18,000 18,500 1,89,000
Net Profit 1,80,000
Tax Payable 54,000
Net Profit After Tax 1,26,000
B. BALANCE SHEETS
2016/17 Balance Sheet
Current Assets $ $ $
Cash
1,32,00
0
Accounts Receivable 65,000
Inventory 28,000
2,25,00
0
Non-Current Assets
Building
4,00,00
0
Equipment
2,80,00
0
Accumulated
Depreciation
1,12,00
0
1,68,00
0
Vehicle 64,000
Accumulated
Depreciation 16,000 48,000
6,16,00
0
Total Assets
8,41,00
0
Current Liabilities
Accounts Payable 32,000
GST Payable 9,600
Tax Payable 67,200
1,08,80
0
Non-Current
Liabilities
Mortgage
2,00,00
0
Loan 50,000
2,50,00
0
Total Liabilities
3,58,80
0
Net Assets
4,82,20
0
Capital
Opening Capital
4,45,40
0
Net Profit After Tax
1,56,80
0
Less Drawings 1,20,00 4,82,20
4

Financial and Business Performance
0 0
2017/2018 Balance Sheet
Current Assets $ $ $
Cash
1,12,60
0
Accounts Receivable 62,000
Inventory 35,000
2,09,60
0
Non-Current Assets
Building
4,00,00
0
Equipment
2,80,00
0
Accumulated
Depreciation
1,40,00
0
1,40,00
0
Vehicle 64,000
Accumulated
Depreciation 24,000 40,000
5,80,00
0
Total Assets
7,89,60
0
Current Liabilities
Accounts Payable 24,000
GST Payable 8,400
Tax Payable 54,000 86,400
Non-Current
Liabilities
Mortgage
1,80,00
0
Loan 45,000
2,25,00
0
Total Liabilities
3,11,40
0
Net Assets
4,78,20
0
Capital
Opening Capital
4,82,20
0
Net Profit After Tax
1,26,00
0
Less Drawings 1,30,00 4,78,20
5
⊘ This is a preview!⊘
Do you want full access?
Subscribe today to unlock all pages.

Trusted by 1+ million students worldwide

Financial and Business Performance
0 0
2018/2019 Balance Sheet
Current Assets $ $ $
Cash
1,12,60
0
Accounts Receivable 62,000
Inventory 35,000
2,09,60
0
Non-Current Assets
Building
4,00,00
0
Equipment
2,80,00
0
Accumulated
Depreciation
1,40,00
0
1,40,00
0
Vehicle 64,000
Accumulated
Depreciation 24,000 40,000
Long Term Investment
1,00,00
0
6,80,00
0
Total Assets
8,89,60
0
Current Liabilities
Accounts Payable 24,000
GST Payable 8,400
Tax Payable 54,000 86,400
Non-Current
Liabilities
Mortgage
1,80,00
0
6
Paraphrase This Document
Need a fresh take? Get an instant paraphrase of this document with our AI Paraphraser

Financial and Business Performance
Loan (Previous debt+
new debt taken for
purchasing long term
interest in other
company)
1,45,00
0
3,25,00
0
Total Liabilities
4,11,40
0
Net Assets
4,78,20
0
Note for the Financial Statements of 2018/19: All the components of assets and liabilities are
assumed to remain same as in the financial year 2017-18. Only those changes are introduced
which have occurred because of purchase of long term interest in another company. Also, it
has been assumed that the company will not pay any interest on the new loan taken for
purchase of long term interest and all the other figures of income statement would be same in
the year 2018/19.
3. Calculation of Ratios: Lynch Quality Goods
Ratios Formul
a
Indu
stry
Aver
age
Calculation 201
6/17
Calculation 201
7/18
Calculat
ion
201
8/19
LIQUIDITY RATIOS
Curre
nt
Ratio
Current
assets/C
urrent
Liabiliti
es
02:0
1
225000/108800 2.07 209600/86400 2.43 209600/
86400
2.43
Liqui
d
Ratio
Liquid
assets/C
urrent
liabiliti
1.6:1 (225000-
28000)/108800
1.81 (209600-
35000)/86400
2.02 (209600
-
35000)/
86400
2.02
7

Financial and Business Performance
es
where,
Liquid
Asset =
Current
Assets-
Invento
ries
ACTIVITY RATIOS
Stock
Turno
ver
COGS/
Stocks
35
days
307000/28000 11
days
241000/35000 07
days
Since,
there is
no
informat
ion
related
to the
new
COGS
and
inventor
y for the
year
2018
both
COGS
and
inventor
y are
assumed
to
remain
same in
2018 as
07
days
8
⊘ This is a preview!⊘
Do you want full access?
Subscribe today to unlock all pages.

Trusted by 1+ million students worldwide

Financial and Business Performance
of 2017
A/R
Collec
tion
Perio
d
365
days
/(COGS
/
account
s
receiva
bles)
45
days
365/
(307000/65000
)
77
days
365/
(241000/62000
)
94
days
Since,
there is
no
informat
ion
related
to the
new
COGS
and
accounts
receivab
les for
the year
2018
both
Sales
and
average
accounts
receivab
les are
assumed
to
remain
same in
2018 as
of 2017
94
days
PROFITABILITY RATIOS
Gross
Profit
Ratio
Gross
profit/S
ales or
60% 413000/720000 57% 369000/610000 60% Since,
there is
no
60%
9
of 2017
A/R
Collec
tion
Perio
d
365
days
/(COGS
/
account
s
receiva
bles)
45
days
365/
(307000/65000
)
77
days
365/
(241000/62000
)
94
days
Since,
there is
no
informat
ion
related
to the
new
COGS
and
accounts
receivab
les for
the year
2018
both
Sales
and
average
accounts
receivab
les are
assumed
to
remain
same in
2018 as
of 2017
94
days
PROFITABILITY RATIOS
Gross
Profit
Ratio
Gross
profit/S
ales or
60% 413000/720000 57% 369000/610000 60% Since,
there is
no
60%
9
Paraphrase This Document
Need a fresh take? Get an instant paraphrase of this document with our AI Paraphraser

Financial and Business Performance
revenue informat
ion
related
to the
gross
profit
and sales
for the
year
2018,
both
gross
profit
and
Sales are
assumed
to
remain
same in
2018 as
of 2017
Net
Profit
Ratio
Net
profit/S
ales or
revenue
22% 224000/720000 31% 180000/610000 30% Since,
there is
no
informat
ion
related
to the
net
profit
and sales
for the
year
2018,
30%
10

Financial and Business Performance
both net
profit
and
Sales are
assumed
to
remain
same in
2018 as
of 2017
Retur
n on
Invest
ment
Net
profit/T
otal
Assets
16% 224000/841000 27% 180000/789600 23% Since,
there is
no
informat
ion
related
to the
net
profit for
the year
2018, it
is
assumed
to
remain
same in
2018 as
of 2017.
It is
assumed
that total
asset
would
get
20%
11
⊘ This is a preview!⊘
Do you want full access?
Subscribe today to unlock all pages.

Trusted by 1+ million students worldwide
1 out of 28
Related Documents

Your All-in-One AI-Powered Toolkit for Academic Success.
 +13062052269
info@desklib.com
Available 24*7 on WhatsApp / Email
Unlock your academic potential
Copyright © 2020–2025 A2Z Services. All Rights Reserved. Developed and managed by ZUCOL.