Financial Analysis Report of Transfer Beach Ltd: Performance Review
VerifiedAdded on 2022/09/28
|9
|1434
|25
Report
AI Summary
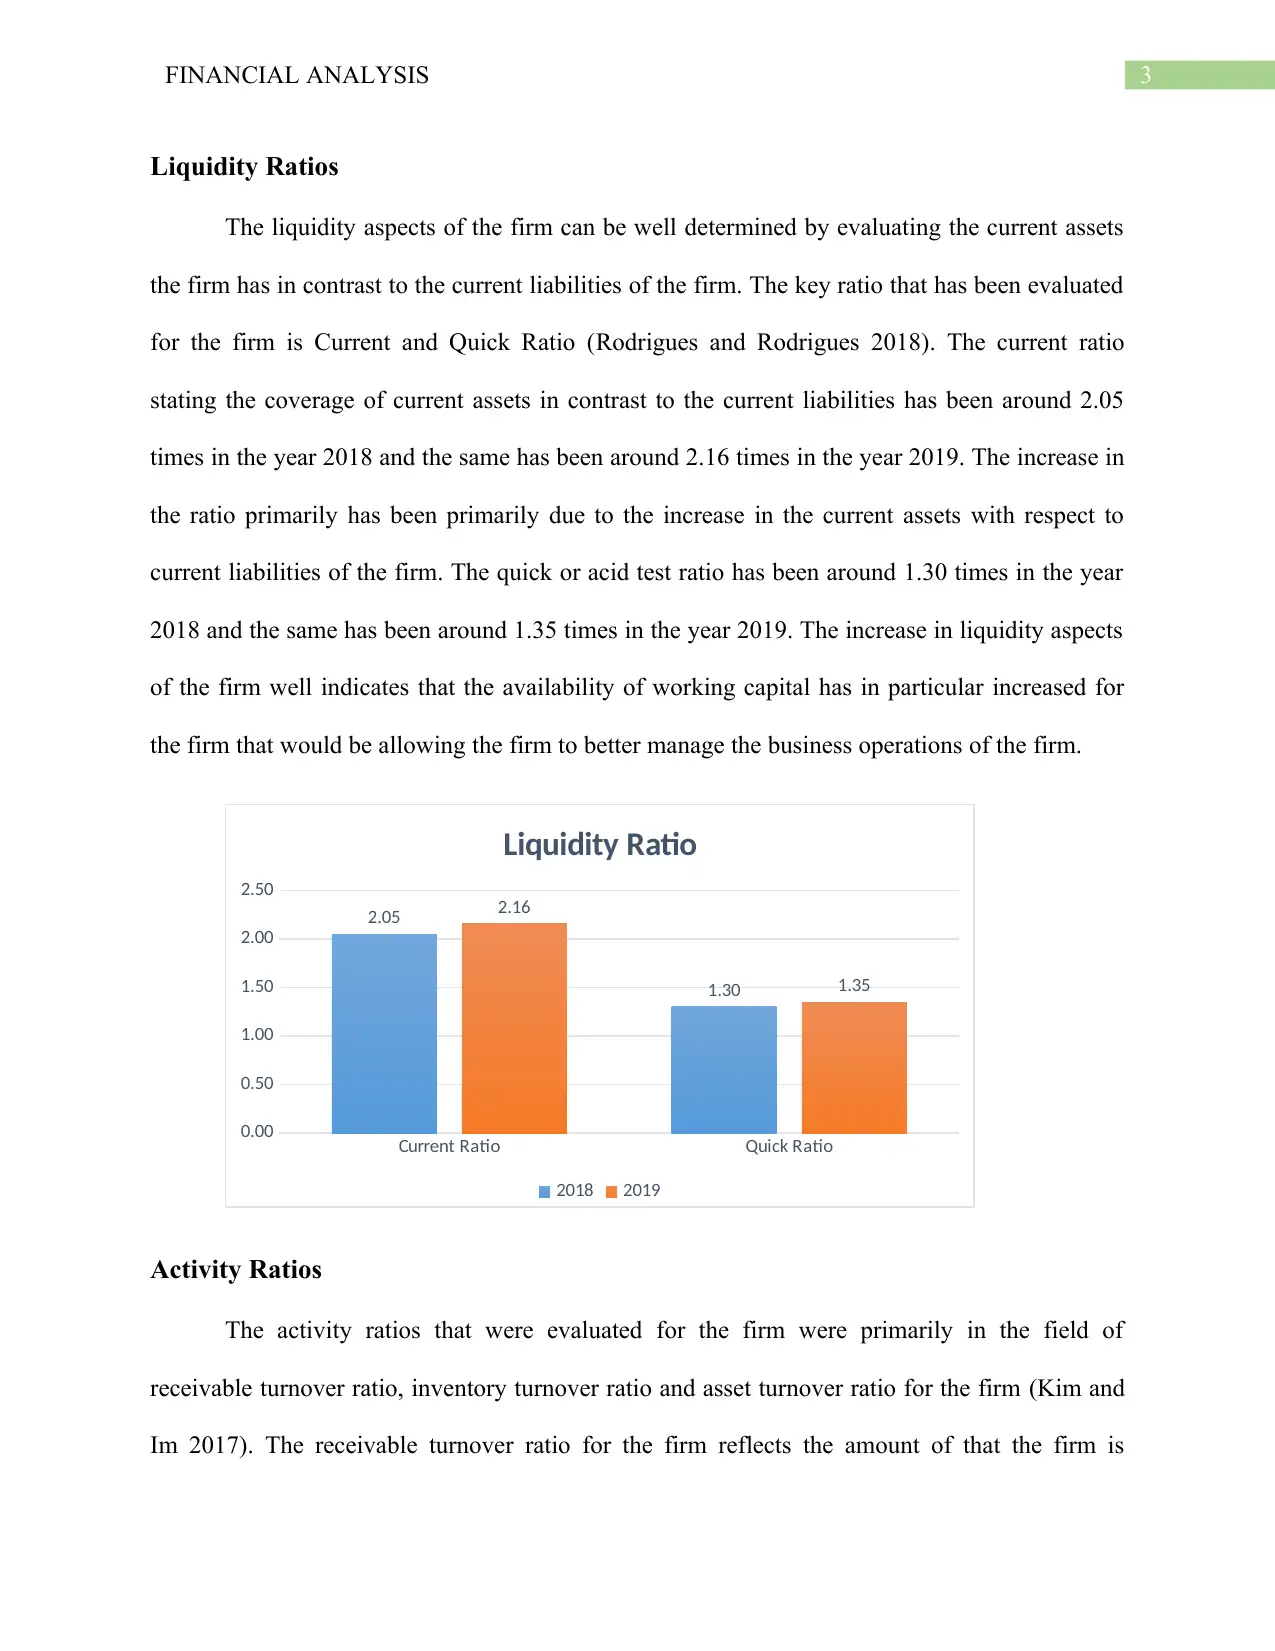
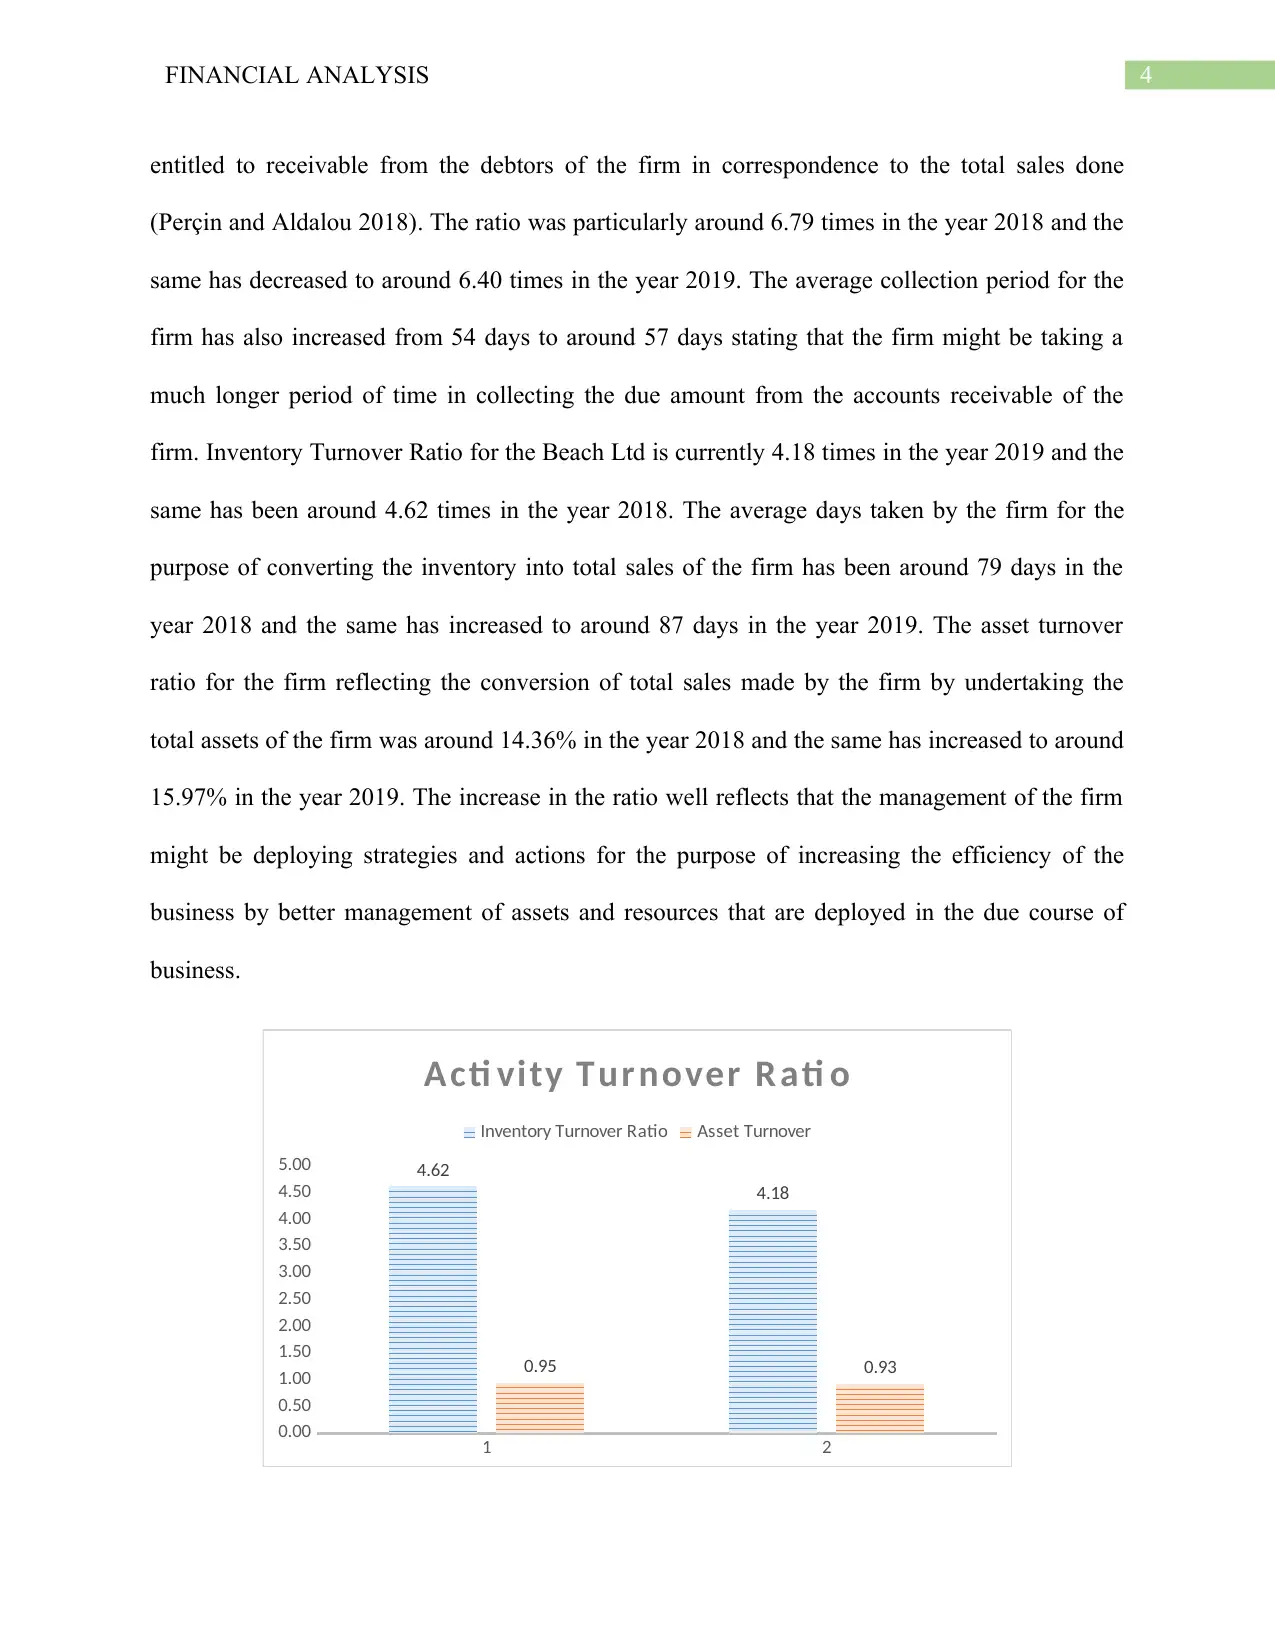
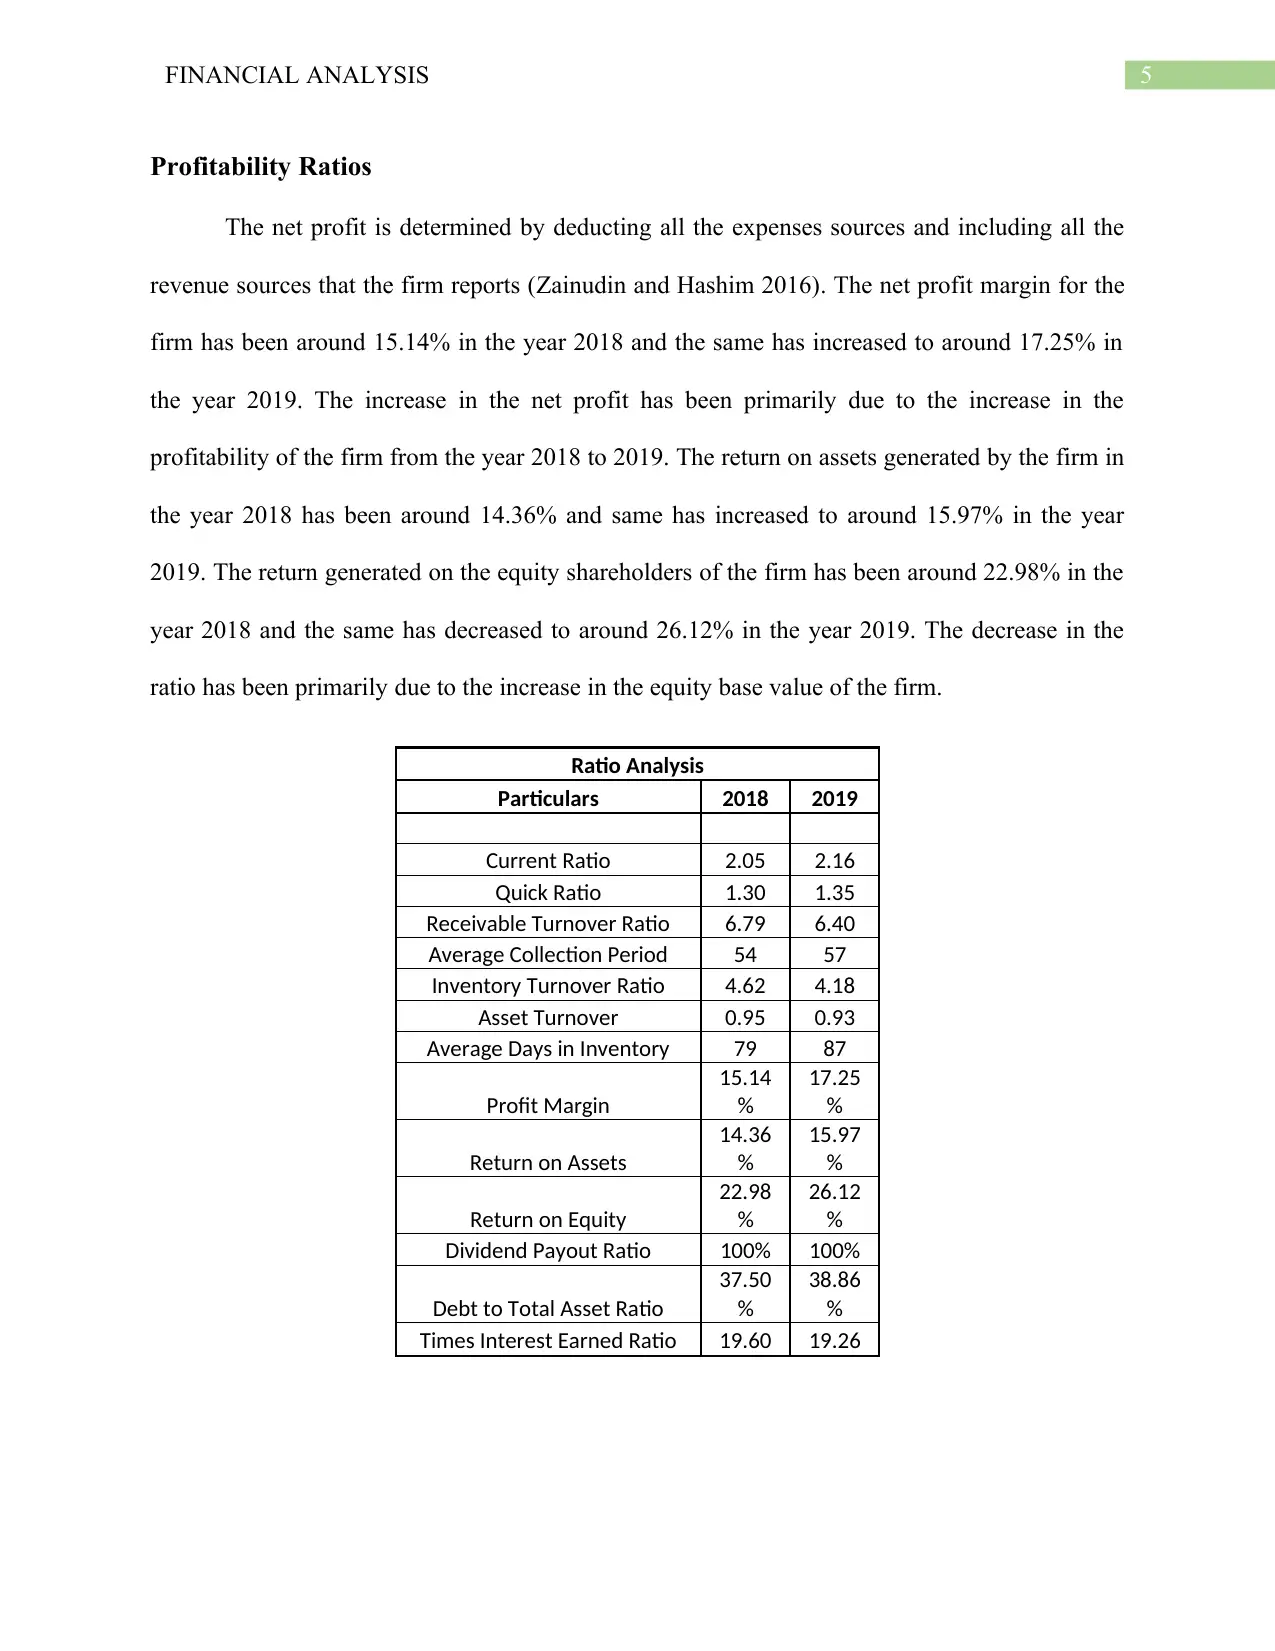
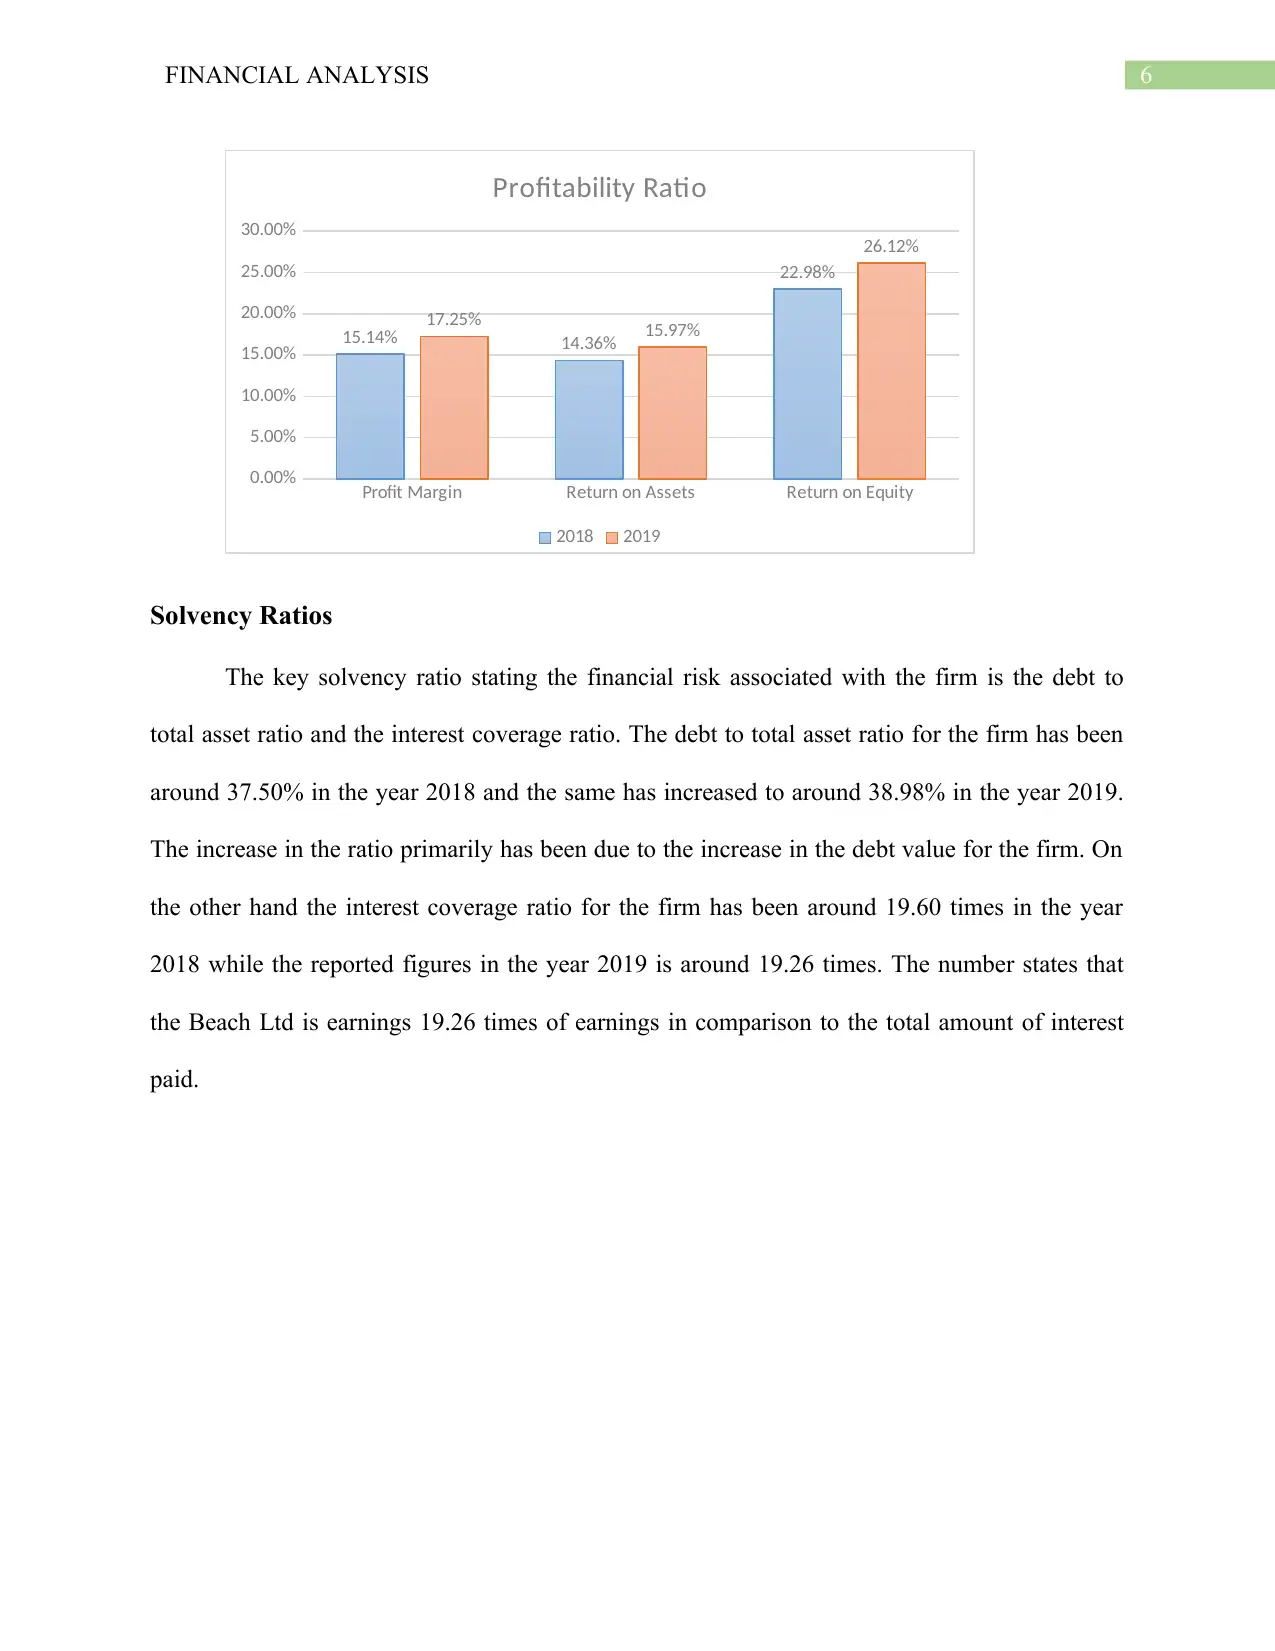
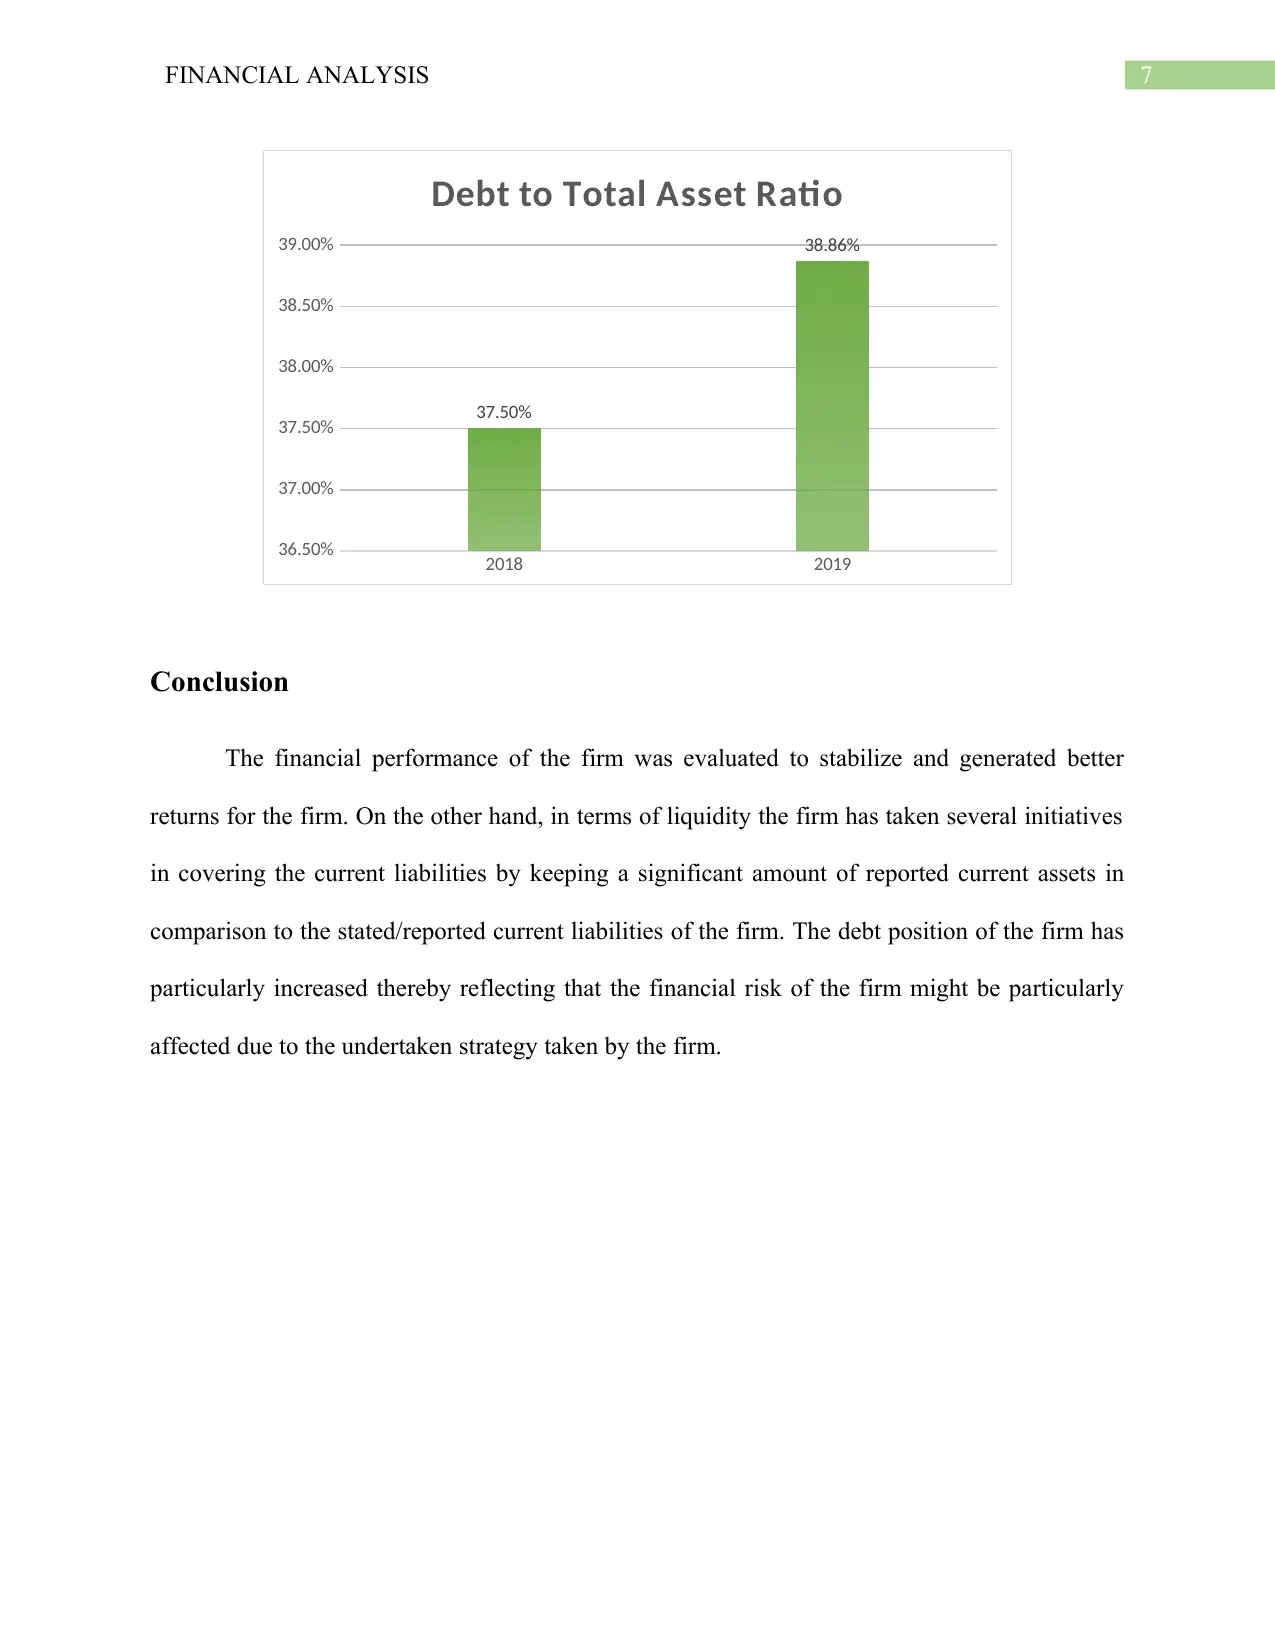
This report provides a comprehensive financial analysis of Transfer Beach Ltd, evaluating its performance over the years 2018 and 2019. The analysis includes the calculation of retained earnings and an assessment of liquidity, activity, profitability, and solvency ratios. Liquidity is examined through current and quick ratios, while activity is assessed using receivable turnover, inventory turnover, and asset turnover ratios. Profitability is evaluated using net profit margin, return on assets, and return on equity. Solvency is analyzed through debt to total asset and interest coverage ratios. The report also includes a table summarizing the key ratios and their values for both years, along with a conclusion that highlights the financial health and risk associated with the company. The analysis is supported by relevant references.

Running head: FINANCIAL ANALYSIS
Financial Analysis
Name of the Student:
Name of the University:
Author’s Note:
Financial Analysis
Name of the Student:
Name of the University:
Author’s Note:
Paraphrase This Document
Need a fresh take? Get an instant paraphrase of this document with our AI Paraphraser

1FINANCIAL ANALYSIS
Table of Contents
Introduction......................................................................................................................................2
Discussion and Analysis..................................................................................................................2
Liquidity Ratios...........................................................................................................................2
Activity Ratios.............................................................................................................................3
Profitability Ratios.......................................................................................................................3
Solvency Ratios...........................................................................................................................4
Conclusion.......................................................................................................................................5
References........................................................................................................................................6

2FINANCIAL ANALYSIS
Introduction
The financial analysis for the Transfer Beach Ltd has been primarily done by with the
help of assessment of the financial performance of the firm. Taking various aspects of the firm
including profitability, activity, liquidity, solvency and efficiency ratios are some of the key
aspects that marks the financial performance of the firm. The trend period over which the
financial statements of the firm has been analyzed is for a sum of two years is 2018 and 2019
(Uechi et al., 2015).
Discussion and Analysis
Retained Earnings Calculation
The dividend payment will be calculated by taking the beginning retained earnings, add
net income earned during the year less the reported ending retained earnings value as shown
below:
Retained Earnings Calculation
Beginning Retained Earnings
24500
0
Net Income
12145
0
Dividend Payments
10145
0
Ending Retained Earnings
26500
0
⊘ This is a preview!⊘
Do you want full access?
Subscribe today to unlock all pages.

Trusted by 1+ million students worldwide

3FINANCIAL ANALYSIS
Liquidity Ratios
The liquidity aspects of the firm can be well determined by evaluating the current assets
the firm has in contrast to the current liabilities of the firm. The key ratio that has been evaluated
for the firm is Current and Quick Ratio (Rodrigues and Rodrigues 2018). The current ratio
stating the coverage of current assets in contrast to the current liabilities has been around 2.05
times in the year 2018 and the same has been around 2.16 times in the year 2019. The increase in
the ratio primarily has been primarily due to the increase in the current assets with respect to
current liabilities of the firm. The quick or acid test ratio has been around 1.30 times in the year
2018 and the same has been around 1.35 times in the year 2019. The increase in liquidity aspects
of the firm well indicates that the availability of working capital has in particular increased for
the firm that would be allowing the firm to better manage the business operations of the firm.
Current Ratio Quick Ratio
0.00
0.50
1.00
1.50
2.00
2.50
2.05
1.30
2.16
1.35
Liquidity Ratio
2018 2019
Activity Ratios
The activity ratios that were evaluated for the firm were primarily in the field of
receivable turnover ratio, inventory turnover ratio and asset turnover ratio for the firm (Kim and
Im 2017). The receivable turnover ratio for the firm reflects the amount of that the firm is
Paraphrase This Document
Need a fresh take? Get an instant paraphrase of this document with our AI Paraphraser

4FINANCIAL ANALYSIS
entitled to receivable from the debtors of the firm in correspondence to the total sales done
(Perçin and Aldalou 2018). The ratio was particularly around 6.79 times in the year 2018 and the
same has decreased to around 6.40 times in the year 2019. The average collection period for the
firm has also increased from 54 days to around 57 days stating that the firm might be taking a
much longer period of time in collecting the due amount from the accounts receivable of the
firm. Inventory Turnover Ratio for the Beach Ltd is currently 4.18 times in the year 2019 and the
same has been around 4.62 times in the year 2018. The average days taken by the firm for the
purpose of converting the inventory into total sales of the firm has been around 79 days in the
year 2018 and the same has increased to around 87 days in the year 2019. The asset turnover
ratio for the firm reflecting the conversion of total sales made by the firm by undertaking the
total assets of the firm was around 14.36% in the year 2018 and the same has increased to around
15.97% in the year 2019. The increase in the ratio well reflects that the management of the firm
might be deploying strategies and actions for the purpose of increasing the efficiency of the
business by better management of assets and resources that are deployed in the due course of
business.
1 2
0.00
0.50
1.00
1.50
2.00
2.50
3.00
3.50
4.00
4.50
5.00 4.62
4.18
0.95 0.93
Acti vity Tur nover R ati o
Inventory Turnover Ratio Asset Turnover

5FINANCIAL ANALYSIS
Profitability Ratios
The net profit is determined by deducting all the expenses sources and including all the
revenue sources that the firm reports (Zainudin and Hashim 2016). The net profit margin for the
firm has been around 15.14% in the year 2018 and the same has increased to around 17.25% in
the year 2019. The increase in the net profit has been primarily due to the increase in the
profitability of the firm from the year 2018 to 2019. The return on assets generated by the firm in
the year 2018 has been around 14.36% and same has increased to around 15.97% in the year
2019. The return generated on the equity shareholders of the firm has been around 22.98% in the
year 2018 and the same has decreased to around 26.12% in the year 2019. The decrease in the
ratio has been primarily due to the increase in the equity base value of the firm.
Ratio Analysis
Particulars 2018 2019
Current Ratio 2.05 2.16
Quick Ratio 1.30 1.35
Receivable Turnover Ratio 6.79 6.40
Average Collection Period 54 57
Inventory Turnover Ratio 4.62 4.18
Asset Turnover 0.95 0.93
Average Days in Inventory 79 87
Profit Margin
15.14
%
17.25
%
Return on Assets
14.36
%
15.97
%
Return on Equity
22.98
%
26.12
%
Dividend Payout Ratio 100% 100%
Debt to Total Asset Ratio
37.50
%
38.86
%
Times Interest Earned Ratio 19.60 19.26
⊘ This is a preview!⊘
Do you want full access?
Subscribe today to unlock all pages.

Trusted by 1+ million students worldwide

6FINANCIAL ANALYSIS
Profit Margin Return on Assets Return on Equity
0.00%
5.00%
10.00%
15.00%
20.00%
25.00%
30.00%
15.14% 14.36%
22.98%
17.25% 15.97%
26.12%
Profitability Ratio
2018 2019
Solvency Ratios
The key solvency ratio stating the financial risk associated with the firm is the debt to
total asset ratio and the interest coverage ratio. The debt to total asset ratio for the firm has been
around 37.50% in the year 2018 and the same has increased to around 38.98% in the year 2019.
The increase in the ratio primarily has been due to the increase in the debt value for the firm. On
the other hand the interest coverage ratio for the firm has been around 19.60 times in the year
2018 while the reported figures in the year 2019 is around 19.26 times. The number states that
the Beach Ltd is earnings 19.26 times of earnings in comparison to the total amount of interest
paid.
Paraphrase This Document
Need a fresh take? Get an instant paraphrase of this document with our AI Paraphraser

7FINANCIAL ANALYSIS
2018 2019
36.50%
37.00%
37.50%
38.00%
38.50%
39.00%
37.50%
38.86%
Debt to Total Asset Ratio
Conclusion
The financial performance of the firm was evaluated to stabilize and generated better
returns for the firm. On the other hand, in terms of liquidity the firm has taken several initiatives
in covering the current liabilities by keeping a significant amount of reported current assets in
comparison to the stated/reported current liabilities of the firm. The debt position of the firm has
particularly increased thereby reflecting that the financial risk of the firm might be particularly
affected due to the undertaken strategy taken by the firm.

8FINANCIAL ANALYSIS
References
Kim, J. and Im, C., 2017. Study on corporate social responsibility (CSR): focus on tax avoidance
and financial ratio analysis. Sustainability, 9(10), p.1710.
Nwanji, T.I., Olowookere, J.K., Egbide, B.C., Fakile, S.A., Lawal, A.I., Ajayi, S.A., Falaye, A.J.
and Eluyela, D.F., 2018. Financial Ratio Analysis and Market Price of Share of Selected Quoted
Agriculture and Agro-allied Firms in Nigeria After Adoption of International Financial
Reporting Standard. The Journal of Social Sciences Research, 4(12), pp.736-744.
Perçin, S. and Aldalou, E., 2018. Financial Performance Evaluation of Turkish Airline
Companies Using Integrated Fuzzy AHP Fuzzy TOPSIS Model. Uluslararası İktisadi ve İdari
İncelemeler Dergisi,(18. EYİ Özel Sayısı), pp.583-598.
Rodrigues, L. and Rodrigues, L., 2018. Economic-financial performance of the Brazilian
sugarcane energy industry: An empirical evaluation using financial ratio, cluster and
discriminant analysis. Biomass and bioenergy, 108, pp.289-296.
Uechi, L., Akutsu, T., Stanley, H.E., Marcus, A.J. and Kenett, D.Y., 2015. Sector dominance
ratio analysis of financial markets. Physica A: Statistical Mechanics and its Applications, 421,
pp.488-509.
Zainudin, E.F. and Hashim, H.A., 2016. Detecting fraudulent financial reporting using financial
ratio. Journal of Financial Reporting and Accounting, 14(2), pp.266-278.
⊘ This is a preview!⊘
Do you want full access?
Subscribe today to unlock all pages.

Trusted by 1+ million students worldwide
1 out of 9
Related Documents

Your All-in-One AI-Powered Toolkit for Academic Success.
+13062052269
info@desklib.com
Available 24*7 on WhatsApp / Email
Unlock your academic potential
Copyright © 2020–2025 A2Z Services. All Rights Reserved. Developed and managed by ZUCOL.