Comparative Financial Analysis Report: Vodafone vs. BT Group
VerifiedAdded on 2022/08/13
|23
|4095
|26
Report
AI Summary
This report provides a comparative financial analysis of Vodafone and BT Group, two major players in the telecommunications industry. The analysis covers the years 2018 and 2019, examining key financial ratios across liquidity, efficiency, gearing, and profitability. The report begins with an overview of each company, including their background, services, and market presence. Ratio analysis is then conducted, evaluating current, quick, and working capital turnover ratios to assess liquidity; account receivable turnover and asset turnover ratios to evaluate efficiency; debt ratios to assess gearing; and operating expenses ratio, operating profit margin, ROA, and ROE to assess profitability. The report highlights key differences in financial performance between the two companies, offering insights into their strengths and weaknesses. The analysis aims to provide a clear understanding of the financial health and performance of Vodafone and BT Group, offering valuable insights for investors and stakeholders. The report concludes with a summary of the findings, highlighting the relative performance of each company across the various financial metrics.
Running head: FINANCE
FINANCE
Name of the Student:
Name of the University:
Author Note:
FINANCE
Name of the Student:
Name of the University:
Author Note:
Paraphrase This Document
Need a fresh take? Get an instant paraphrase of this document with our AI Paraphraser
1FINANCE
Table of Contents
Overview of companies..............................................................................................................1
Ratio analysis.............................................................................................................................2
Sustainability reporting..............................................................................................................8
References................................................................................................................................10
2FINANCE
Overview of companies
William Fothergill Cooke and John Lewis Ricardo founded BT Group, formerly
known as British Telecom in 1969. It has headquarters in London, United Kingdom. BT
Group operates in telecommunication industry and is a multinational holding company
operating in around 180 countries. It offers products in various lines such as mobile
telephony, digital television, broadband service, home security, and many more IT related
services. It is a public limited company and has to list in London Stock Exchange and New
York Stock Exchange. Even it is a constituent of the FTSE 100 Index. BT Global Service is a
subsidiary of the BT Group and deals with telecom services related to government and
corporate customers worldwide. One of the significant subsidiaries is BT Consumer that
provides telephony broadband and subscription television services (Btplc.com, 2020). It has a
tagline” Go beyond Limits”. The company provides service to consumers, small and
medium-sized enterprises, and public sector. The company offers various wholesale products
and services to communication providers in the UK. The cloud and networking services of
the company are awe-inspiring, and it serves the multinational organizations all over the
world. The company provides services to commercial premises such as hotels and disco; thus,
these premises can avail BT Sports or BT Wi-Fi. The business has various organizational
units that offer excellent products and services to the customers. The main aim of the
company is to create value for the shareholders by providing products and services that are
essential for daily life.
Vodafone Group plc. is a public limited company founded on 16 September 1991 by
Ernest Harrison and Gerry Whent. It operates in telecommunication industry and is a
predecessor of Racal Telecom (Vodafone.com, 2020). The headquarters of Vodafone Group
is located in London, England. It works in various line of services such as mobile phone,
digital television, fixed-line telephone, broadband, and many more that are served worldwide.
⊘ This is a preview!⊘
Do you want full access?
Subscribe today to unlock all pages.
Trusted by 1+ million students worldwide
3FINANCE
The company provides mobile operation services in twenty-four countries and even has a
partnership with forty-two mobile network services. This company offers fixed broadband in
nineteen markets. Vodafone is entering into a partnership with leading inventors related to
technology and many other businesses to build the infrastructure that will lead to a digital
future. The central vision of the company is to use innovative technology and communication
network to develop and transform the lives of the people in society. The business is well
aware of the risk that is associated with the technology and communication system; however;
the company try to identify all issues and bring transparency into the entire system. The
company aims to gain sustainable competitive advantage, improve the return on investments
by attracting more customer engagement, and try to improve the utilization of the asset.
Vodafone operates across twenty-five countries and mainly covers two geographic regions
Europe and rest of the world. The Vodafone foundation offers support to those projects that
primarily focused on the development of public, related to technology in various areas such
as education, health, and many more.
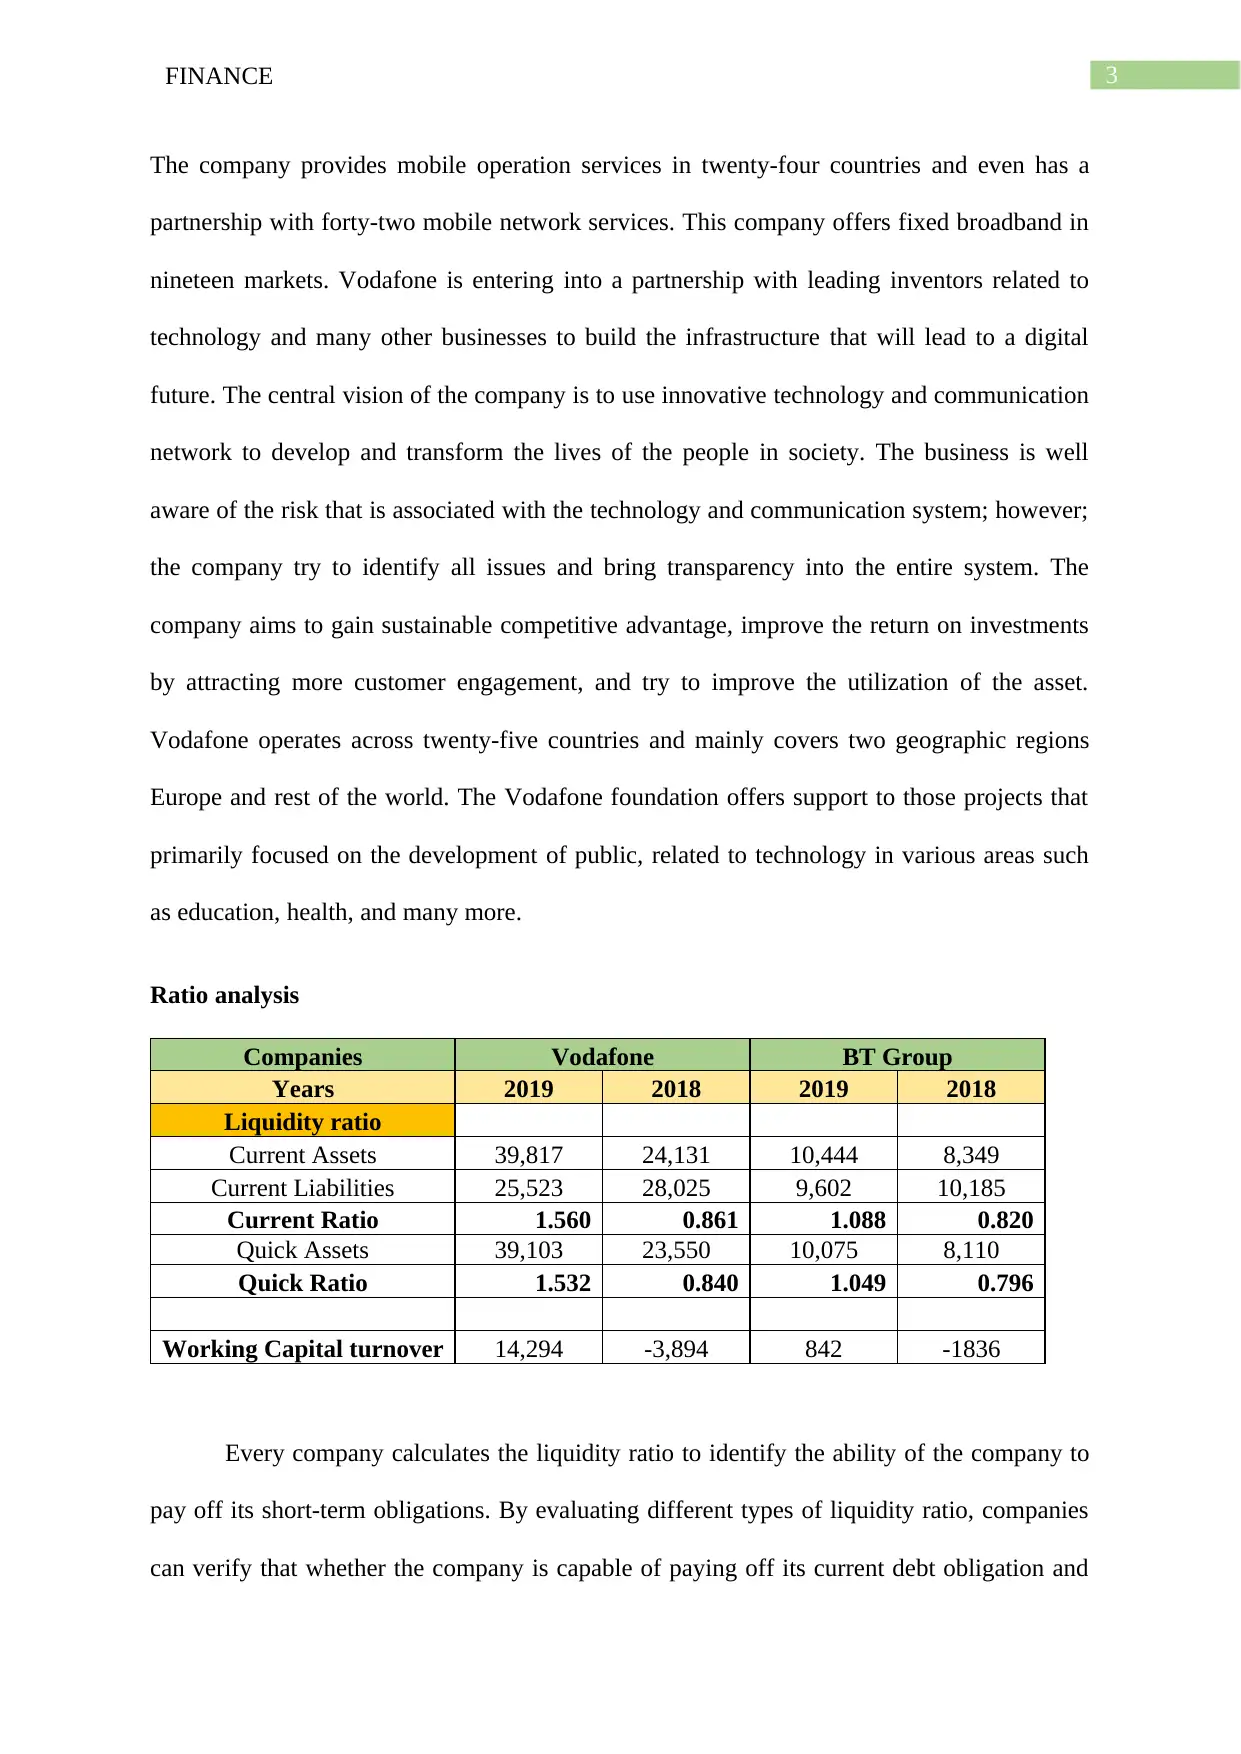
Ratio analysis
Companies Vodafone BT Group
Years 2019 2018 2019 2018
Liquidity ratio
Current Assets 39,817 24,131 10,444 8,349
Current Liabilities 25,523 28,025 9,602 10,185
Current Ratio 1.560 0.861 1.088 0.820
Quick Assets 39,103 23,550 10,075 8,110
Quick Ratio 1.532 0.840 1.049 0.796
Working Capital turnover 14,294 -3,894 842 -1836
Every company calculates the liquidity ratio to identify the ability of the company to
pay off its short-term obligations. By evaluating different types of liquidity ratio, companies
can verify that whether the company is capable of paying off its current debt obligation and
The company provides mobile operation services in twenty-four countries and even has a
partnership with forty-two mobile network services. This company offers fixed broadband in
nineteen markets. Vodafone is entering into a partnership with leading inventors related to
technology and many other businesses to build the infrastructure that will lead to a digital
future. The central vision of the company is to use innovative technology and communication
network to develop and transform the lives of the people in society. The business is well
aware of the risk that is associated with the technology and communication system; however;
the company try to identify all issues and bring transparency into the entire system. The
company aims to gain sustainable competitive advantage, improve the return on investments
by attracting more customer engagement, and try to improve the utilization of the asset.
Vodafone operates across twenty-five countries and mainly covers two geographic regions
Europe and rest of the world. The Vodafone foundation offers support to those projects that
primarily focused on the development of public, related to technology in various areas such
as education, health, and many more.
Ratio analysis
Companies Vodafone BT Group
Years 2019 2018 2019 2018
Liquidity ratio
Current Assets 39,817 24,131 10,444 8,349
Current Liabilities 25,523 28,025 9,602 10,185
Current Ratio 1.560 0.861 1.088 0.820
Quick Assets 39,103 23,550 10,075 8,110
Quick Ratio 1.532 0.840 1.049 0.796
Working Capital turnover 14,294 -3,894 842 -1836
Every company calculates the liquidity ratio to identify the ability of the company to
pay off its short-term obligations. By evaluating different types of liquidity ratio, companies
can verify that whether the company is capable of paying off its current debt obligation and
Paraphrase This Document
Need a fresh take? Get an instant paraphrase of this document with our AI Paraphraser
4FINANCE
can have smooth functioning of its operational activities. The main reason for evaluating
liquidity ratios is to inform various investors and creditors of the company, that what the
current liquidity position of the business is (Rashid 2018). Multiple lenders and creditors are
interested in the liquidity ratios as before granting any credit to the company they want to
make sure that whether the company can repay their fund within the stipulated time. The
current ratio of Vodafone is 1.560 in 2019 and 0.861 in 2018. The current ratio refers to
measurement of liquidity position of an entity. It is evaluated, as current liabilities are due
within next year. For 2019, the current ratio of BT Group is 1.088, and for 2018, it is 0.820.
The above calculations reflect that in 2018, the current ratio is less for both the companies
and in general, it is assumed that a stable current ratio must be higher than one. However, in
2018, the ratio is less than one for both the companies. This shoes that in 2018, both
companies were not able to pay off their short-term obligations. In 2019, the current ratio was
more significant than one in both cases; hence there a stable liquidity position. Vodafone
current ratio is more than BT Group; this indicates that Vodafone has more stable liquidity
position than BT Group, which will be beneficial for the Vodafone company to attract more
investment. The quick ratio of Vodafone in 2019 is 1.532, and in 2018, it comes to 0.840.
The BT Group shows a quick ratio of 1.049 in 2019 and 2018, and it is 0.796. In this case
also, both the companies tended to have a low ratio is 2018; however, in 2019 both attained a
stable liquidity position. Acid test ratio tends to measure the ability of the company to use its
cash and pay off the current obligations as soon as they incur. The quick ratio of Vodafone is
more than BT Group that will prove to be beneficial for the company (Vodafone.com, 2020).
In 2019, the working capital turnover ratio of Vodafone Company was exceptionally high as
compared to BT Group. However, both companies have improved their working capital
turnover as a comparison to the previous year. If both the companies are compared on the
basis of current ratio then Vodafone is having a more stable ratio as compared to BT Group

5FINANCE
in 2019 as well as in 2018. The same goes with quick ratio, Vodafone is reflecting better
position as compared to BT Group in both the years. However, both Vodafone and BT Group
has improved there current and quick ratio from 2018 to 2019. Both companies are improving
their liquidity position over the period of two years.
⊘ This is a preview!⊘
Do you want full access?
Subscribe today to unlock all pages.
Trusted by 1+ million students worldwide
6FINANCE
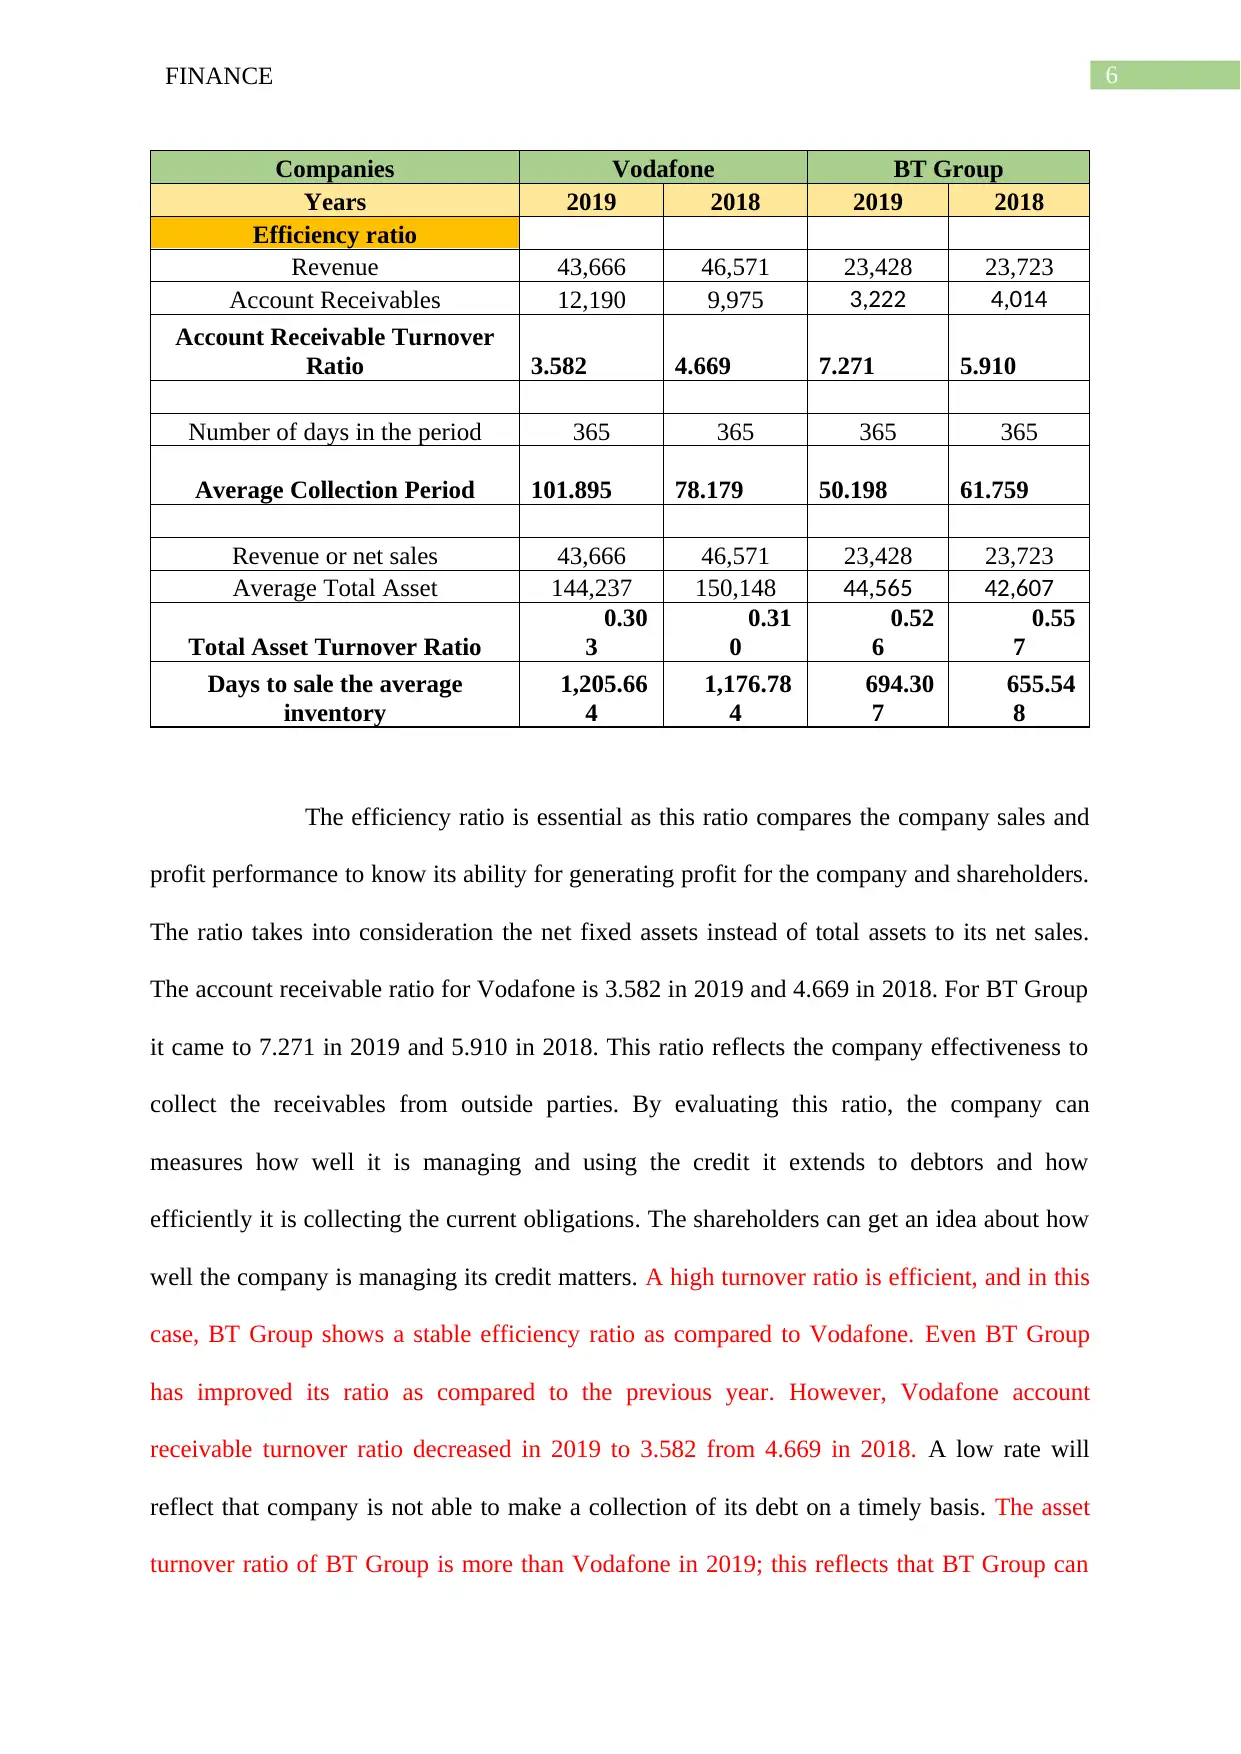
Companies Vodafone BT Group
Years 2019 2018 2019 2018
Efficiency ratio
Revenue 43,666 46,571 23,428 23,723
Account Receivables 12,190 9,975 3,222 4,014
Account Receivable Turnover
Ratio 3.582 4.669 7.271 5.910
Number of days in the period 365 365 365 365
Average Collection Period 101.895 78.179 50.198 61.759
Revenue or net sales 43,666 46,571 23,428 23,723
Average Total Asset 144,237 150,148 44,565 42,607
Total Asset Turnover Ratio
0.30
3
0.31
0
0.52
6
0.55
7
Days to sale the average
inventory
1,205.66
4
1,176.78
4
694.30
7
655.54
8
The efficiency ratio is essential as this ratio compares the company sales and
profit performance to know its ability for generating profit for the company and shareholders.
The ratio takes into consideration the net fixed assets instead of total assets to its net sales.
The account receivable ratio for Vodafone is 3.582 in 2019 and 4.669 in 2018. For BT Group
it came to 7.271 in 2019 and 5.910 in 2018. This ratio reflects the company effectiveness to
collect the receivables from outside parties. By evaluating this ratio, the company can
measures how well it is managing and using the credit it extends to debtors and how
efficiently it is collecting the current obligations. The shareholders can get an idea about how
well the company is managing its credit matters. A high turnover ratio is efficient, and in this
case, BT Group shows a stable efficiency ratio as compared to Vodafone. Even BT Group
has improved its ratio as compared to the previous year. However, Vodafone account
receivable turnover ratio decreased in 2019 to 3.582 from 4.669 in 2018. A low rate will
reflect that company is not able to make a collection of its debt on a timely basis. The asset
turnover ratio of BT Group is more than Vodafone in 2019; this reflects that BT Group can
Paraphrase This Document
Need a fresh take? Get an instant paraphrase of this document with our AI Paraphraser
7FINANCE
generate more sales by using its assets as compared to Vodafone. However, if a comparison
is made between both years, then BT Group had decreased its ratio to 0.526 in 2019 from
0.557 in 2018. The same goes for Vodafone. Both companies need to improve their asset
turnover ratio so that they can generate more sales by efficiently using their assets. If total
asset turnover ratio is taken into consideration for analysing the efficiency of both the
companies then BT Group is more efficient than Vodafone as in 2019, the ratio is 0.303 for
Vodafone and 0.526 for BT Group. However, BT Group ratio has decreased to 0.526 in 2019
from 0.557 in 2108, which shows that BT Group needs to efficiently use its assets to generate
more sales.
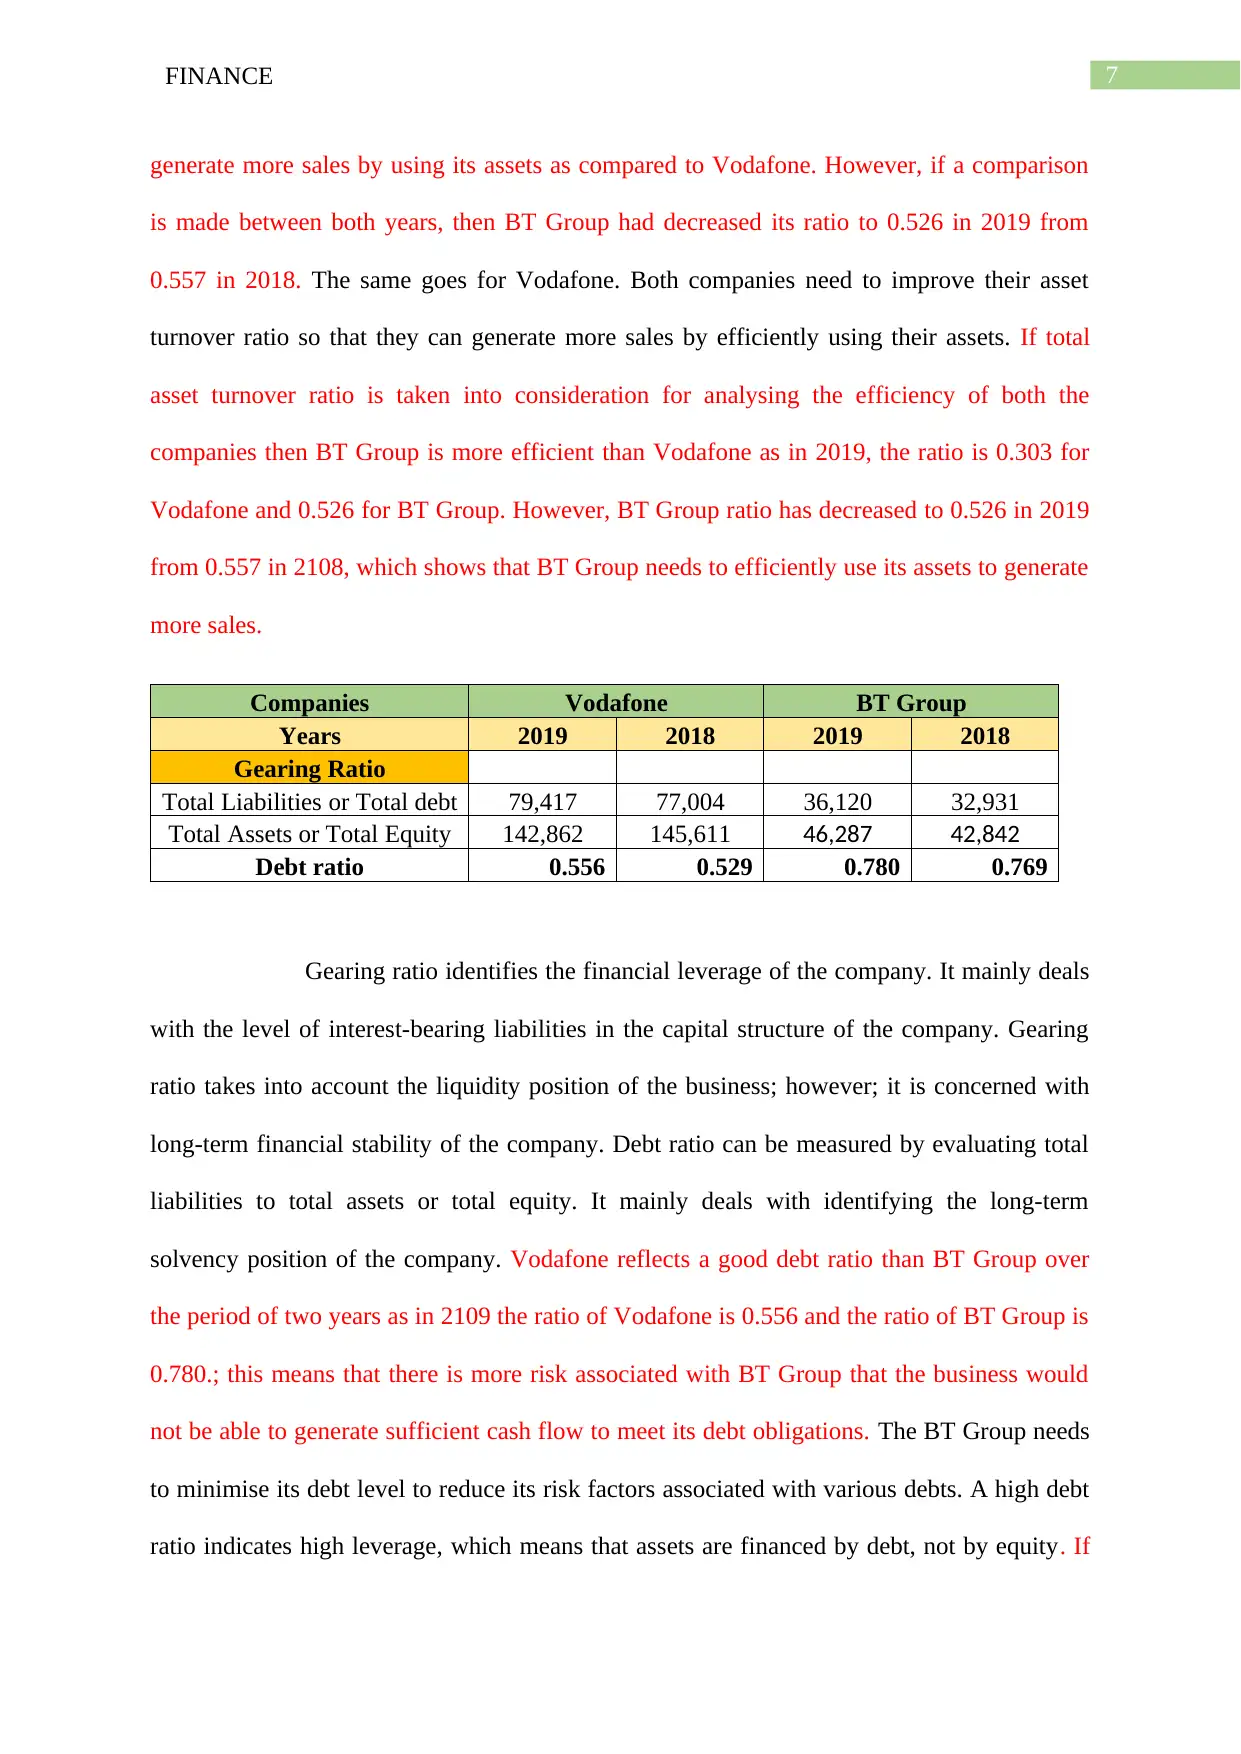
Companies Vodafone BT Group
Years 2019 2018 2019 2018
Gearing Ratio
Total Liabilities or Total debt 79,417 77,004 36,120 32,931
Total Assets or Total Equity 142,862 145,611 46,287 42,842
Debt ratio 0.556 0.529 0.780 0.769
Gearing ratio identifies the financial leverage of the company. It mainly deals
with the level of interest-bearing liabilities in the capital structure of the company. Gearing
ratio takes into account the liquidity position of the business; however; it is concerned with
long-term financial stability of the company. Debt ratio can be measured by evaluating total
liabilities to total assets or total equity. It mainly deals with identifying the long-term
solvency position of the company. Vodafone reflects a good debt ratio than BT Group over
the period of two years as in 2109 the ratio of Vodafone is 0.556 and the ratio of BT Group is
0.780.; this means that there is more risk associated with BT Group that the business would
not be able to generate sufficient cash flow to meet its debt obligations. The BT Group needs
to minimise its debt level to reduce its risk factors associated with various debts. A high debt
ratio indicates high leverage, which means that assets are financed by debt, not by equity. If
generate more sales by using its assets as compared to Vodafone. However, if a comparison
is made between both years, then BT Group had decreased its ratio to 0.526 in 2019 from
0.557 in 2018. The same goes for Vodafone. Both companies need to improve their asset
turnover ratio so that they can generate more sales by efficiently using their assets. If total
asset turnover ratio is taken into consideration for analysing the efficiency of both the
companies then BT Group is more efficient than Vodafone as in 2019, the ratio is 0.303 for
Vodafone and 0.526 for BT Group. However, BT Group ratio has decreased to 0.526 in 2019
from 0.557 in 2108, which shows that BT Group needs to efficiently use its assets to generate
more sales.
Companies Vodafone BT Group
Years 2019 2018 2019 2018
Gearing Ratio
Total Liabilities or Total debt 79,417 77,004 36,120 32,931
Total Assets or Total Equity 142,862 145,611 46,287 42,842
Debt ratio 0.556 0.529 0.780 0.769
Gearing ratio identifies the financial leverage of the company. It mainly deals
with the level of interest-bearing liabilities in the capital structure of the company. Gearing
ratio takes into account the liquidity position of the business; however; it is concerned with
long-term financial stability of the company. Debt ratio can be measured by evaluating total
liabilities to total assets or total equity. It mainly deals with identifying the long-term
solvency position of the company. Vodafone reflects a good debt ratio than BT Group over
the period of two years as in 2109 the ratio of Vodafone is 0.556 and the ratio of BT Group is
0.780.; this means that there is more risk associated with BT Group that the business would
not be able to generate sufficient cash flow to meet its debt obligations. The BT Group needs
to minimise its debt level to reduce its risk factors associated with various debts. A high debt
ratio indicates high leverage, which means that assets are financed by debt, not by equity. If

8FINANCE
Vodafone ratio is compared within two years then it has increased its ratio, which is not
profitable for the company as higher debt ratio attracts more risks to the company. The same
situation is faced by BT Group as its ratio also increased to 0.780 in 2019 from 0.769 in
2018.
Vodafone ratio is compared within two years then it has increased its ratio, which is not
profitable for the company as higher debt ratio attracts more risks to the company. The same
situation is faced by BT Group as its ratio also increased to 0.780 in 2019 from 0.769 in
2018.
⊘ This is a preview!⊘
Do you want full access?
Subscribe today to unlock all pages.
Trusted by 1+ million students worldwide
9FINANCE
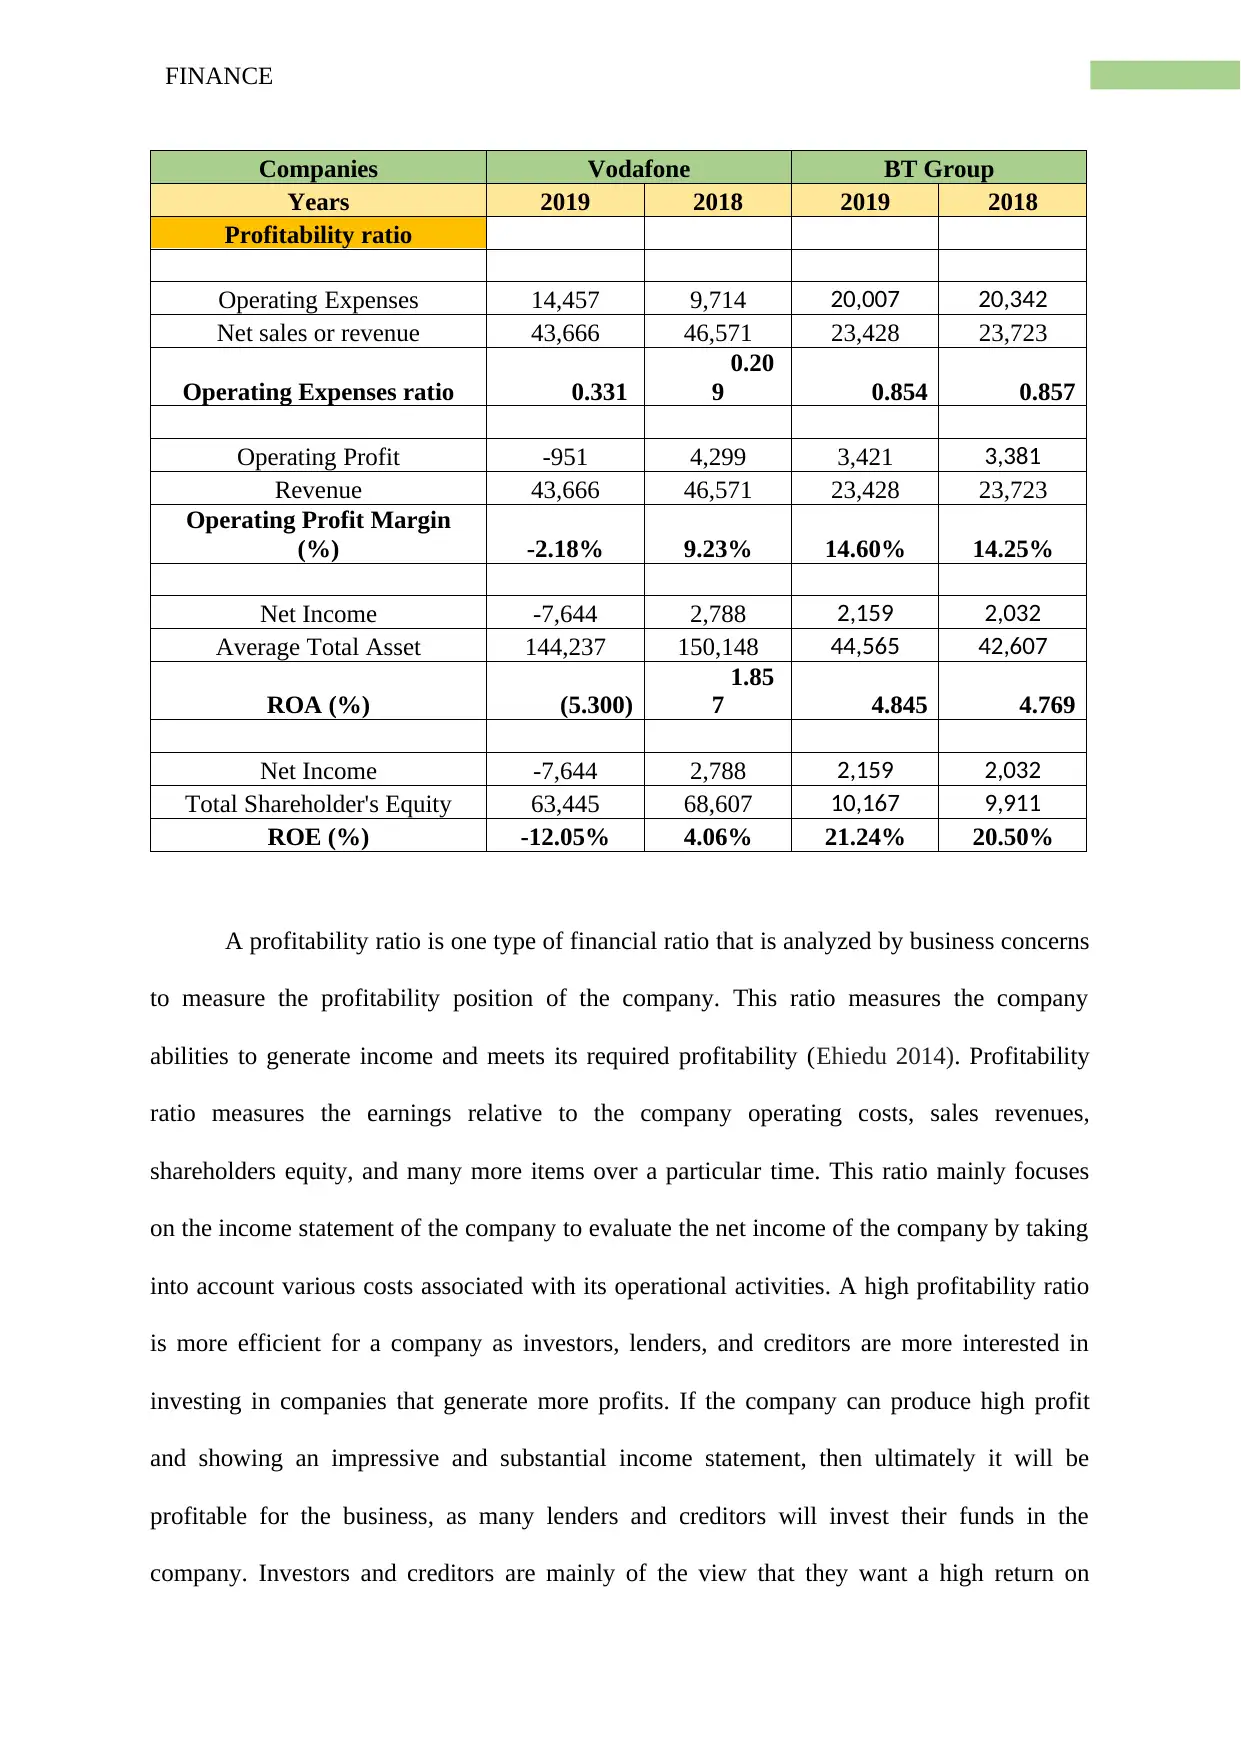
Companies Vodafone BT Group
Years 2019 2018 2019 2018
Profitability ratio
Operating Expenses 14,457 9,714 20,007 20,342
Net sales or revenue 43,666 46,571 23,428 23,723
Operating Expenses ratio 0.331
0.20
9 0.854 0.857
Operating Profit -951 4,299 3,421 3,381
Revenue 43,666 46,571 23,428 23,723
Operating Profit Margin
(%) -2.18% 9.23% 14.60% 14.25%
Net Income -7,644 2,788 2,159 2,032
Average Total Asset 144,237 150,148 44,565 42,607
ROA (%) (5.300)
1.85
7 4.845 4.769
Net Income -7,644 2,788 2,159 2,032
Total Shareholder's Equity 63,445 68,607 10,167 9,911
ROE (%) -12.05% 4.06% 21.24% 20.50%
A profitability ratio is one type of financial ratio that is analyzed by business concerns
to measure the profitability position of the company. This ratio measures the company
abilities to generate income and meets its required profitability (Ehiedu 2014). Profitability
ratio measures the earnings relative to the company operating costs, sales revenues,
shareholders equity, and many more items over a particular time. This ratio mainly focuses
on the income statement of the company to evaluate the net income of the company by taking
into account various costs associated with its operational activities. A high profitability ratio
is more efficient for a company as investors, lenders, and creditors are more interested in
investing in companies that generate more profits. If the company can produce high profit
and showing an impressive and substantial income statement, then ultimately it will be
profitable for the business, as many lenders and creditors will invest their funds in the
company. Investors and creditors are mainly of the view that they want a high return on
Paraphrase This Document
Need a fresh take? Get an instant paraphrase of this document with our AI Paraphraser
10FINANCE
investments and the companies that show high profitability ratio can attract more
investments. A lower operating expense ratio is better for a company. If comparison is made
between both companies, then Vodafone is in better condition as compared to BT Group as in
2109, Vodafone has a ratio of 0.331 that is less than 0.854, which is the ratio of BT Group
(Btplc.com, 2020). The BT Group needs to decrease its operating expenses to obtain a stable
position. Even though BT Group reduced its operating expenses in 2019 as compared to
2018, however, the cost is much higher if it is compared with the operating cost of Vodafone
in 2019. Even Vodafone needs to reduce its costs as it increased to $m 14,457 in 2019 from
$m 9,714 in 2018 (Btplc.com, 2020).
Operating profit ratio measures the company ability to control cost and
expenses related to the business operations. There are various factors associated with the
business that has an impact on the margin of the business. This ratio is one type of
performance ratio that measures the ability of the company to generate profit from its
operating activities. An excellent operating profit margin is necessary for business entities as
it enables the company to pay for its fixed costs. BT Group has an excessive stable operating
profit margin as compared to Vodafone as in 2019, and the Vodafone company is showing a
negative operating profit margin that is not favourable for the company. The Vodafone needs
to reduce its operating costs to obtain a high operating profit that will result in high operating
profit margin. In 2019, the operating profit margin of Vodafone is negative 2.18% that is
lower than the ratio of BT Group, which is 14.60% thus showing a stable position.
Return on assets measures the net income that is produced by the total assets of the
company. It measures how profitable the company’s assets are to generate high net income.
This ratio reflects the capital intensity of the company that will be used to attract significant
initial investments in future. A higher ratio is better for the company. In this case, BT Group
has a higher return on asset ratio concerning Vodafone. Even the BT Group has improved its
11FINANCE
ratio in 2019. In 2109, Vodafone incurs a negative return of – 5.300 on asset ratio that is not
beneficial for the firm (Vodafone.com, 2020). The company needs to generate more net
income to obtain a stable position. This situation shows that Vodafone is not efficiently using
its assets to generate sales revenue.
Return on equity mainly deals with the net income and the shareholder's
equity. This ratio reflects how the company is using the investments made by the
shareholders to generate net income. In short, it can be said that this ratio indicates the
management ability to create more revenue by using the equity available with the business.
The ratio of BT Group is more than Vodafone that demonstrates the company is more
successful in generating cash internally. Vodafone return on equity ratio is negative in 2109,
which means the management is not able to use the equity efficiently that ultimately leads to
negative results. A high rate is good for the business. In case of Vodafone, the shareholders
are losing instead of gaining and this is not profitable for the company. If both companies are
compared then BT Group is sgowing more stable position as compared to Vodafone over
both the years and in 2019, the ratio of BT Group is excellent as it reflects a ratio of 21.24%
and for Vodafone it is -12.05%.
Sustainability reporting
The BT Group is aiming to build a better future where people are ready to take
challenges to make a better tomorrow. BT mainly focuses on advanced digital skills that will
ultimately help people to prepare a better future in the field of the digital world. Even the
company focuses on employing people and supports UK productivity (Btplc.com, 2020). The
business tries to play a significant role in providing long-term benefits to the stakeholders and
society. There are various risk and challenges associated with the advanced technology and
communication services; however, the company implemented different relevant strategies to
overcome the difficulties and to provide excellent services to customers worldwide. The
⊘ This is a preview!⊘
Do you want full access?
Subscribe today to unlock all pages.
Trusted by 1+ million students worldwide
1 out of 23
Related Documents


Your All-in-One AI-Powered Toolkit for Academic Success.
+13062052269
info@desklib.com
Available 24*7 on WhatsApp / Email
![[object Object]](/_next/static/media/star-bottom.7253800d.svg)
Unlock your academic potential
Copyright © 2020–2026 A2Z Services. All Rights Reserved. Developed and managed by ZUCOL.