Financial Performance Analysis: Coca-Cola vs. Dominos (HI5002 Finance)
VerifiedAdded on 2023/06/08
|16
|3919
|94
Report
AI Summary
This report provides a comprehensive financial analysis of Coca-Cola and Dominos, two publicly listed companies. It begins with an introduction and a description of each company's operations and comparative advantages. The core of the report involves a detailed calculation and analysis of various financial performance ratios, including profitability, capital structure (leverage), and liquidity ratios, spanning a three-year period. The report also examines the monthly share price movements of both companies, identifying significant influencing factors. Furthermore, it delves into the beta values and expected rates of return, along with a discussion of their dividend policies. A recommendation letter is included, offering financial and investment advice based on the analysis. The conclusion summarizes the findings, and a list of references is provided. This report is a comprehensive overview of the financial health and performance of Coca-Cola and Dominos.
Running Head: FINANCE FOR MASTERS 0
Finance for Masters
Finance for Masters
Paraphrase This Document
Need a fresh take? Get an instant paraphrase of this document with our AI Paraphraser
FINANCE FOR MASTERS 1
Table of Contents
Introduction................................................................................................................................2
Description of operation and comparative advantages..............................................................2
The Coca Cola........................................................................................................................2
Dominos.................................................................................................................................2
Calculation of the performance ratios........................................................................................3
Profitability ratios...................................................................................................................3
Capital structure (leverage) ratios..........................................................................................6
Liquidity ratios.......................................................................................................................7
Analysis of monthly share prices movements............................................................................9
Coca Cola...............................................................................................................................9
Dominos...............................................................................................................................10
Significant factors which may have influenced the share price...............................................10
Coca Cola.............................................................................................................................10
Dominos...............................................................................................................................11
Beta values and expected Rates of Return...............................................................................11
Dividend policies.....................................................................................................................12
Recommendation letter............................................................................................................12
Conclusion................................................................................................................................13
References................................................................................................................................14
FINANCE FOR MASTERS 2
Introduction
In order to satisfy the needs of the investors and the management it is necessary to assess the
financial position of the company. To take the financial decisions it is necessary to find a
base to do so and therefore the below report determines the position of the firm through the
medium of the ratios. For the purpose of the analysis the two chosen companies are Coca
Cola and the Dominos. The report also delivers the preview of the share price movements and
the utilisation of the capital asset pricing model. There are different dividend policies for
every company and these policies are also scrutinised in case of both the companies.
Moreover the purpose of this report is to provide the entire glance on the companies’
financials and relating them with each other as well as within itself for a period of three years
(Penman, Reggiani, Richardson and Tuna, 2017).
Description of operation and comparative advantages
The Coca Cola
The Coca Cola Company is an American Corporation which is engaged in the activities like
manufacturing, retailing and the marketing of the non-alcoholic beverage concentrates and
the syrups. The company is known for one of the most saleable and the likeable predict Coca
Cola, which was invested in the year 1886 by the pharmacist names John Stith. Currently the
company is operating under the loss of $35.410a and the recorded the net income of the
company is US$1.248 billion in the financial year 2017. The Coca Cola Company offers
more than 350 brands in the 200 countries. In terms of the marketing and the advertising the
Coca Cola is most prolific (Coca Cola, 2018).
Dominos
Dominos on the other hand is the Americas largest chain of pizza founded in the year 1960.
The company is engaged in catering the needs of the customers by delivering them the high
⊘ This is a preview!⊘
Do you want full access?
Subscribe today to unlock all pages.
Trusted by 1+ million students worldwide
FINANCE FOR MASTERS 3
quality and wide variety of the pizzas. The unique features are its USP and the menu is
relatively simple and likeable. Currently the company is performing outstanding and features
the net income of US$214.68 billion and reported revenue of the US $2.47 billion in the
financial year 2017 (Press Release, 2018).
Calculation of the performance ratios
Ratio analysis is the method which is adopted by the organisation i order to compare its
performance either in relation to the past years or in comparison to the other companies
operating in the similar industry. The main purpose of the ratio calculation of the ratios is to
get an understanding of the liquidity position, the leverage taken by the company, the
profitability and the way the capital structure is formed to determine the entire glance of the
company (Krantz and Johnson, 2014).
Profitability ratios
Profitability ratios are utilized to assess the productivity of the organization. The speculators
are normally intrigued by these sorts of ratios with the goal that they can have a
comprehensive understanding of how much share they are going to receive consequently
rather than the amount invested in the resources into the specific areas of organization. There
is wide range of ratios under the umbrella of the profitability ratios such as determined below
(Saleem and Rehman, 2011).
Net profit margin: The net profit can be determined as the number of sakes dollars which
are remaining after the set off of all the operating expenses and accounts for actual profit
(Parrino, Kidwell and Bates, 2011).
2015
201
6
201
7 2015
201
6
201
7
Paraphrase This Document
Need a fresh take? Get an instant paraphrase of this document with our AI Paraphraser
FINANCE FOR MASTERS 4
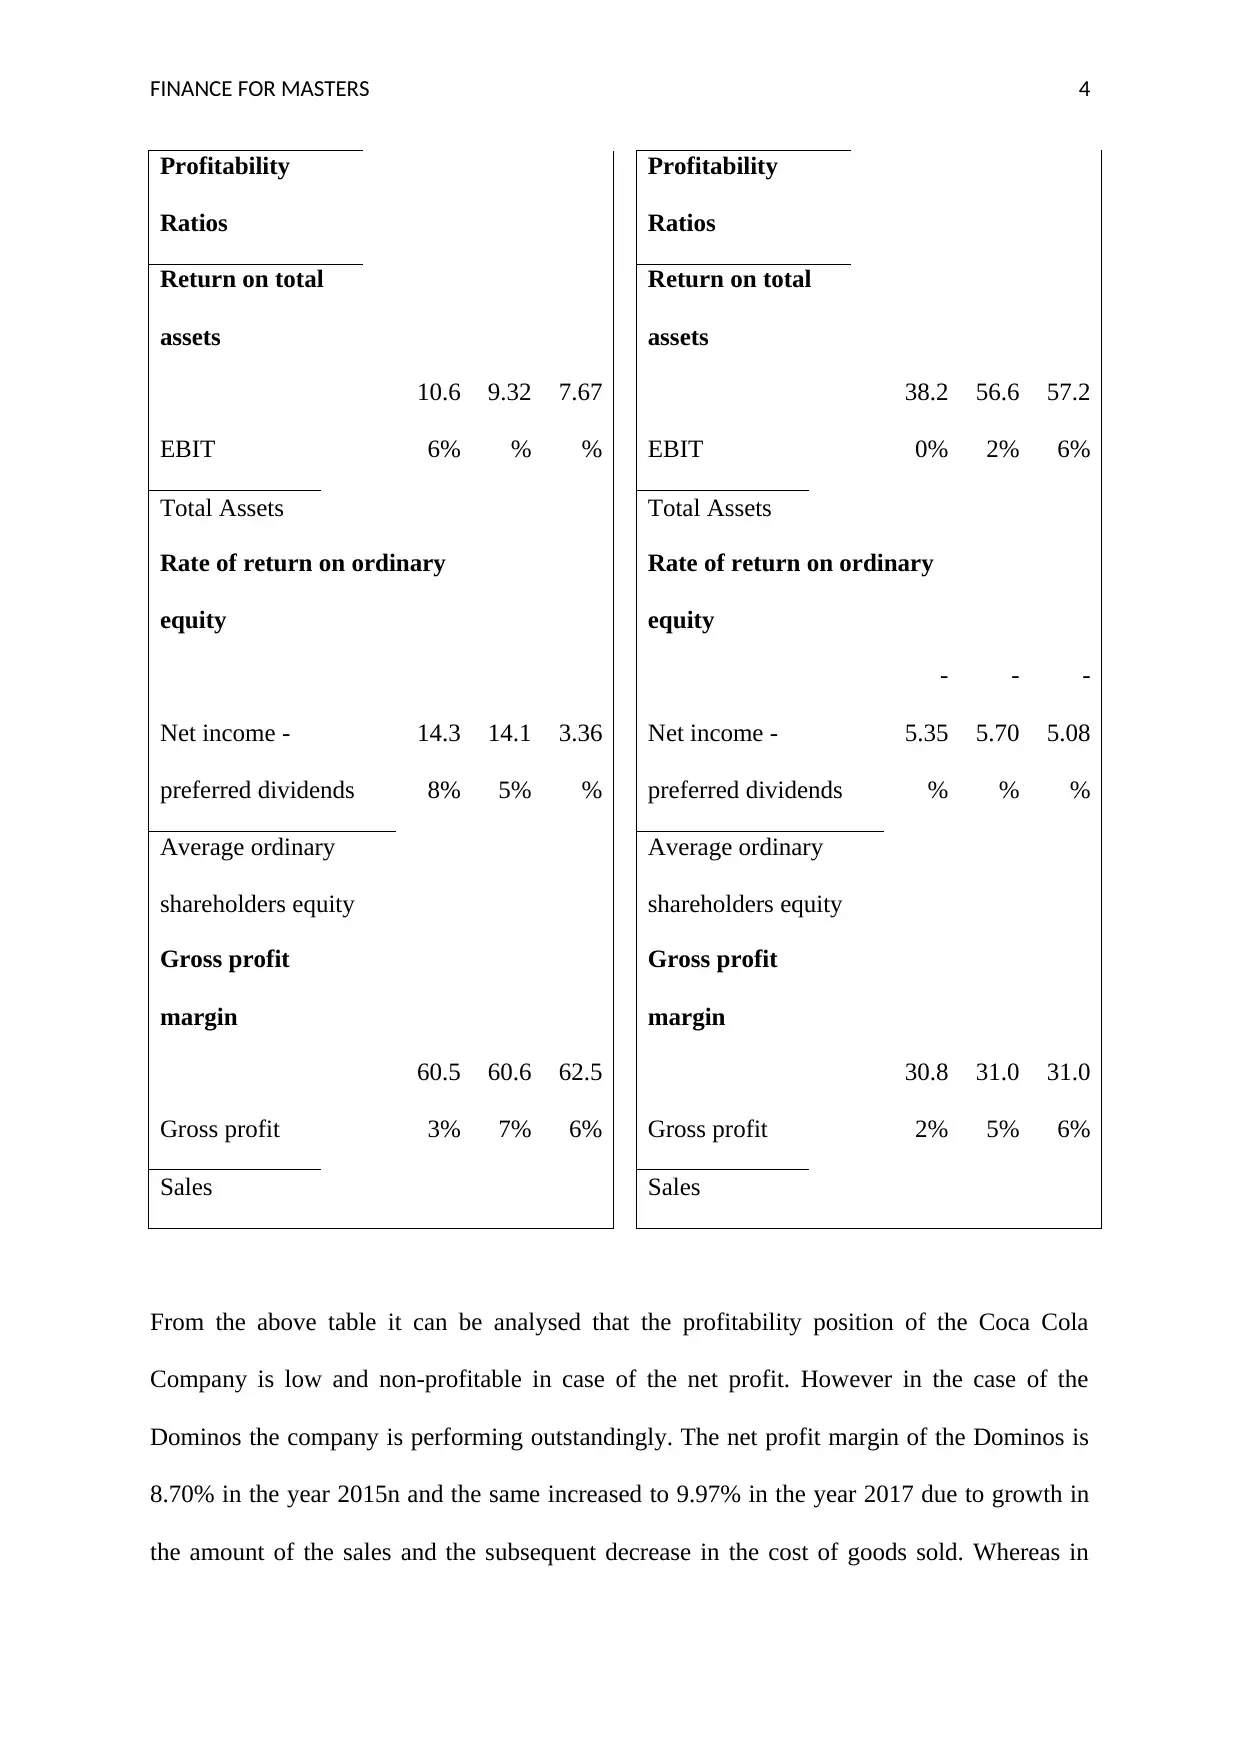
Profitability
Ratios
Profitability
Ratios
Return on total
assets
Return on total
assets
EBIT
10.6
6%
9.32
%
7.67
% EBIT
38.2
0%
56.6
2%
57.2
6%
Total Assets Total Assets
Rate of return on ordinary
equity
Rate of return on ordinary
equity
Net income -
preferred dividends
14.3
8%
14.1
5%
3.36
%
Net income -
preferred dividends
-
5.35
%
-
5.70
%
-
5.08
%
Average ordinary
shareholders equity
Average ordinary
shareholders equity
Gross profit
margin
Gross profit
margin
Gross profit
60.5
3%
60.6
7%
62.5
6% Gross profit
30.8
2%
31.0
5%
31.0
6%
Sales Sales
From the above table it can be analysed that the profitability position of the Coca Cola
Company is low and non-profitable in case of the net profit. However in the case of the
Dominos the company is performing outstandingly. The net profit margin of the Dominos is
8.70% in the year 2015n and the same increased to 9.97% in the year 2017 due to growth in
the amount of the sales and the subsequent decrease in the cost of goods sold. Whereas in
Profitability
Ratios
Profitability
Ratios
Return on total
assets
Return on total
assets
EBIT
10.6
6%
9.32
%
7.67
% EBIT
38.2
0%
56.6
2%
57.2
6%
Total Assets Total Assets
Rate of return on ordinary
equity
Rate of return on ordinary
equity
Net income -
preferred dividends
14.3
8%
14.1
5%
3.36
%
Net income -
preferred dividends
-
5.35
%
-
5.70
%
-
5.08
%
Average ordinary
shareholders equity
Average ordinary
shareholders equity
Gross profit
margin
Gross profit
margin
Gross profit
60.5
3%
60.6
7%
62.5
6% Gross profit
30.8
2%
31.0
5%
31.0
6%
Sales Sales
From the above table it can be analysed that the profitability position of the Coca Cola
Company is low and non-profitable in case of the net profit. However in the case of the
Dominos the company is performing outstandingly. The net profit margin of the Dominos is
8.70% in the year 2015n and the same increased to 9.97% in the year 2017 due to growth in
the amount of the sales and the subsequent decrease in the cost of goods sold. Whereas in
FINANCE FOR MASTERS 5
case of the Coca Cola the net profit margin of the company was better than the Dominos in
the year 2015 at 16.60% however, due to the changes in the season the volume of sales
decreased and the net profit margin ended at 3.24%. Hence, it can be interpreted that in this
area Dominos performed better (Nikolai, Bazley and Jones, 2009).
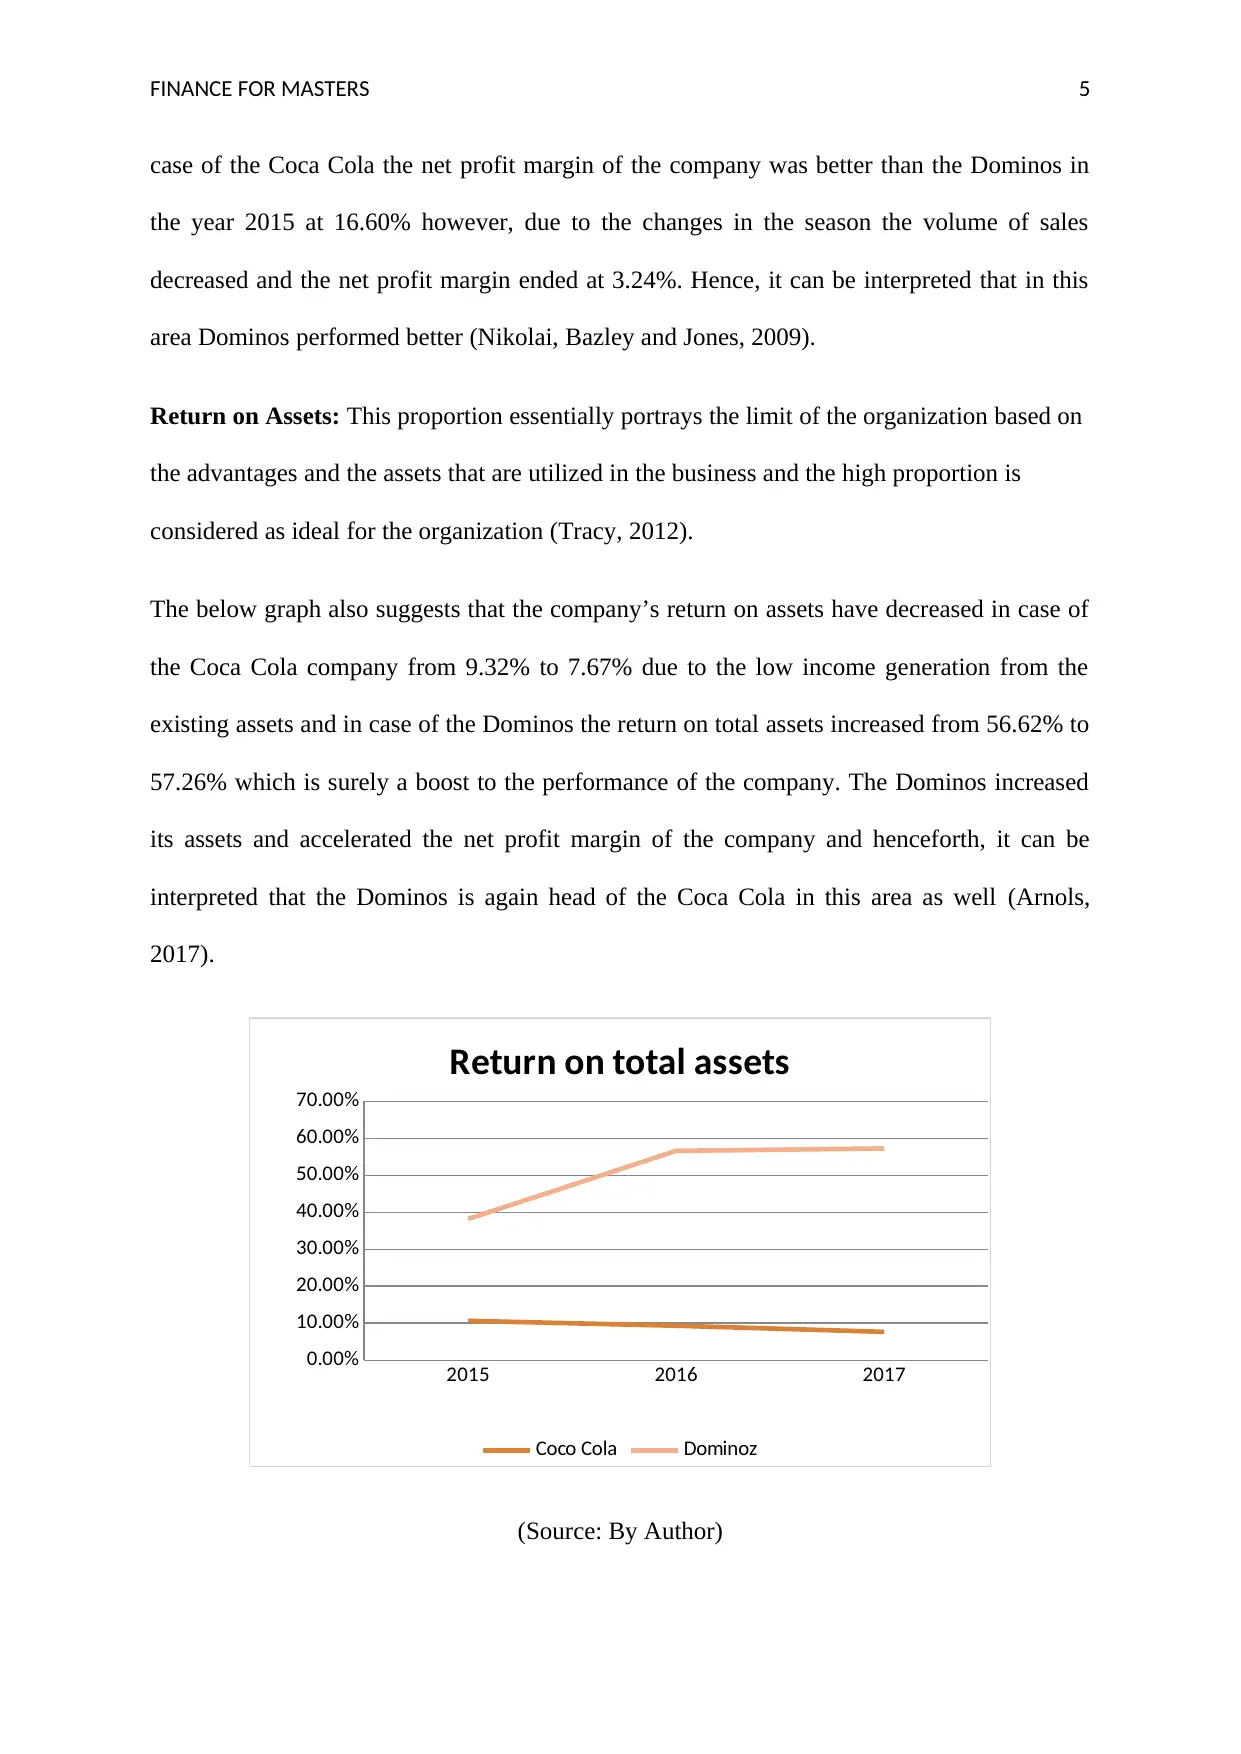
Return on Assets: This proportion essentially portrays the limit of the organization based on
the advantages and the assets that are utilized in the business and the high proportion is
considered as ideal for the organization (Tracy, 2012).
The below graph also suggests that the company’s return on assets have decreased in case of
the Coca Cola company from 9.32% to 7.67% due to the low income generation from the
existing assets and in case of the Dominos the return on total assets increased from 56.62% to
57.26% which is surely a boost to the performance of the company. The Dominos increased
its assets and accelerated the net profit margin of the company and henceforth, it can be
interpreted that the Dominos is again head of the Coca Cola in this area as well (Arnols,
2017).
2015 2016 2017
0.00%
10.00%
20.00%
30.00%
40.00%
50.00%
60.00%
70.00%
Return on total assets
Coco Cola Dominoz
(Source: By Author)
case of the Coca Cola the net profit margin of the company was better than the Dominos in
the year 2015 at 16.60% however, due to the changes in the season the volume of sales
decreased and the net profit margin ended at 3.24%. Hence, it can be interpreted that in this
area Dominos performed better (Nikolai, Bazley and Jones, 2009).
Return on Assets: This proportion essentially portrays the limit of the organization based on
the advantages and the assets that are utilized in the business and the high proportion is
considered as ideal for the organization (Tracy, 2012).
The below graph also suggests that the company’s return on assets have decreased in case of
the Coca Cola company from 9.32% to 7.67% due to the low income generation from the
existing assets and in case of the Dominos the return on total assets increased from 56.62% to
57.26% which is surely a boost to the performance of the company. The Dominos increased
its assets and accelerated the net profit margin of the company and henceforth, it can be
interpreted that the Dominos is again head of the Coca Cola in this area as well (Arnols,
2017).
2015 2016 2017
0.00%
10.00%
20.00%
30.00%
40.00%
50.00%
60.00%
70.00%
Return on total assets
Coco Cola Dominoz
(Source: By Author)
⊘ This is a preview!⊘
Do you want full access?
Subscribe today to unlock all pages.
Trusted by 1+ million students worldwide
FINANCE FOR MASTERS 6
Return on Equity
The return on equity showcases the capability of the company in offering the return on the
funds invested by the shareholders on their invested capital. If the profit is high the company
will generate the higher returns for the company. The return on equity will determine the
portion of the equity held by the investors to enhance the future possibilities Vogel, H.L.
(2014).
Capital structure (leverage) ratios
The capital structure ratios of the company are the composition of so many ratios. It basically
determines the portion of the equity and the debt in different manner. This ratio provides the
insight on how risky the company is and how well they can cope up with it (Warren and
Jones, 2018).
Debt to Equity Ratio
Debt to Equity ratio is the composition of the debt and the equity and its consequences and
future options (Nikolai, Bazley and Jones, 2009). From the above analysis it can be
concluded that the debt to equity ratio of the Coca Cola Company is 1.83 in the year 2017
and it increased from 1.29 in the year 2016. The dominos on the other hand booked the ratio
of 3.77 in the year 2017. Therefore it can be interpreted that the dominos company is more
towards the financing through the debt and vice versa in case of the Coca Cola Company.
The debt component gives the benefit of the tax; however the equity gives the pleasure of the
risk. Henceforth, the company needs to take care of the fact that in order to save too much of
the tax the company is getting more liable towards the payment of the fixed amount.
Moreover to much of the debt component is not a good sign hence, the Dominos shall focus
on improving the debt to equity ratio (Lee, Lee and Lee, 2009).
Paraphrase This Document
Need a fresh take? Get an instant paraphrase of this document with our AI Paraphraser
FINANCE FOR MASTERS 7
Interest Coverage Ratio
The interest coverage ratio also known as the Times Earned ratio is a combination of the debt
and the profitability ratio which determines the fact, how easily the company can pay its
interest on the outstanding debt (Warren, Reeve and Duchac, 2011).
As per the above analysis the interest coverage ratio of the Coca Cola Company is 8.02 and it
fell down from 11.10 in the year 2016. In case of the Dominos the interest coverage ratio is
3.13 in the year 2016 and it rose to 3.27 in the year 2017. The ability of the Dominos
Company is sounder to pay the interest amount in its outstanding debt and in case of the Coca
Cola company the company needs to improve its position and therefore it can be concluded
that the Dominos got an up hand in this year (Arnols, 2017).
Liquidity ratios
The liquidity ratio determines the liquid position of the company and the ability of the
company and to convert the assets into the liquid to utilise it. The ratio basically measures the
time period in which the company can easily convert the assets into cash. The liquidity ratio
is of the interest of the investor so that they can analyse the position of the company and
invest the shares in the company accordingly (Lee, Lee and Lee, 2009).
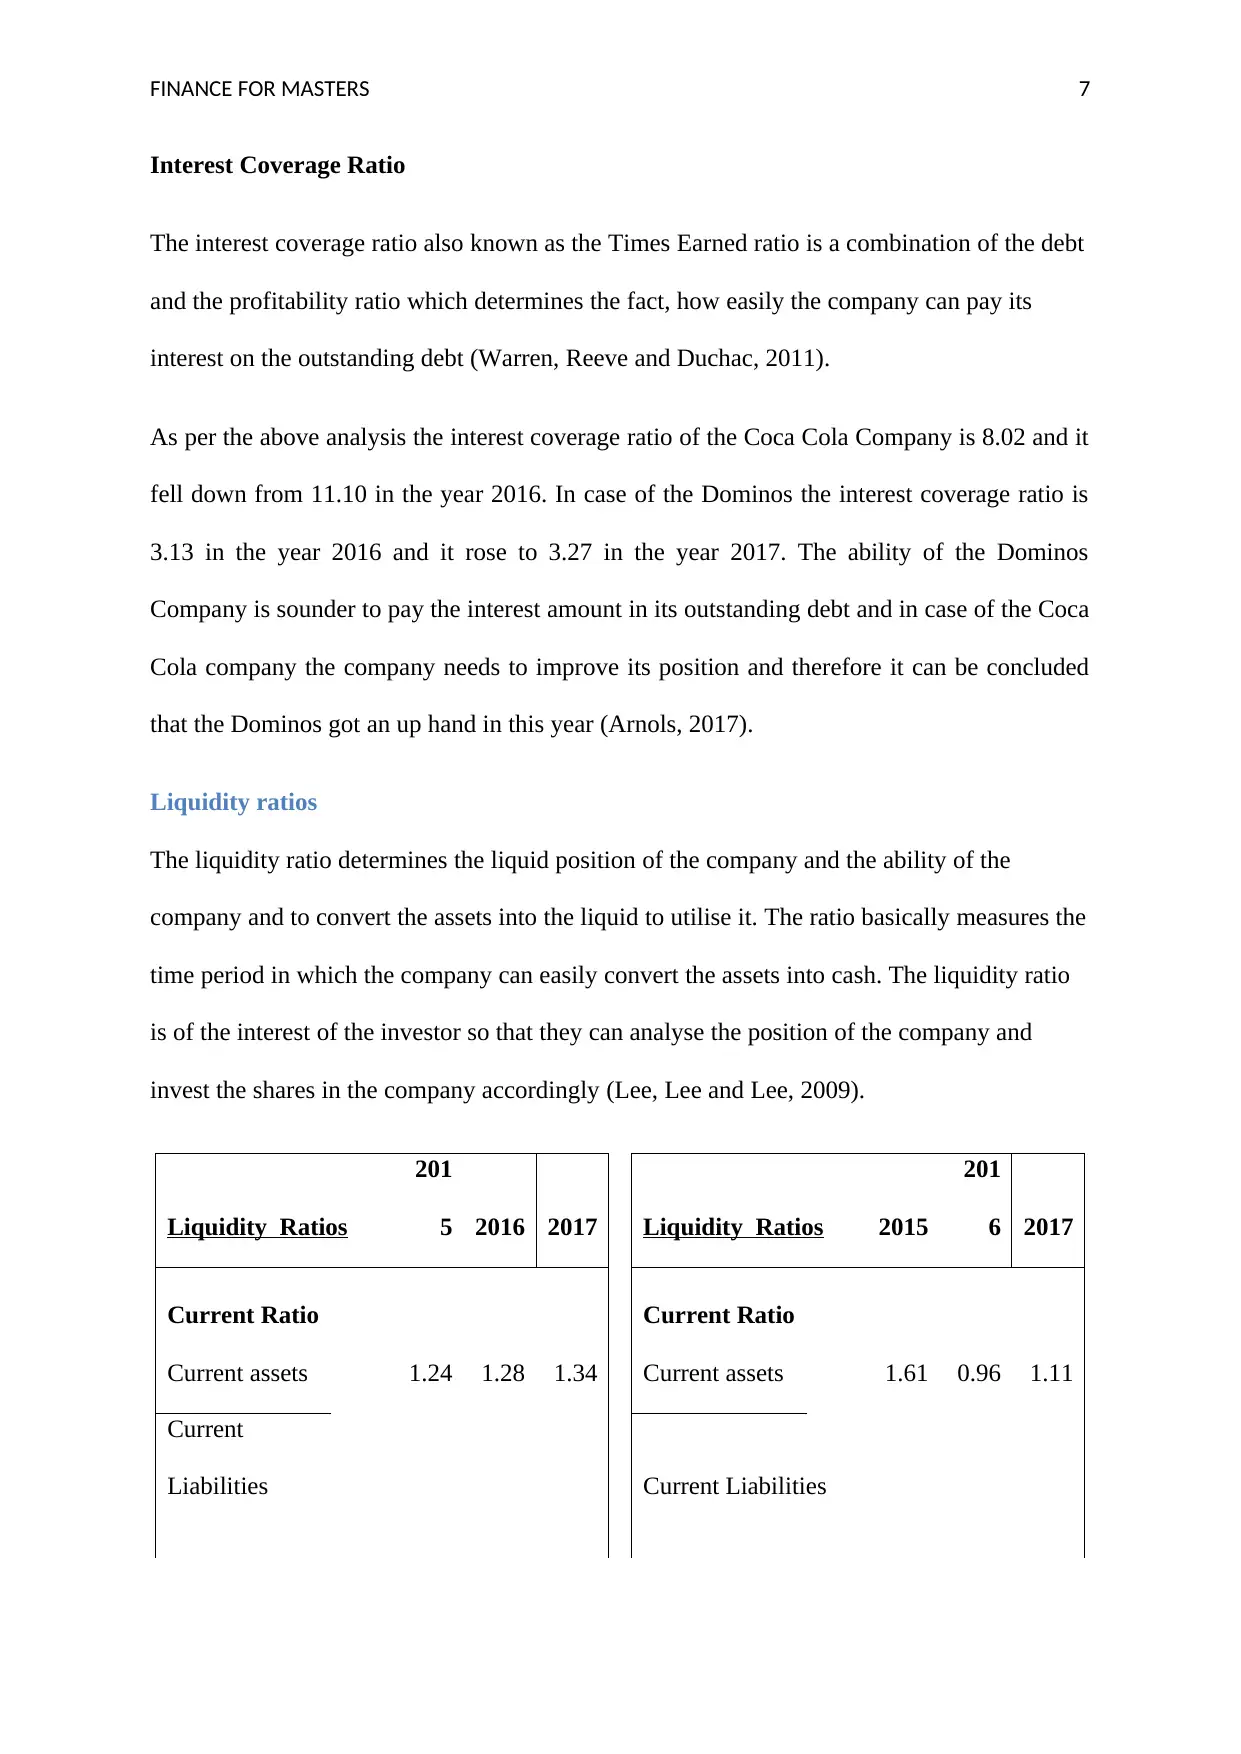
Liquidity Ratios
201
5 2016 2017 Liquidity Ratios 2015
201
6 2017
Current Ratio Current Ratio
Current assets 1.24 1.28 1.34 Current assets 1.61 0.96 1.11
Current
Liabilities Current Liabilities
Interest Coverage Ratio
The interest coverage ratio also known as the Times Earned ratio is a combination of the debt
and the profitability ratio which determines the fact, how easily the company can pay its
interest on the outstanding debt (Warren, Reeve and Duchac, 2011).
As per the above analysis the interest coverage ratio of the Coca Cola Company is 8.02 and it
fell down from 11.10 in the year 2016. In case of the Dominos the interest coverage ratio is
3.13 in the year 2016 and it rose to 3.27 in the year 2017. The ability of the Dominos
Company is sounder to pay the interest amount in its outstanding debt and in case of the Coca
Cola company the company needs to improve its position and therefore it can be concluded
that the Dominos got an up hand in this year (Arnols, 2017).
Liquidity ratios
The liquidity ratio determines the liquid position of the company and the ability of the
company and to convert the assets into the liquid to utilise it. The ratio basically measures the
time period in which the company can easily convert the assets into cash. The liquidity ratio
is of the interest of the investor so that they can analyse the position of the company and
invest the shares in the company accordingly (Lee, Lee and Lee, 2009).
Liquidity Ratios
201
5 2016 2017 Liquidity Ratios 2015
201
6 2017
Current Ratio Current Ratio
Current assets 1.24 1.28 1.34 Current assets 1.61 0.96 1.11
Current
Liabilities Current Liabilities
FINANCE FOR MASTERS 8
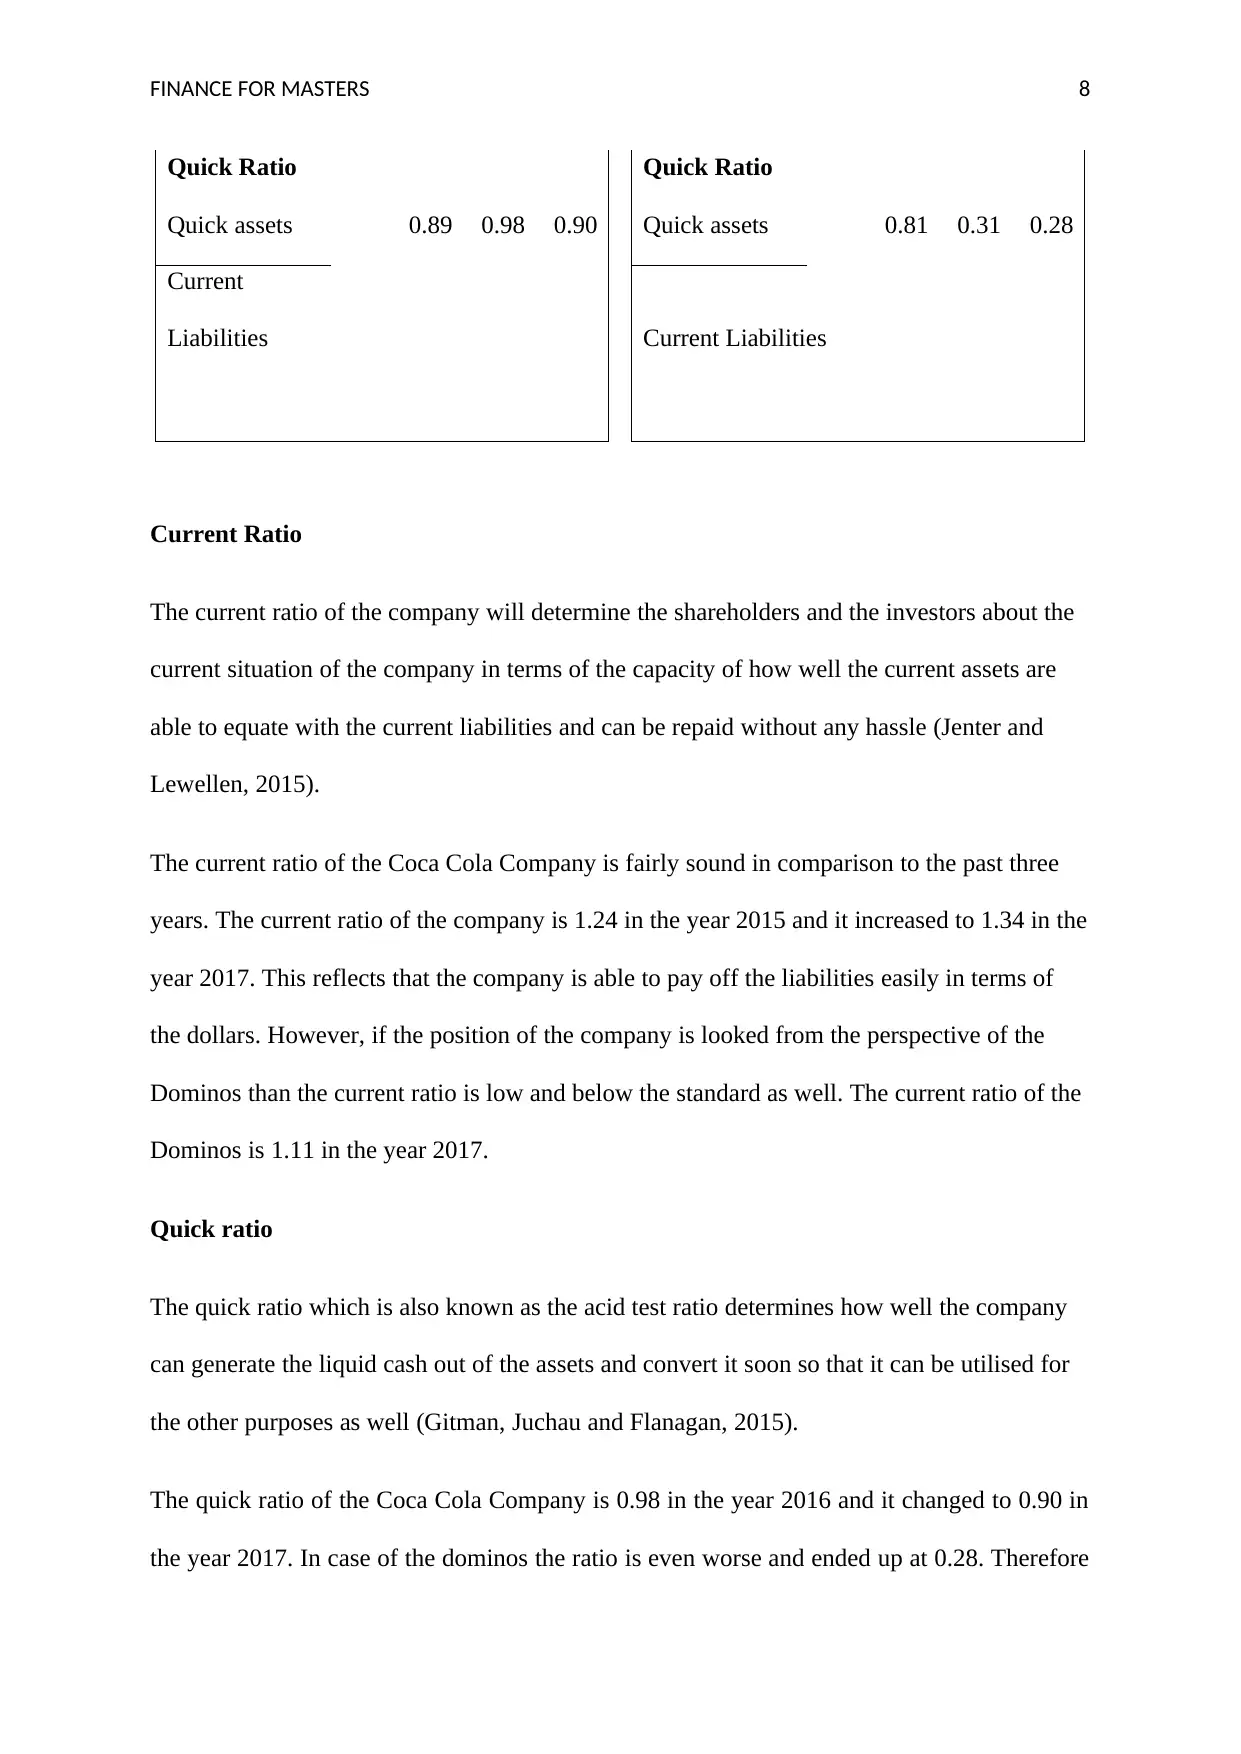
Quick Ratio Quick Ratio
Quick assets 0.89 0.98 0.90 Quick assets 0.81 0.31 0.28
Current
Liabilities Current Liabilities
Current Ratio
The current ratio of the company will determine the shareholders and the investors about the
current situation of the company in terms of the capacity of how well the current assets are
able to equate with the current liabilities and can be repaid without any hassle (Jenter and
Lewellen, 2015).
The current ratio of the Coca Cola Company is fairly sound in comparison to the past three
years. The current ratio of the company is 1.24 in the year 2015 and it increased to 1.34 in the
year 2017. This reflects that the company is able to pay off the liabilities easily in terms of
the dollars. However, if the position of the company is looked from the perspective of the
Dominos than the current ratio is low and below the standard as well. The current ratio of the
Dominos is 1.11 in the year 2017.
Quick ratio
The quick ratio which is also known as the acid test ratio determines how well the company
can generate the liquid cash out of the assets and convert it soon so that it can be utilised for
the other purposes as well (Gitman, Juchau and Flanagan, 2015).
The quick ratio of the Coca Cola Company is 0.98 in the year 2016 and it changed to 0.90 in
the year 2017. In case of the dominos the ratio is even worse and ended up at 0.28. Therefore
⊘ This is a preview!⊘
Do you want full access?
Subscribe today to unlock all pages.
Trusted by 1+ million students worldwide
FINANCE FOR MASTERS 9
it can be interpreted that in this case both the companies need to improve their performances
and focus on improving the cash (Press Release, 2018).
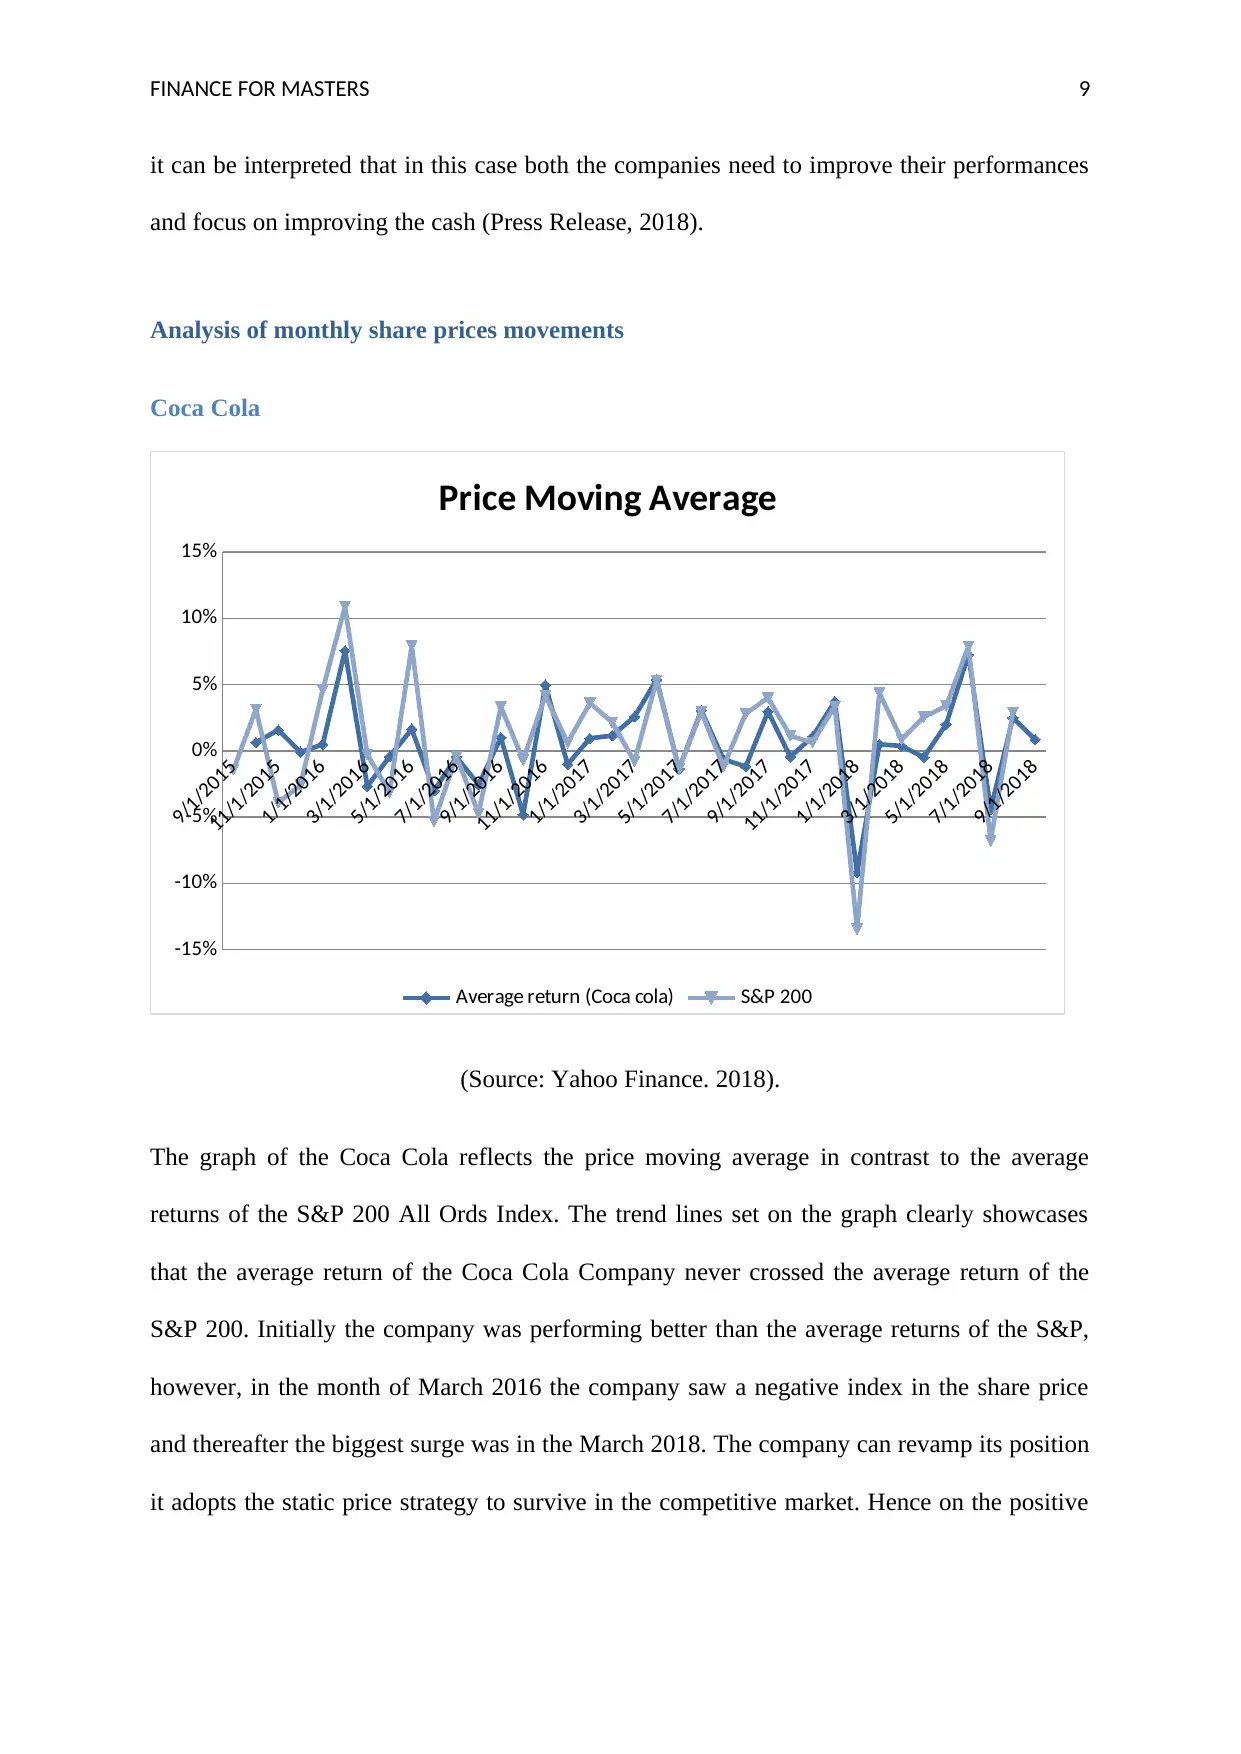
Analysis of monthly share prices movements
Coca Cola
9/1/2015
11/1/2015
1/1/2016
3/1/2016
5/1/2016
7/1/2016
9/1/2016
11/1/2016
1/1/2017
3/1/2017
5/1/2017
7/1/2017
9/1/2017
11/1/2017
1/1/2018
3/1/2018
5/1/2018
7/1/2018
9/1/2018
-15%
-10%
-5%
0%
5%
10%
15%
Price Moving Average
Average return (Coca cola) S&P 200
(Source: Yahoo Finance. 2018).
The graph of the Coca Cola reflects the price moving average in contrast to the average
returns of the S&P 200 All Ords Index. The trend lines set on the graph clearly showcases
that the average return of the Coca Cola Company never crossed the average return of the
S&P 200. Initially the company was performing better than the average returns of the S&P,
however, in the month of March 2016 the company saw a negative index in the share price
and thereafter the biggest surge was in the March 2018. The company can revamp its position
it adopts the static price strategy to survive in the competitive market. Hence on the positive
it can be interpreted that in this case both the companies need to improve their performances
and focus on improving the cash (Press Release, 2018).
Analysis of monthly share prices movements
Coca Cola
9/1/2015
11/1/2015
1/1/2016
3/1/2016
5/1/2016
7/1/2016
9/1/2016
11/1/2016
1/1/2017
3/1/2017
5/1/2017
7/1/2017
9/1/2017
11/1/2017
1/1/2018
3/1/2018
5/1/2018
7/1/2018
9/1/2018
-15%
-10%
-5%
0%
5%
10%
15%
Price Moving Average
Average return (Coca cola) S&P 200
(Source: Yahoo Finance. 2018).
The graph of the Coca Cola reflects the price moving average in contrast to the average
returns of the S&P 200 All Ords Index. The trend lines set on the graph clearly showcases
that the average return of the Coca Cola Company never crossed the average return of the
S&P 200. Initially the company was performing better than the average returns of the S&P,
however, in the month of March 2016 the company saw a negative index in the share price
and thereafter the biggest surge was in the March 2018. The company can revamp its position
it adopts the static price strategy to survive in the competitive market. Hence on the positive
Paraphrase This Document
Need a fresh take? Get an instant paraphrase of this document with our AI Paraphraser
FINANCE FOR MASTERS 10
outlook it can be concluded that the company needs to work on the price movements and the
prices are directly proportional in this case.
Dominos
9/1/2015
11/1/2015
1/1/2016
3/1/2016
5/1/2016
7/1/2016
9/1/2016
11/1/2016
1/1/2017
3/1/2017
5/1/2017
7/1/2017
9/1/2017
11/1/2017
1/1/2018
3/1/2018
5/1/2018
7/1/2018
9/1/2018
-15%
-10%
-5%
0%
5%
10%
15%
20%
25%
Price Moving Calculations
S&P 200 Average return (Dominoz)
(Source: Yahoo Finance. 2018).
In the graph above it can be observed that the S&P 200 is low in case of the average return of
the Dominos. Therefore it can be interpreted that the company performed outstandingly and
in the consistent manner. Whenever the company’s share saw a surge or the fall it comes up
with the rapturous effort and sets the new targets. For example in January 2016 the company
saw a drastic fall of 5% and it recovered and reached till 20% in the month of May in the
same year (Bowman, 2016).
Henceforth, it can be stated that the price movements of the Dominos is likely not dependent
or associated with the market performance. Rather it is facing fluctuations due to its own
factors.
FINANCE FOR MASTERS 11
Significant factors which may have influenced the share price
Coca Cola
The factors that are responsible for influencing the price of the shares in case of the Coca
Cola Company are outlined below.
The plan to create a brand and promote the sales growth are the early promises made by the
company under which there was a recent campaign named “ Share a Coke” which not only
supported the brand value of the Coca Cola sales but also managed to accelerate the sales by
3% worldwide in the second quarter.
Beverages are on the rise and therefore the Coca Cola’s non sparkling beverage volume
increased by 6% in the first two quarters of the 2016 financial year (Arnols, 2017).
Dominos
The Dominos has recently been opening the nine outlets a month and has 777 shops
extravagantly. The total sales went up due to the 16% rise in the volume of the sales. The
product has been revamped with different flavours and the company reformulated the recipe
of the pizza and there is all together a different concept now.
The company has created the Dominos tracker with the assistance of which the customers can
track the order right from the oven till their doorstep. This concept of the enhanced
technology not only helped to boost the sales in the Dominos but also levelled it by more than
50% through the online platforms itself (Bowman, 2016).
Beta values and expected Rates of Return
The beta values of the Coca Cola and the Dominos is 0.48 and the -0.10 respectively.
CAPM MODEL Coca Cola CAPM MODEL Dominos
⊘ This is a preview!⊘
Do you want full access?
Subscribe today to unlock all pages.
Trusted by 1+ million students worldwide
1 out of 16
Related Documents


Your All-in-One AI-Powered Toolkit for Academic Success.
+13062052269
info@desklib.com
Available 24*7 on WhatsApp / Email
![[object Object]](/_next/static/media/star-bottom.7253800d.svg)
Unlock your academic potential
Copyright © 2020–2026 A2Z Services. All Rights Reserved. Developed and managed by ZUCOL.