Pearson BTEC Level 5 HND Business Decision Making Task 3.3 Report
VerifiedAdded on 2023/04/04
|19
|768
|458
Report
AI Summary
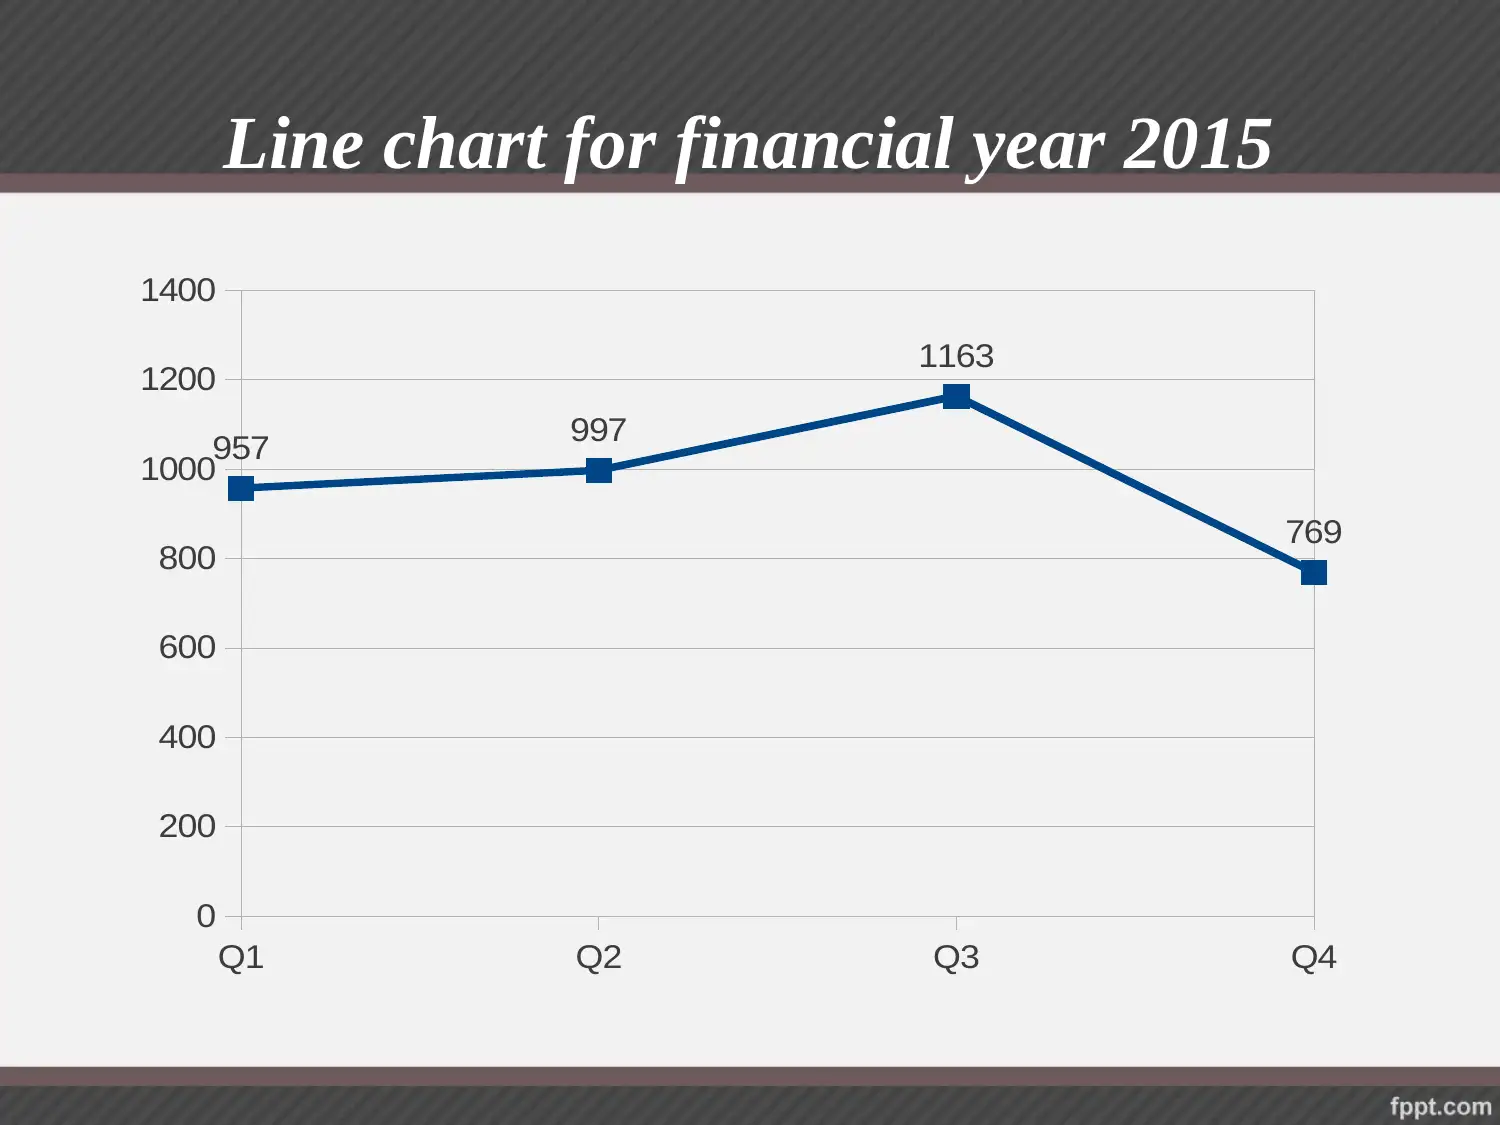
This report presents a comprehensive analysis of a business decision-making task, focusing on financial data visualization and interpretation. The assignment includes various charts, such as pie charts, bar charts, line charts, histograms, and ogive charts, to illustrate sales, revenue, and cus...
Read More
Contribute Materials
Your contribution can guide someone’s learning journey. Share your
documents today.

BUSINESS DECISION
MAKING
TASK 3.3
MAKING
TASK 3.3
Secure Best Marks with AI Grader
Need help grading? Try our AI Grader for instant feedback on your assignments.

Pie Chart For Financial Year 2014
931
959
1104
713
Q1
Q2
Q3
Q4
931
959
1104
713
Q1
Q2
Q3
Q4

Pie Chart For Financial Year 2015
Q1
Q2
Q3
Q4
957
997
1163
769
Q1
Q2
Q3
Q4
957
997
1163
769

Pie Chart For Financial Year 2016
Q1
Q2
Q3
Q4
1008
1035
1189
811
Q1
Q2
Q3
Q4
1008
1035
1189
811
Secure Best Marks with AI Grader
Need help grading? Try our AI Grader for instant feedback on your assignments.

Bar chart for financial year 2014
Q1
Q2
Q3
Q4
0 200 400 600 800 1000 1200
931
959
1104
713
Q1
Q2
Q3
Q4
0 200 400 600 800 1000 1200
931
959
1104
713

Bar chart for financial year 2015
Q1
Q2
Q3
Q4
0 200 400 600 800 1000 1200 1400
957
997
1163
769
Q1
Q2
Q3
Q4
0 200 400 600 800 1000 1200 1400
957
997
1163
769

Bar chart for financial year 2016
Q1
Q2
Q3
Q4
0 200 400 600 800 1000 1200 1400
1008
1035
1189
811
Q1
Q2
Q3
Q4
0 200 400 600 800 1000 1200 1400
1008
1035
1189
811
Paraphrase This Document
Need a fresh take? Get an instant paraphrase of this document with our AI Paraphraser

Line chart for financial year 2014
Q1 Q2 Q3 Q4
0
200
400
600
800
1000
1200
931 959
1104
713
Q1 Q2 Q3 Q4
0
200
400
600
800
1000
1200
931 959
1104
713

Line chart for financial year 2015
Q1 Q2 Q3 Q4
0
200
400
600
800
1000
1200
1400
957 997
1163
769
Q1 Q2 Q3 Q4
0
200
400
600
800
1000
1200
1400
957 997
1163
769

Line chart for financial year 2016
Q1 Q2 Q3 Q4
0
200
400
600
800
1000
1200
1400
1008 1035
1189
811
Q1 Q2 Q3 Q4
0
200
400
600
800
1000
1200
1400
1008 1035
1189
811
Secure Best Marks with AI Grader
Need help grading? Try our AI Grader for instant feedback on your assignments.

Ages of customers of the tour company
Under 20 20 but under 30 30 but under 40 40 but under 50 50 but under 60 60 but under 70 70 or over
0
5
10
15
20
25
Ages of customers of Tour company
Ages
Number of customers
Under 20 20 but under 30 30 but under 40 40 but under 50 50 but under 60 60 but under 70 70 or over
0
5
10
15
20
25
Ages of customers of Tour company
Ages
Number of customers

Histogram of ages of customers of the tour company
Under 20 20 but under 30 30 but under 40 40 but under 50 50 but under 60 60 but under 70 70 or over
0
5
10
15
20
25
Histogram of ages of customers of Tour company
Ages
Number of customers
Under 20 20 but under 30 30 but under 40 40 but under 50 50 but under 60 60 but under 70 70 or over
0
5
10
15
20
25
Histogram of ages of customers of Tour company
Ages
Number of customers

Ogive chart of ages of customers of the tour company
30/12/1899 Under 20 20 but under 30 30 but under 40 40 but under 50 50 but under 60 60 but under 70 70 or over
0%
25%
50%
75%
100%
Ogive of ages of customers
Ages
Frequency (%)
30/12/1899 Under 20 20 but under 30 30 but under 40 40 but under 50 50 but under 60 60 but under 70 70 or over
0%
25%
50%
75%
100%
Ogive of ages of customers
Ages
Frequency (%)
Paraphrase This Document
Need a fresh take? Get an instant paraphrase of this document with our AI Paraphraser

INTERPRETATION
All the above charts like as pie, line as well as bar
graphs shows the level of sales and revenue generated by the
tour destinations at each four quarters.
Further, amount of the sales is to be analysed at year for the
3 years which is such as from FY 2014 to FY 2016.
It can be interpreted after considering the entire above
presented graph that in every year the sales of all tour
products increases from the quarter one (Q1) to the quarter
three (Q3).
Further, after Q3 sales reduces in each and every year because
of seasonality as well as weak strategies.

Contd….
It has been found that in the year 2014 its performance is very
low as compare to the other years.
Apart from this at the end of FY 2015 and 2016 performance in
terms of generates revenue is good because in such both
periods there is very little and minor difference.
From the Histogram it can be analysed that when tourists
are of the increasing age then number of customers enhances
on consistent basis.
Apart from this, as ages of the customers decline then less
number of tourists take interest for go on the tour.

Trend line for South America
Q1 Q2 Q3 Q4 Q1 Q2 Q3 Q4 Q1 Q2 Q3 Q4 Q1 Q2 Q3 Q4 Q1 Q2 Q3
2 0 1 4 2 0 1 5 2 0 1 6 2 0 1 7 2 0 1 8
0
5
1 0
1 5
2 0
2 5
3 0
3 5
4 0
Q1 Q2 Q3 Q4 Q1 Q2 Q3 Q4 Q1 Q2 Q3 Q4 Q1 Q2 Q3 Q4 Q1 Q2 Q3
2 0 1 4 2 0 1 5 2 0 1 6 2 0 1 7 2 0 1 8
0
5
1 0
1 5
2 0
2 5
3 0
3 5
4 0
Secure Best Marks with AI Grader
Need help grading? Try our AI Grader for instant feedback on your assignments.

INTERPRETATION
The line which shows that in the upcoming year the
company such as tour business will be in profitable or non
profitable situation is identified as trend line.
It can be interpreted from trend lines that in the next fiscal
year such as 2017 the South America destination will be
profitable.
Apart from this at the end of year like 2018 the South
America will generate more sales because the trend line
having increasing trend over the years.
On the basis of present trend line firm needs to focus on
South America destination because it provides positive and
increasing kind of revenue from FY 2014 to 2016.

REFERENCES
Chai, J., Liu, J. N. and Ngai, E. W., 2013. Application of
decision-making techniques in supplier selection: A systematic
review of literature. Expert Systems with Applications. 40(10).
pp. 3872-3885.
Ghattas, J., Soffer, P. and Peleg, M., 2014. Improving business
process decision making based on past experience. Decision
Support Systems. 59. pp. 93-107.
Kerr, Z. Y. and et.al., 2014. National Collegiate Athletic
Association Injury Surveillance System: review of methods
for 2004–2005 through 2013–2014 data collection. Journal of
athletic training. 49(4). pp. 552-560.

THANK YOU
1 out of 19
Related Documents

Your All-in-One AI-Powered Toolkit for Academic Success.
+13062052269
info@desklib.com
Available 24*7 on WhatsApp / Email
Unlock your academic potential
© 2024 | Zucol Services PVT LTD | All rights reserved.