Principles of Financial Markets Group Assignment Report - Analysis
VerifiedAdded on 2023/06/07
|15
|3073
|390
Report
AI Summary
This report provides a comprehensive fundamental analysis of the Australian banking sector, focusing on the impact of macroeconomic and microeconomic factors on the performance of Westpac Banking Corporation and Australia and New Zealand Banking Group (ANZ). The analysis employs a top-down approach, examining the influence of interest rates, inflation, the value of the Australian dollar, the business cycle, and GDP growth on the banking companies. Furthermore, a bottom-up analysis is conducted, utilizing ratio analysis to evaluate the financial performance of the selected banks, assessing their profitability, liquidity, solvency, and market potential. The report explores the current economic environment in Australia, including the Reserve Bank of Australia's (RBA) monetary policies and their effects on the banking sector. It also provides insights into the future threats and opportunities for the banking sector, considering factors such as the weakening Australian dollar and the ongoing economic cycle, and discusses the forecasted performance of Westpac and ANZ. The report's structure includes an executive summary, introduction, detailed analyses, and a conclusion, providing a well-rounded view of the financial markets.
1
Principals of Financial Markets Group Assignment
Principals of Financial Markets Group Assignment
Paraphrase This Document
Need a fresh take? Get an instant paraphrase of this document with our AI Paraphraser
2
Executive Summary
The report has been carried out for gaining an understanding of the impact of macro and
micro economic factors on the performance of the banking companies within Australia. In this
context, the use of top-down analysis is done for examining the impact of factors such as interest
rate, inflation rate, value of $AUD, business cycle and the GDP growth rate within the country
that have an impact on banking companies’ performance. On the other hand, bottom-up analysis
has analyzed the company specific factors with the use of ratio analysis technique that helps in
evaluation of the financial performance of the selected banking corporations. They both are a
part of fundamental analysis that is used for developing an understanding of the behavior of
market and economic changes that influences the share prices of the companies in context. It has
depicted the changes in the economic policies and their influence on the performance of the
banking sector performance. The financial performance analysis has also resulted in identifying
the future threats and opportunities for the banking sector that can impact the growth and
development of the financial service companies.
3
Contents
Executive Summary.........................................................................................................................2
Introduction......................................................................................................................................4
Top-down Analysis..........................................................................................................................4
Bottom up Analysis.........................................................................................................................8
Conclusion.....................................................................................................................................13
References......................................................................................................................................14
⊘ This is a preview!⊘
Do you want full access?
Subscribe today to unlock all pages.
Trusted by 1+ million students worldwide
4
Introduction
This report has been developed for undertaking a fundamental analysis of two ASX listed
companies that are operating within the same industry. Fundamental analysis can be described as
a method used by the investors for analyzing the macro and micro economic factors impacting
the performance of a company. It consists of the use of top-down and bottom-up analysis to gain
an analysis of the economic and company specific factors that can impact its performance in the
future context. Top down analysis begins with examining the macro-economic factors that can
have an impact on the future performance of a company in context. This is followed by bottom-
up analysis that is carried out to gain an insight into the current financial condition of a company
to compare it with industry performance. In this context, the company selected for analysis
purpose is Westpac Banking Corporation and Australia (ANZ) operating within the banking
industry of Australia.
Top-down Analysis
The analysis is carried out for examining the macro-economic factors such as interest
rate, current value of currency, GDP growth rate, inflation rate and the type of business cycle in
which the economy is operating. This has been carried out as follows for determining the impact
of economic environment within Australia on the performances of the selected banking
corporations.
Current Interest Rate
The Reserve Bank of Australia (RBA) has kept the interest rate within the country steady
up to 1.5 per cent since the past two years. The move of the RBA is supported by the intention of
Paraphrase This Document
Need a fresh take? Get an instant paraphrase of this document with our AI Paraphraser
5
reducing the unemployment and keeping the inflation low within the country. This has been done
by the RBA with the intention of continuing the economy growth by reducing the cost of
borrowing and weakening the Australian dollar to keep the exchange rate to be low. This is
because the lower interest rates would lead to a decline in the cash inflows from foreign
investment causing a decrease in the rate of exchange. The reduction in the cost of borrowing
would help the borrowers to repay the debt more quickly. The interest rates are expected to
remain low to the current level as RBA intends to attain financial stability and stimulating the
economic growth of the country (Verrender, 2017). The expected forecast of the interest rate
within Australia can be depicted as follows:
(Source: https://www.marketindex.com.au/rba-cash-rate)
Value of Australian Dollar
The value of $AUD is on decline and is currently recorded as low as about 72 US cents
and it is expected to further decrease in the value over the coming period. This is due to decline
in spending power of consumers that is causing a negative impact on industrial growth. In
addition to this, the rising unemployment within the country is expected to cause slower growth
6
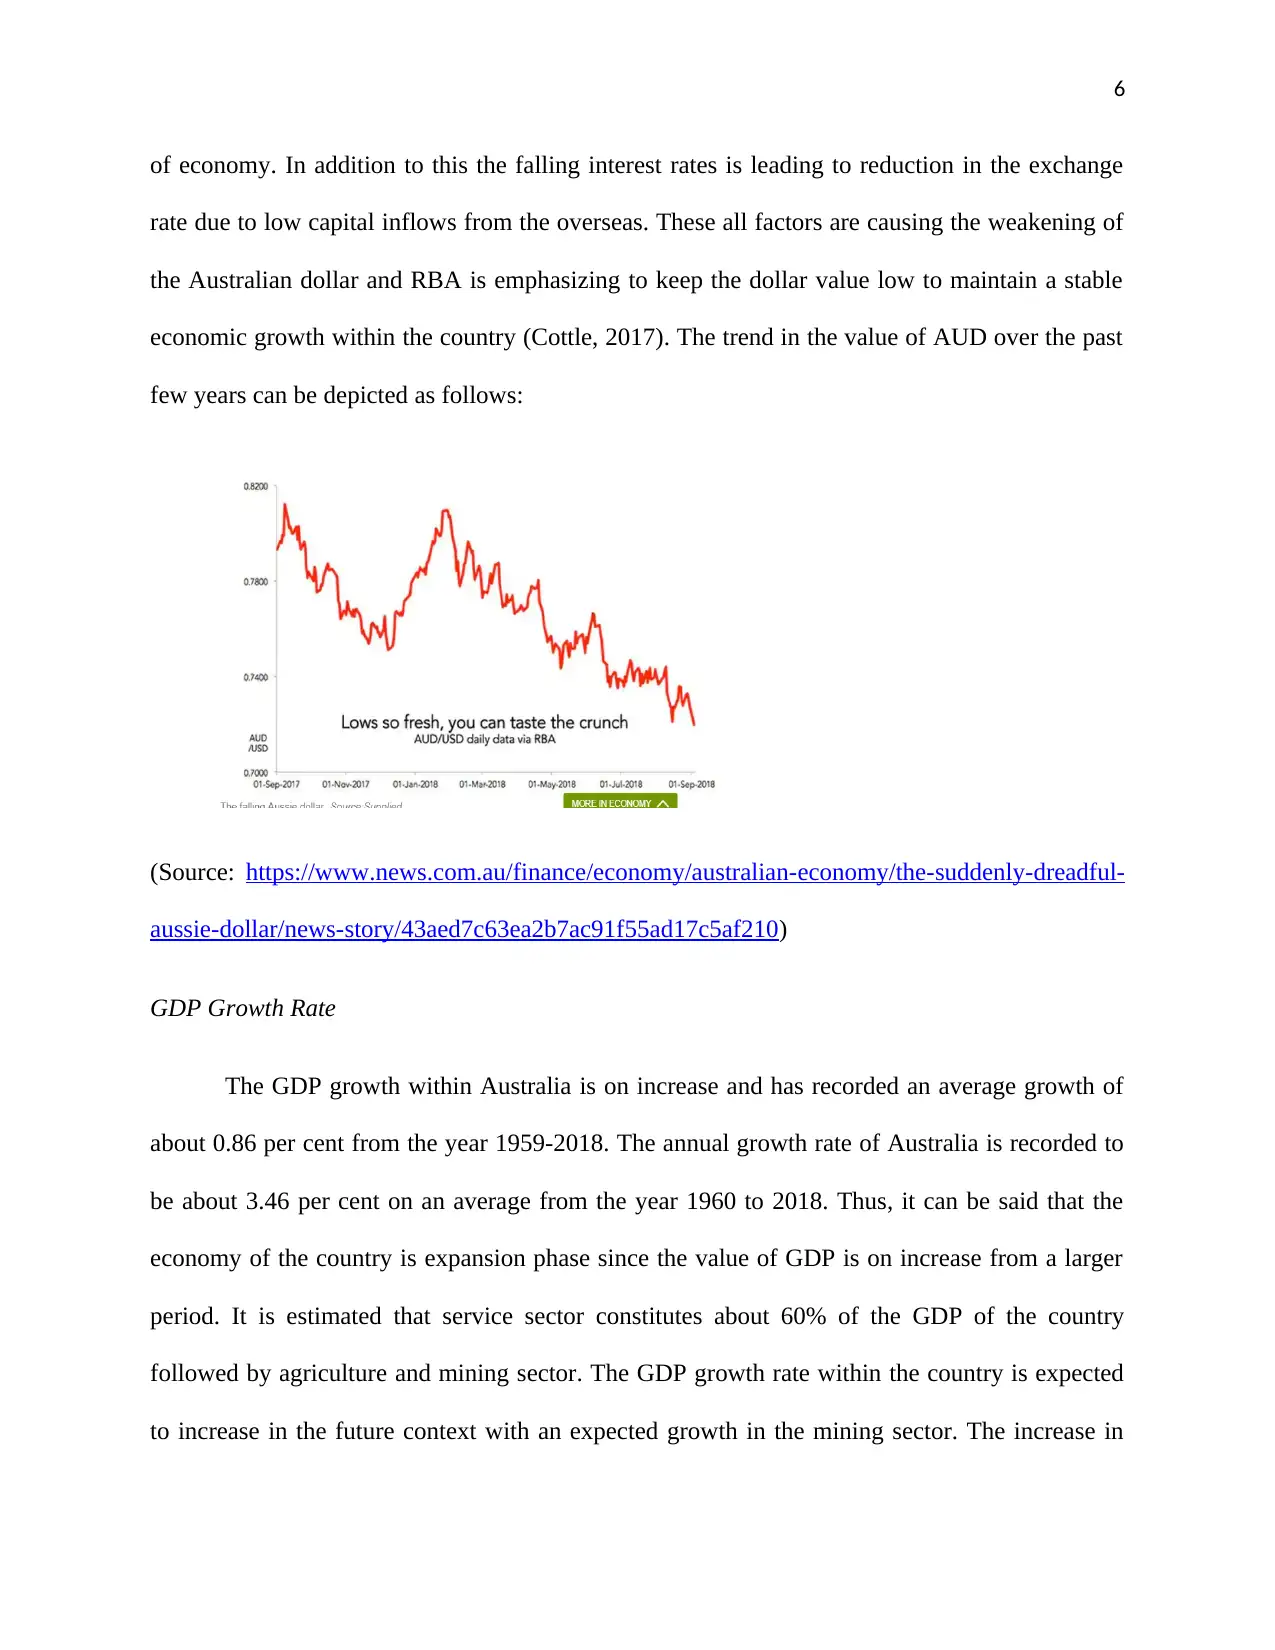
of economy. In addition to this the falling interest rates is leading to reduction in the exchange
rate due to low capital inflows from the overseas. These all factors are causing the weakening of
the Australian dollar and RBA is emphasizing to keep the dollar value low to maintain a stable
economic growth within the country (Cottle, 2017). The trend in the value of AUD over the past
few years can be depicted as follows:
(Source: https://www.news.com.au/finance/economy/australian-economy/the-suddenly-dreadful-
aussie-dollar/news-story/43aed7c63ea2b7ac91f55ad17c5af210)
GDP Growth Rate
The GDP growth within Australia is on increase and has recorded an average growth of
about 0.86 per cent from the year 1959-2018. The annual growth rate of Australia is recorded to
be about 3.46 per cent on an average from the year 1960 to 2018. Thus, it can be said that the
economy of the country is expansion phase since the value of GDP is on increase from a larger
period. It is estimated that service sector constitutes about 60% of the GDP of the country
followed by agriculture and mining sector. The GDP growth rate within the country is expected
to increase in the future context with an expected growth in the mining sector. The increase in
⊘ This is a preview!⊘
Do you want full access?
Subscribe today to unlock all pages.
Trusted by 1+ million students worldwide
7
the net exports from the country due to growth in mining sector is expected to cause a large
increase in the GDP growth rate of the country. The economy of Australia is growing at a rapid
rate and thus the economy is regarded in a positive phase of development for supporting
industrial growth (Trading Economics, 2018).
Current Inflation Rate
The inflation rate within Australia is also maintained at a lower rate to about 2 per cent
by the end of this quarter of the year 2018. The main reason for the decline in the house prices is
mainly due to the slower growth realized in the housing and transport sector. However, it has
recently realized a slower growth in the second quarter of the year 2018 as compared to that of
previous year of 1.9 per cent. The increase in the consumer prices for cost of transport, alcohol,
tobacco, education and financial service sector has caused an increase in the inflation rate within
the country (Central Banks, 2018).
Economy Cycle
Australia is presently in a state of developing phase of economic growth and
development. This is because large growth realized in its service and mining sector that are
contributing to larger revenue realization for supporting the economic growth. It is also having
an open trade and investment policy that is responsible for promoting the export of mining
commodities to overseas resulting in large amount of cash inflows. The country is also having a
strong fiscal policy that is responsible for maintaining a fixed level of tax rate charged to the
corporate. The financial stability within the country is further supporting the growth and
development within the industrial sector is causing capital inflows within the country.
Forecasted Performance of the Selected Banking Corporations
Paraphrase This Document
Need a fresh take? Get an instant paraphrase of this document with our AI Paraphraser
8
The banking industry of Australia because of the recent economic changes has depicted
major changes. The presence of open trade and investment policies is causing the inflow of
foreign investment and there has been increase in the shareholders of the banks. The deregulation
of the financial service sector is also facilitating large help and growth for promoting their
development by collaboration with the other business entities across the world. The lower
interest rate maintained by RBA has promoted deposits acceptance by the banks due to low cost
of borrowing on the loans. The weakening Australian dollar is also leading to capital inflows into
the banks by causing a reduction in the amount of collateral required to post on cross-currency
swaps for hedging offshore bond issues. The lower interest rates are promoting credit growth and
causing the consumers to seek high-yielding alternatives to deposits. The low inflation rate is
supporting the spending power of consumers and therefore leading to the support and growth of
the banking sector. The positive cycle of economy supported by increasing GDP growth rate is
also promoting the growth of the banking sector. Thus, it can be said that with the macro-
economic environment of Australia is presenting major opportunities to the banking companies
such as Westpac and ANZ to develop various strategies for promoting the value of their
business. Also, with a forecasted positive state of economic growth and financial stability to be
maintained within the country it is estimated that banking companies will depict a higher growth
in the future context (Central Banks, 2018).
Bottom up Analysis
This section has undertaken a bottom-up analysis for the two banking companies
selected. The bottom-up analysis has been used for evaluation of the micro-economic factors
impacting the share prices movements of both the companies. This has been carried out by
gaining an analysis into the current financial performance of the banking corporations through
9
the use of technique of ratio analysis. The ratio analysis presents a comparative analysis of the
performance of the banking companies by examining their profitability, liquidity, solvency and
market potential (Chan-Lau, 2017).
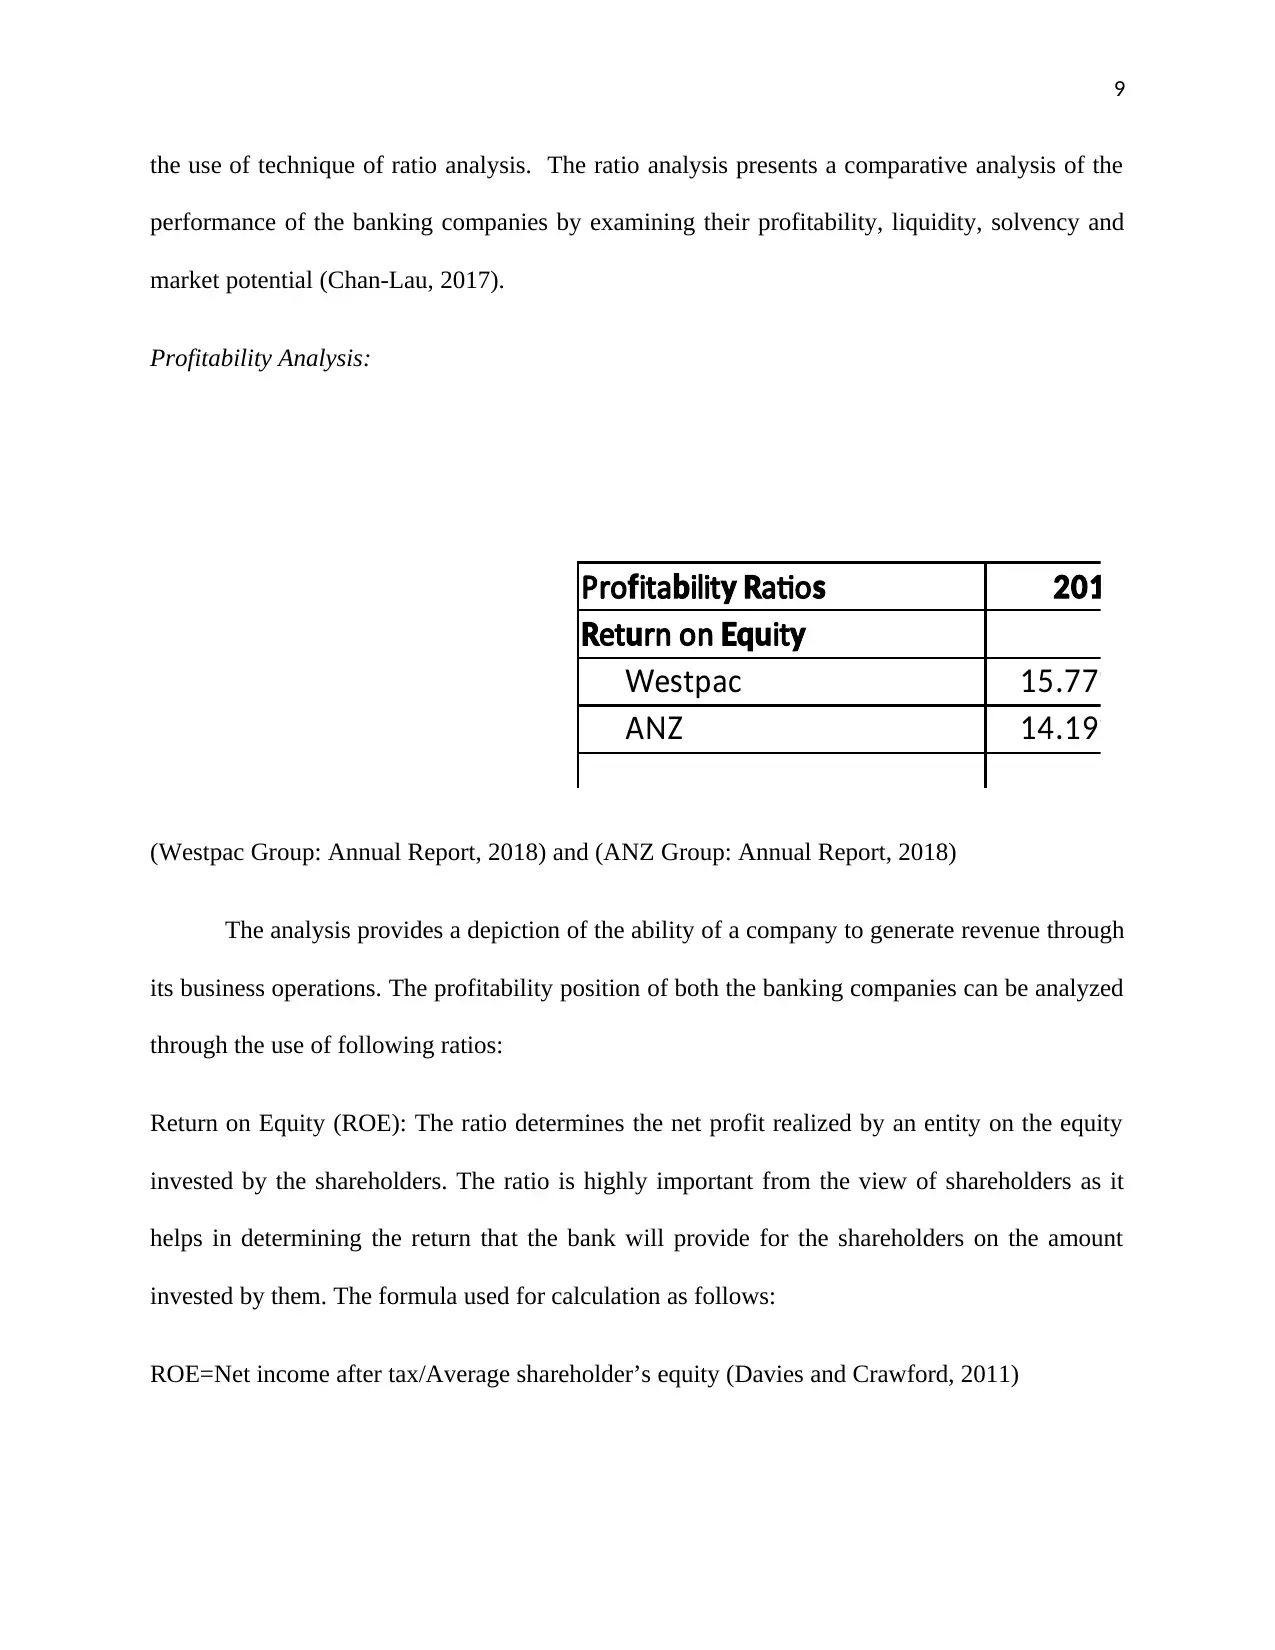
Profitability Analysis:
Pro ita ilit atiof b y R s 2015
et rn on itR u Equ y
e tpacW s 15.77%
ANZ 14.19%
(Westpac Group: Annual Report, 2018) and (ANZ Group: Annual Report, 2018)
The analysis provides a depiction of the ability of a company to generate revenue through
its business operations. The profitability position of both the banking companies can be analyzed
through the use of following ratios:
Return on Equity (ROE): The ratio determines the net profit realized by an entity on the equity
invested by the shareholders. The ratio is highly important from the view of shareholders as it
helps in determining the return that the bank will provide for the shareholders on the amount
invested by them. The formula used for calculation as follows:
ROE=Net income after tax/Average shareholder’s equity (Davies and Crawford, 2011)
the use of technique of ratio analysis. The ratio analysis presents a comparative analysis of the
performance of the banking companies by examining their profitability, liquidity, solvency and
market potential (Chan-Lau, 2017).
Profitability Analysis:
Pro ita ilit atiof b y R s 2015
et rn on itR u Equ y
e tpacW s 15.77%
ANZ 14.19%
(Westpac Group: Annual Report, 2018) and (ANZ Group: Annual Report, 2018)
The analysis provides a depiction of the ability of a company to generate revenue through
its business operations. The profitability position of both the banking companies can be analyzed
through the use of following ratios:
Return on Equity (ROE): The ratio determines the net profit realized by an entity on the equity
invested by the shareholders. The ratio is highly important from the view of shareholders as it
helps in determining the return that the bank will provide for the shareholders on the amount
invested by them. The formula used for calculation as follows:
ROE=Net income after tax/Average shareholder’s equity (Davies and Crawford, 2011)
⊘ This is a preview!⊘
Do you want full access?
Subscribe today to unlock all pages.
Trusted by 1+ million students worldwide
10
It can be stated from the comparison of the ratio for both the banks that Westpac is able
to successfully utilize its equity resources for creating return for the shareholders in comparison
to that of ANZ. However, both the banks have reported a decreasing trend on their ROE which
states that their ability to create returns for the shareholders is decreasing over the past there
years. This can be due to decline in the value of AUD and slower growth in the housing market
impacting the net profit generated by the banks.
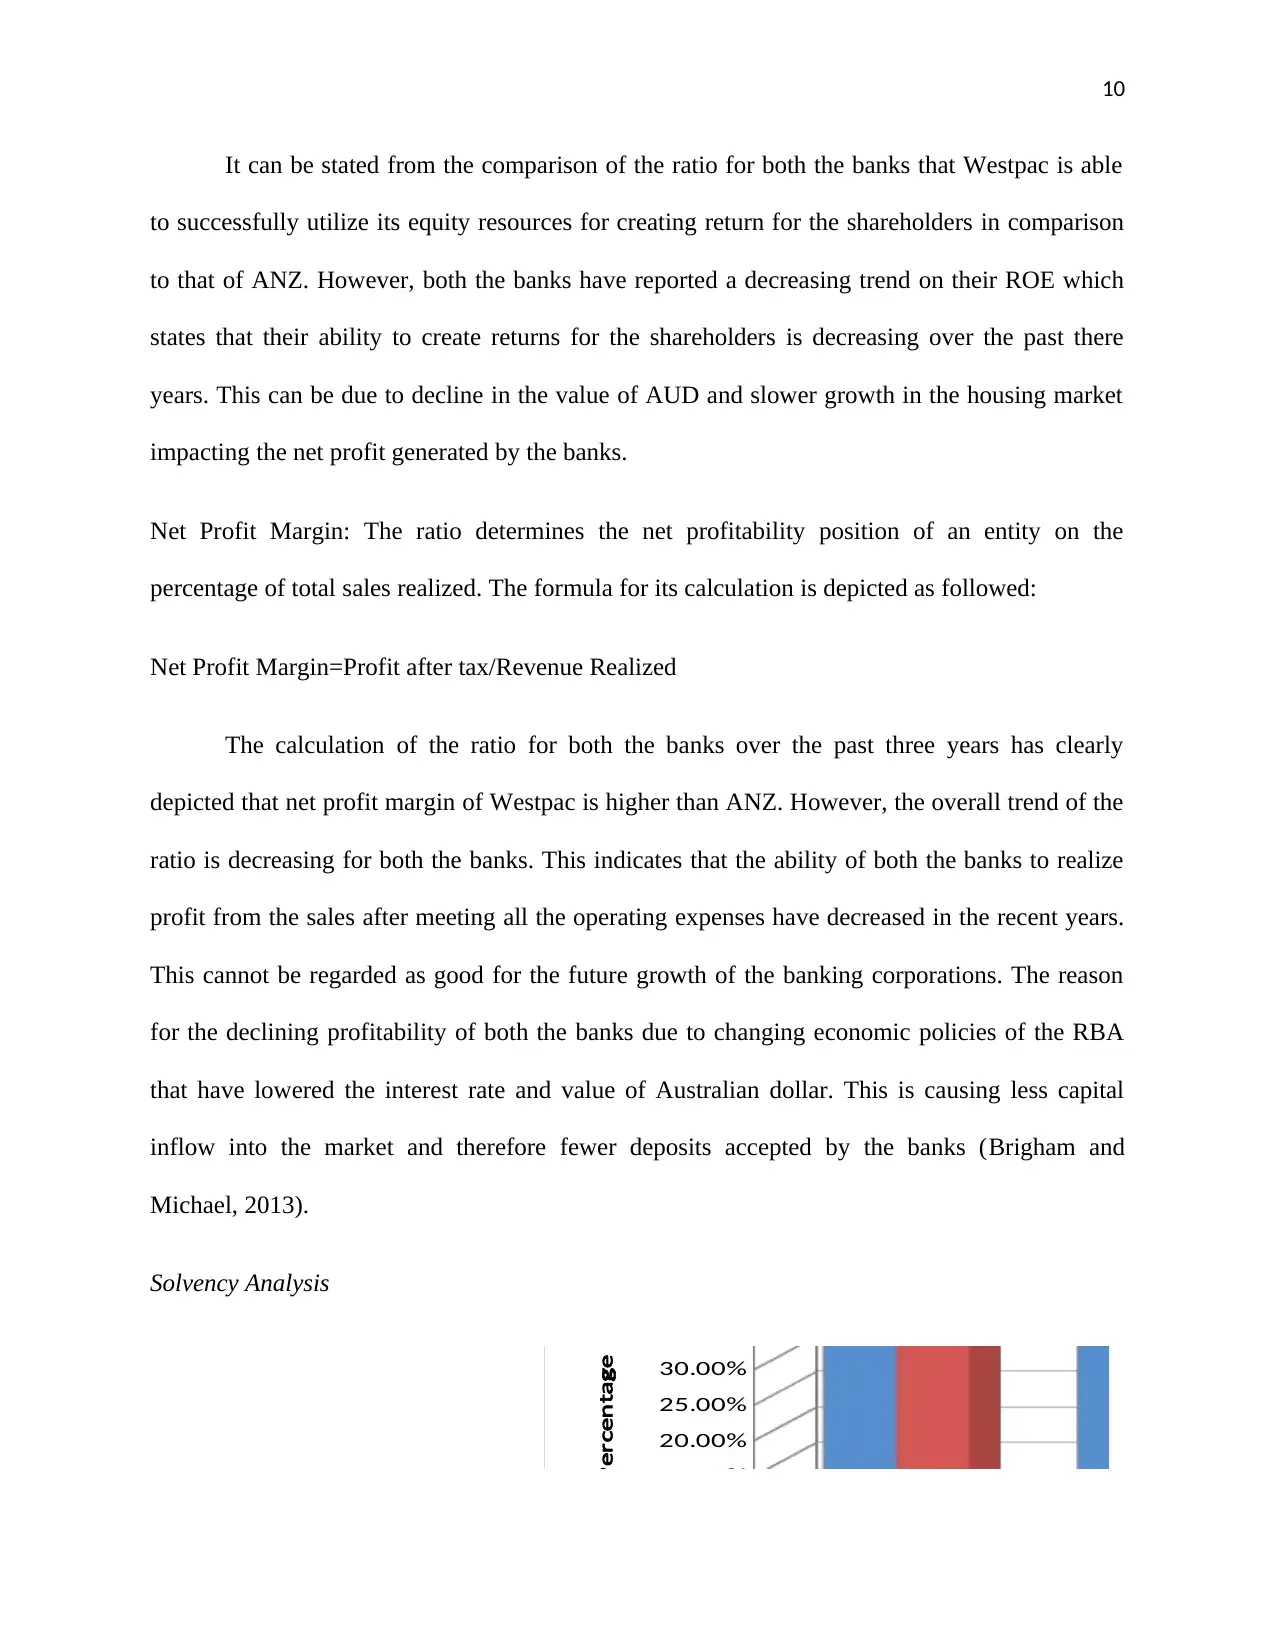
Net Profit Margin: The ratio determines the net profitability position of an entity on the
percentage of total sales realized. The formula for its calculation is depicted as followed:
Net Profit Margin=Profit after tax/Revenue Realized
The calculation of the ratio for both the banks over the past three years has clearly
depicted that net profit margin of Westpac is higher than ANZ. However, the overall trend of the
ratio is decreasing for both the banks. This indicates that the ability of both the banks to realize
profit from the sales after meeting all the operating expenses have decreased in the recent years.
This cannot be regarded as good for the future growth of the banking corporations. The reason
for the declining profitability of both the banks due to changing economic policies of the RBA
that have lowered the interest rate and value of Australian dollar. This is causing less capital
inflow into the market and therefore fewer deposits accepted by the banks (Brigham and
Michael, 2013).
Solvency Analysis
2015 2016
0.00%
5.00%
10.00%
15.00%
20.00%
25.00%
30.00%
35.00%
40.00%
et pro it Mar inN f g
Percenta eg
It can be stated from the comparison of the ratio for both the banks that Westpac is able
to successfully utilize its equity resources for creating return for the shareholders in comparison
to that of ANZ. However, both the banks have reported a decreasing trend on their ROE which
states that their ability to create returns for the shareholders is decreasing over the past there
years. This can be due to decline in the value of AUD and slower growth in the housing market
impacting the net profit generated by the banks.
Net Profit Margin: The ratio determines the net profitability position of an entity on the
percentage of total sales realized. The formula for its calculation is depicted as followed:
Net Profit Margin=Profit after tax/Revenue Realized
The calculation of the ratio for both the banks over the past three years has clearly
depicted that net profit margin of Westpac is higher than ANZ. However, the overall trend of the
ratio is decreasing for both the banks. This indicates that the ability of both the banks to realize
profit from the sales after meeting all the operating expenses have decreased in the recent years.
This cannot be regarded as good for the future growth of the banking corporations. The reason
for the declining profitability of both the banks due to changing economic policies of the RBA
that have lowered the interest rate and value of Australian dollar. This is causing less capital
inflow into the market and therefore fewer deposits accepted by the banks (Brigham and
Michael, 2013).
Solvency Analysis
2015 2016
0.00%
5.00%
10.00%
15.00%
20.00%
25.00%
30.00%
35.00%
40.00%
et pro it Mar inN f g
Percenta eg
Paraphrase This Document
Need a fresh take? Get an instant paraphrase of this document with our AI Paraphraser
11
(Westpac Group: Annual Report, 2018) and (ANZ Group: Annual Report, 2018)
The analysis helps in examining the ability of a company to meet the short as well as
long-term obligations. The ratio that can be used for analyzing the solvency position of both the
banks can be depicted as follows:
Debt to Equity Ratio: The ratio determines the portion of debt and equity used by an entity. It
can be calculated with the use of following formula:
Debt to Equity Ratio=Debt/Equity
It can be said from analyzing the debt-equity ratio’s trend of both the banks over the past
three financial years that Westpac is adopting more use of debt in its capital structure as
compared to that of ANZ. However, the debt-equity ratios of both the banks are decreasing
which means that banks are adopting less use of debt in their capital structure. This indicates that
banks are emphasizing on lowering the financial leverage on them and thus reducing the
financial risk of insolvency.
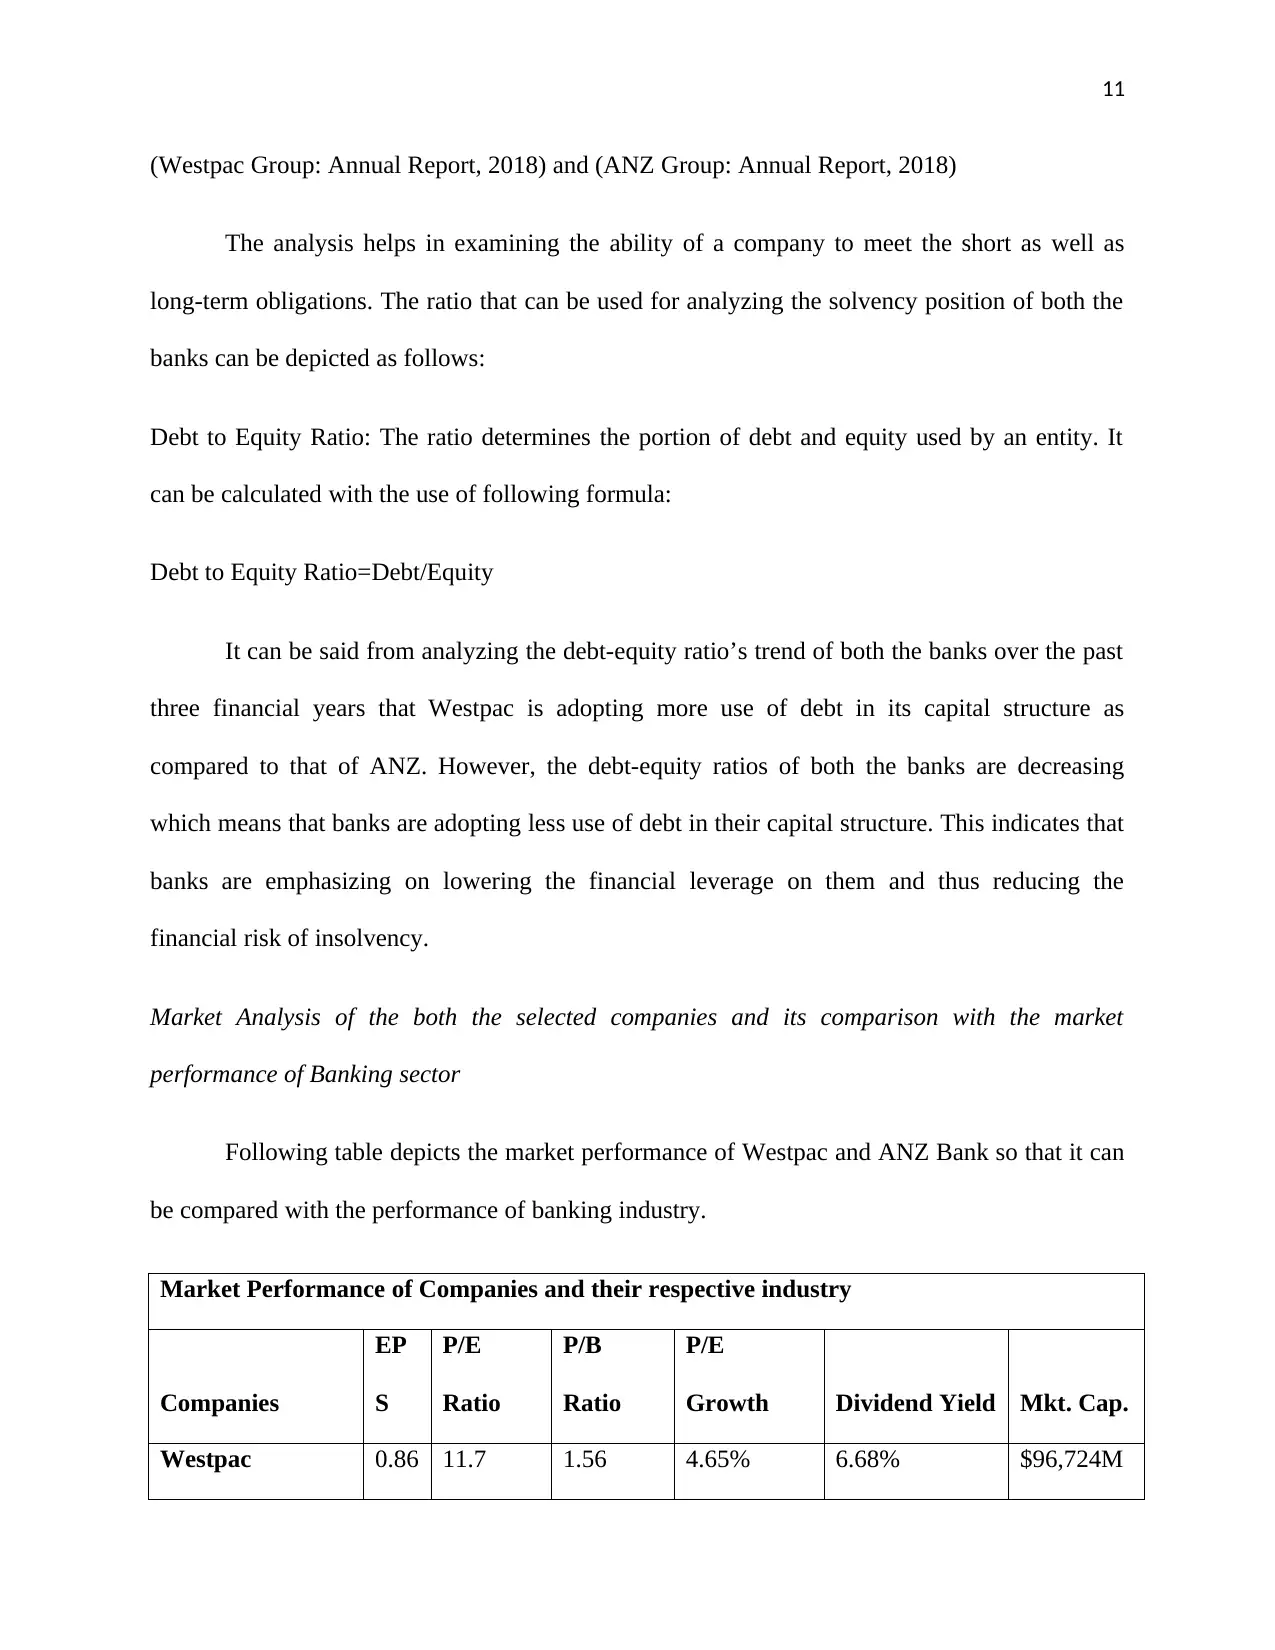
Market Analysis of the both the selected companies and its comparison with the market
performance of Banking sector
Following table depicts the market performance of Westpac and ANZ Bank so that it can
be compared with the performance of banking industry.
Market Performance of Companies and their respective industry
Companies
EP
S
P/E
Ratio
P/B
Ratio
P/E
Growth Dividend Yield Mkt. Cap.
Westpac 0.86 11.7 1.56 4.65% 6.68% $96,724M
(Westpac Group: Annual Report, 2018) and (ANZ Group: Annual Report, 2018)
The analysis helps in examining the ability of a company to meet the short as well as
long-term obligations. The ratio that can be used for analyzing the solvency position of both the
banks can be depicted as follows:
Debt to Equity Ratio: The ratio determines the portion of debt and equity used by an entity. It
can be calculated with the use of following formula:
Debt to Equity Ratio=Debt/Equity
It can be said from analyzing the debt-equity ratio’s trend of both the banks over the past
three financial years that Westpac is adopting more use of debt in its capital structure as
compared to that of ANZ. However, the debt-equity ratios of both the banks are decreasing
which means that banks are adopting less use of debt in their capital structure. This indicates that
banks are emphasizing on lowering the financial leverage on them and thus reducing the
financial risk of insolvency.
Market Analysis of the both the selected companies and its comparison with the market
performance of Banking sector
Following table depicts the market performance of Westpac and ANZ Bank so that it can
be compared with the performance of banking industry.
Market Performance of Companies and their respective industry
Companies
EP
S
P/E
Ratio
P/B
Ratio
P/E
Growth Dividend Yield Mkt. Cap.
Westpac 0.86 11.7 1.56 4.65% 6.68% $96,724M
12
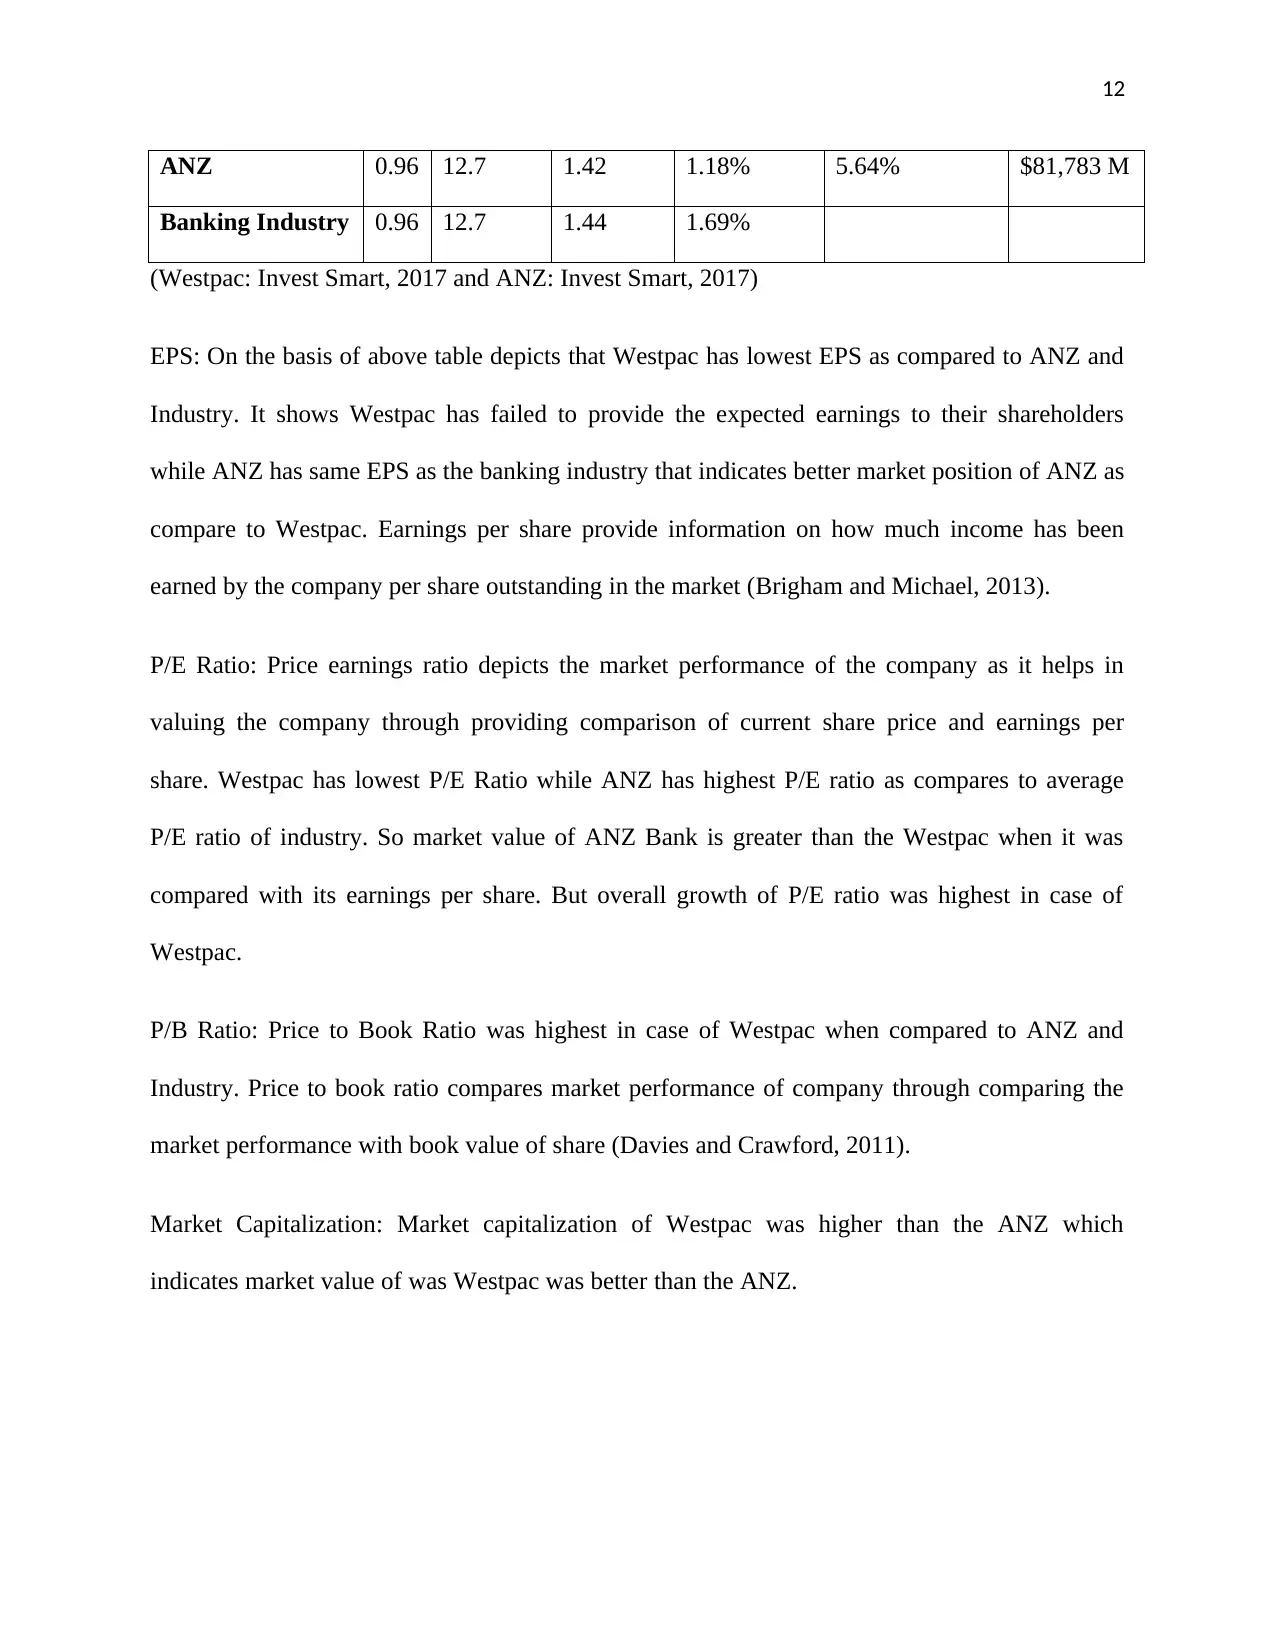
ANZ 0.96 12.7 1.42 1.18% 5.64% $81,783 M
Banking Industry 0.96 12.7 1.44 1.69%
(Westpac: Invest Smart, 2017 and ANZ: Invest Smart, 2017)
EPS: On the basis of above table depicts that Westpac has lowest EPS as compared to ANZ and
Industry. It shows Westpac has failed to provide the expected earnings to their shareholders
while ANZ has same EPS as the banking industry that indicates better market position of ANZ as
compare to Westpac. Earnings per share provide information on how much income has been
earned by the company per share outstanding in the market (Brigham and Michael, 2013).
P/E Ratio: Price earnings ratio depicts the market performance of the company as it helps in
valuing the company through providing comparison of current share price and earnings per
share. Westpac has lowest P/E Ratio while ANZ has highest P/E ratio as compares to average
P/E ratio of industry. So market value of ANZ Bank is greater than the Westpac when it was
compared with its earnings per share. But overall growth of P/E ratio was highest in case of
Westpac.
P/B Ratio: Price to Book Ratio was highest in case of Westpac when compared to ANZ and
Industry. Price to book ratio compares market performance of company through comparing the
market performance with book value of share (Davies and Crawford, 2011).
Market Capitalization: Market capitalization of Westpac was higher than the ANZ which
indicates market value of was Westpac was better than the ANZ.
⊘ This is a preview!⊘
Do you want full access?
Subscribe today to unlock all pages.
Trusted by 1+ million students worldwide
1 out of 15
Related Documents


Your All-in-One AI-Powered Toolkit for Academic Success.
+13062052269
info@desklib.com
Available 24*7 on WhatsApp / Email
![[object Object]](/_next/static/media/star-bottom.7253800d.svg)
Unlock your academic potential
Copyright © 2020–2026 A2Z Services. All Rights Reserved. Developed and managed by ZUCOL.