Corporate Accounting: Comparative Analysis of Boral and BCI Minerals
VerifiedAdded on 2023/06/04
|24
|4771
|145
Report
AI Summary
This report provides a comparative analysis of the financial performance and position of Boral Limited and BCI Minerals Limited from 2014 to 2017. It examines the income statements and balance sheets of both companies to assess their revenue, cost of goods sold, operating expenses, and net income. The analysis includes a comparison of key financial ratios such as gross profit margin and net profit margin to highlight the differences in performance. The report finds that Boral Limited has demonstrated strong financial performance with increasing revenue and profit, while BCI Minerals has faced significant challenges, with declining revenue and profitability. The report concludes with an assessment of the companies' liquidity and solvency, offering insights into their financial health and stability. The report's findings emphasize Boral's superior financial performance and management efficiency compared to BCI Minerals over the period analyzed.
Running head: CORPORATE ACCOUNTING
Corporate Accounting
Name of the Student:
Name of the University:
Authors Note:
Corporate Accounting
Name of the Student:
Name of the University:
Authors Note:
Paraphrase This Document
Need a fresh take? Get an instant paraphrase of this document with our AI Paraphraser
1
CORPORATE ACCOUNTING
Executive Summary:
In order to compare the financial performance and position between two entities one
needs to analyse the financial reports of two companies. The financial reports comprising of
income statement, statement of financial position, changes in equity statement, statement
showing cash flows and notes to account. Evaluating these statements will provide significant
information to the person evaluating these statements. Based on such information one can
compare the financial performance and position between those two companies. A detailed
analysis of financial statements of two companies of Boral Limited and BCI Mineral Limited
shall be conducted to compare and contrast the two companies’ performance and position.
2
CORPORATE ACCOUNTING
Contents
Executive Summary:........................................................................................................................1
Introduction:....................................................................................................................................3
Comparison of financial performances:...........................................................................................3
Boral Limited:..............................................................................................................................3
BCI Minerals Limited:.................................................................................................................5
Comparative analysis of financial performance:.............................................................................7
Financial position comparative analysis:.......................................................................................11
Liquidity position comparison of two companies:........................................................................14
Comparative analysis of long term solvency position of the two companies:..............................17
Conclusion:....................................................................................................................................18
References:....................................................................................................................................20
⊘ This is a preview!⊘
Do you want full access?
Subscribe today to unlock all pages.
Trusted by 1+ million students worldwide
3
CORPORATE ACCOUNTING
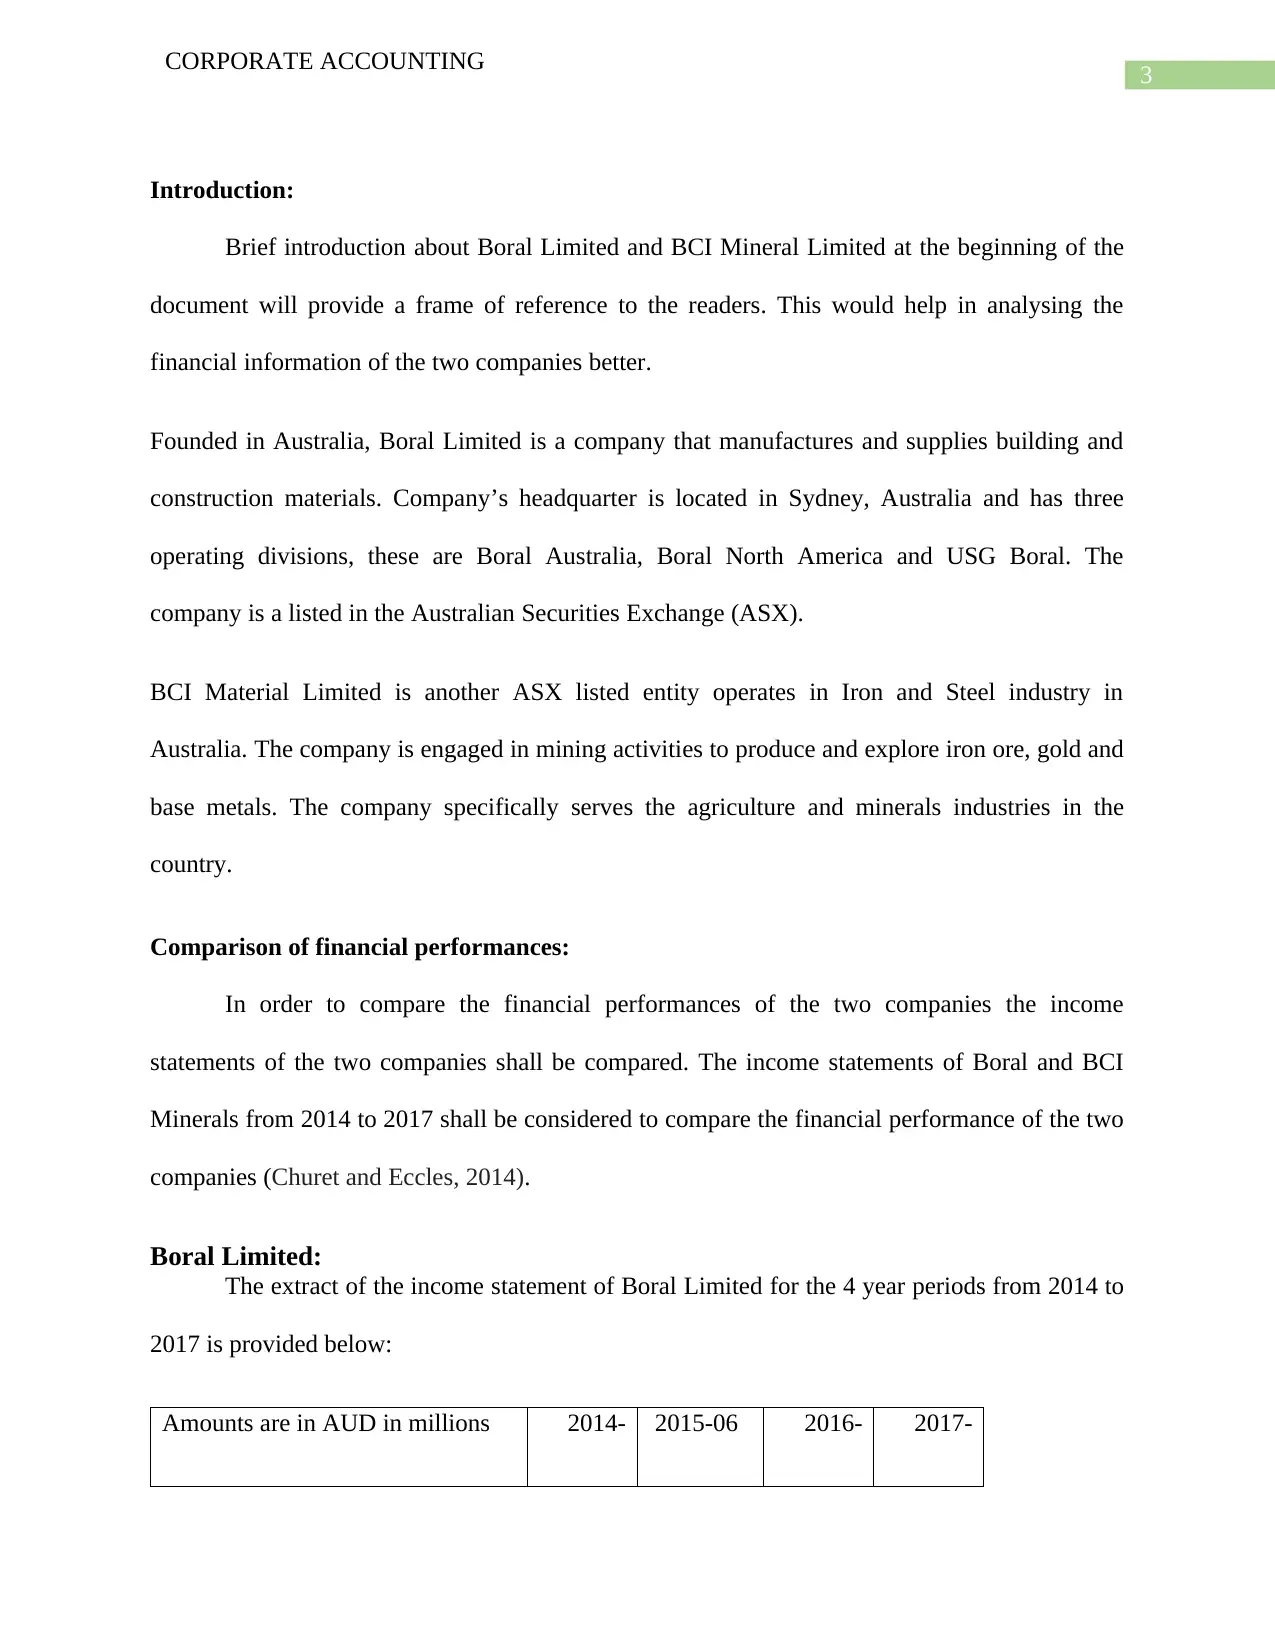
Introduction:
Brief introduction about Boral Limited and BCI Mineral Limited at the beginning of the
document will provide a frame of reference to the readers. This would help in analysing the
financial information of the two companies better.
Founded in Australia, Boral Limited is a company that manufactures and supplies building and
construction materials. Company’s headquarter is located in Sydney, Australia and has three
operating divisions, these are Boral Australia, Boral North America and USG Boral. The
company is a listed in the Australian Securities Exchange (ASX).
BCI Material Limited is another ASX listed entity operates in Iron and Steel industry in
Australia. The company is engaged in mining activities to produce and explore iron ore, gold and
base metals. The company specifically serves the agriculture and minerals industries in the
country.
Comparison of financial performances:
In order to compare the financial performances of the two companies the income
statements of the two companies shall be compared. The income statements of Boral and BCI
Minerals from 2014 to 2017 shall be considered to compare the financial performance of the two
companies (Churet and Eccles, 2014).
Boral Limited:
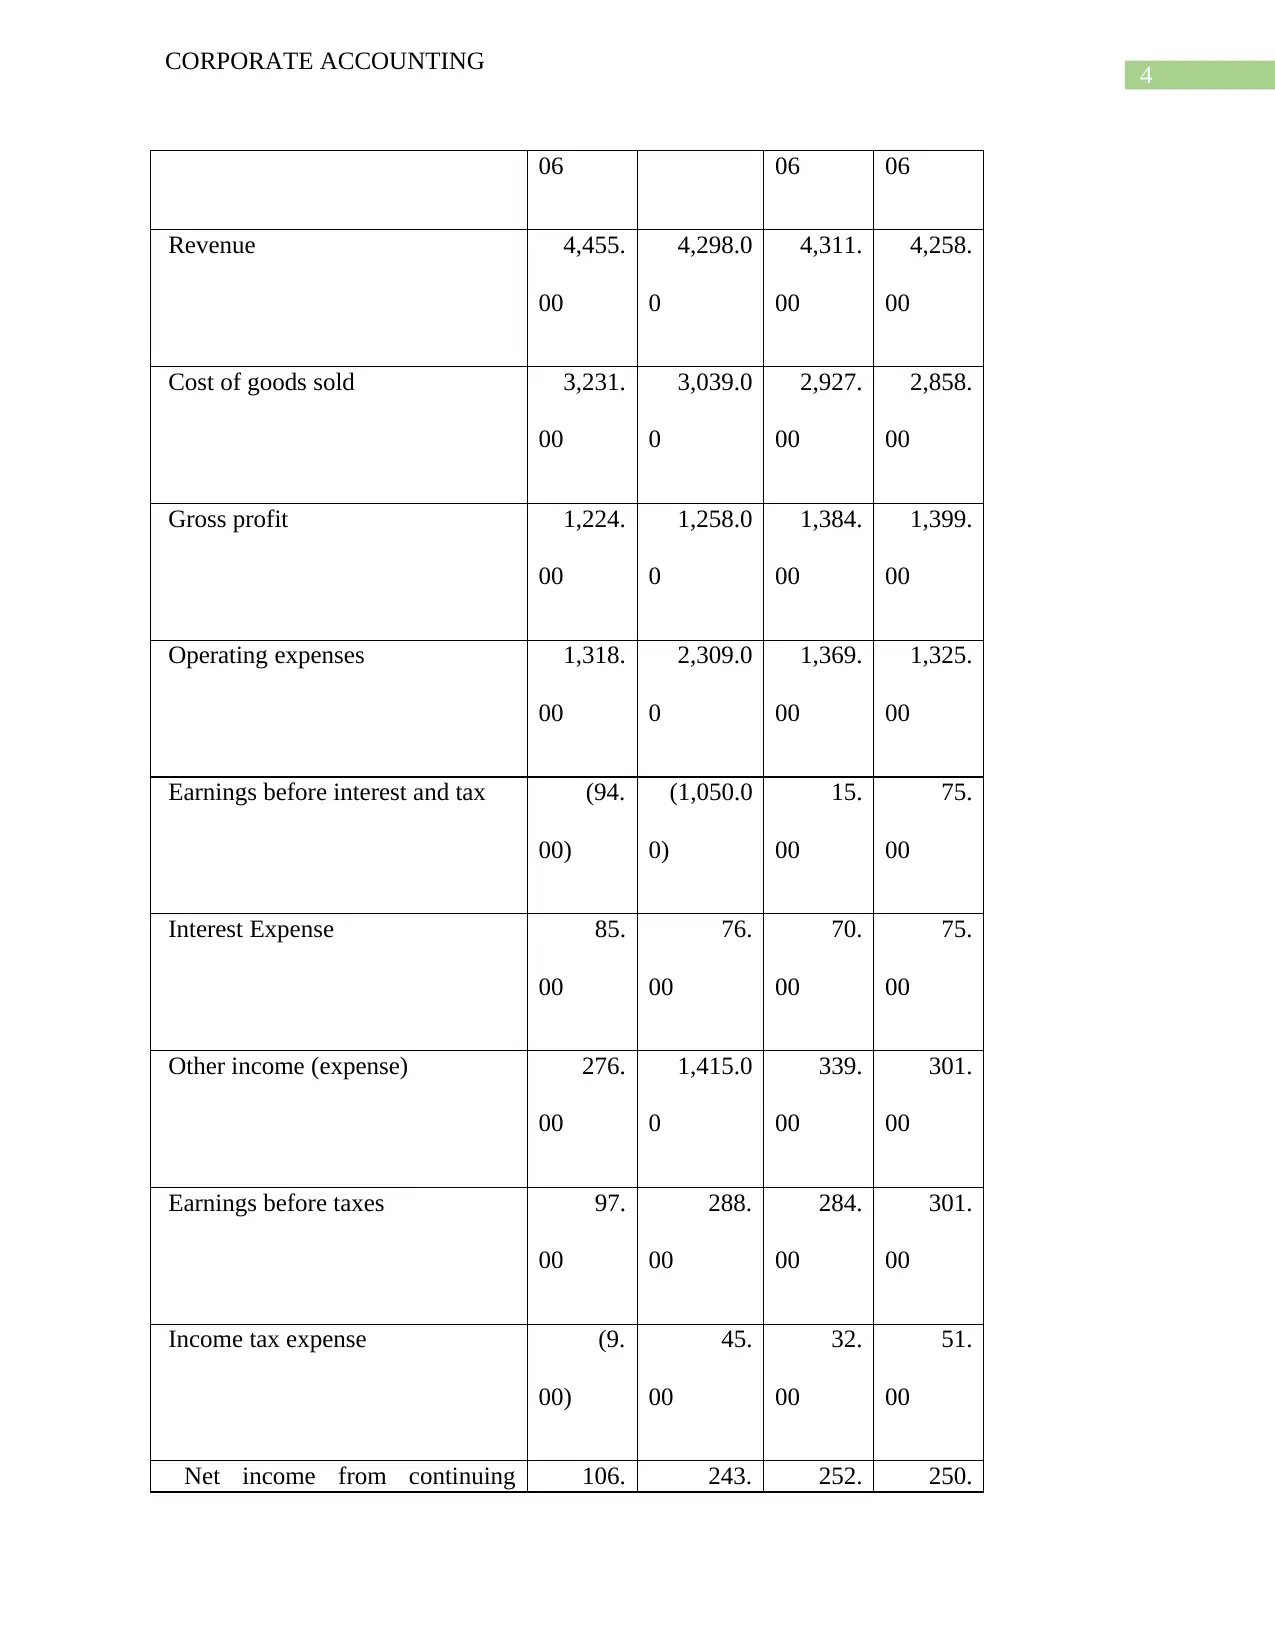
The extract of the income statement of Boral Limited for the 4 year periods from 2014 to
2017 is provided below:
Amounts are in AUD in millions 2014- 2015-06 2016- 2017-
CORPORATE ACCOUNTING
Introduction:
Brief introduction about Boral Limited and BCI Mineral Limited at the beginning of the
document will provide a frame of reference to the readers. This would help in analysing the
financial information of the two companies better.
Founded in Australia, Boral Limited is a company that manufactures and supplies building and
construction materials. Company’s headquarter is located in Sydney, Australia and has three
operating divisions, these are Boral Australia, Boral North America and USG Boral. The
company is a listed in the Australian Securities Exchange (ASX).
BCI Material Limited is another ASX listed entity operates in Iron and Steel industry in
Australia. The company is engaged in mining activities to produce and explore iron ore, gold and
base metals. The company specifically serves the agriculture and minerals industries in the
country.
Comparison of financial performances:
In order to compare the financial performances of the two companies the income
statements of the two companies shall be compared. The income statements of Boral and BCI
Minerals from 2014 to 2017 shall be considered to compare the financial performance of the two
companies (Churet and Eccles, 2014).
Boral Limited:
The extract of the income statement of Boral Limited for the 4 year periods from 2014 to
2017 is provided below:
Amounts are in AUD in millions 2014- 2015-06 2016- 2017-
Paraphrase This Document
Need a fresh take? Get an instant paraphrase of this document with our AI Paraphraser
4
CORPORATE ACCOUNTING
06 06 06
Revenue 4,455.
00
4,298.0
0
4,311.
00
4,258.
00
Cost of goods sold 3,231.
00
3,039.0
0
2,927.
00
2,858.
00
Gross profit 1,224.
00
1,258.0
0
1,384.
00
1,399.
00
Operating expenses 1,318.
00
2,309.0
0
1,369.
00
1,325.
00
Earnings before interest and tax (94.
00)
(1,050.0
0)
15.
00
75.
00
Interest Expense 85.
00
76.
00
70.
00
75.
00
Other income (expense) 276.
00
1,415.0
0
339.
00
301.
00
Earnings before taxes 97.
00
288.
00
284.
00
301.
00
Income tax expense (9.
00)
45.
00
32.
00
51.
00
Net income from continuing 106. 243. 252. 250.
5
CORPORATE ACCOUNTING
operations 00 00 00 00
Before comparing the financial performance of the two companies a brief discussion on the
financial performance of Boral Limited on the basis of above information will enlighten us about
the financial performance of the company over the years. The overall revenue of the company
has remained almost constant at and around the mark of $4,300 million as can be seen from the
above information (Storey et. al. 2016). However, due to efficient management of the company
with each passing year the amount of gross profit has increased significantly. . In 2017 the
company earned a gross revenue of $1,399 million. A year ago in 2016 despite higher amount of
revenue the company managed to earn a gross profit of $1,384 million. The net income of the
company has also increased with ever improving management of the company. In 2017 the
company has earned a net income of $250 million from continuing operations as compared to
$106 million in 2014. Thus, within a period of 3 years the company has managed to earn almost
150% more profit from its core business operations. Taking into consideration it can be said that
the company has performed exceedingly well over the years (Revelli and Viviani, 2015).
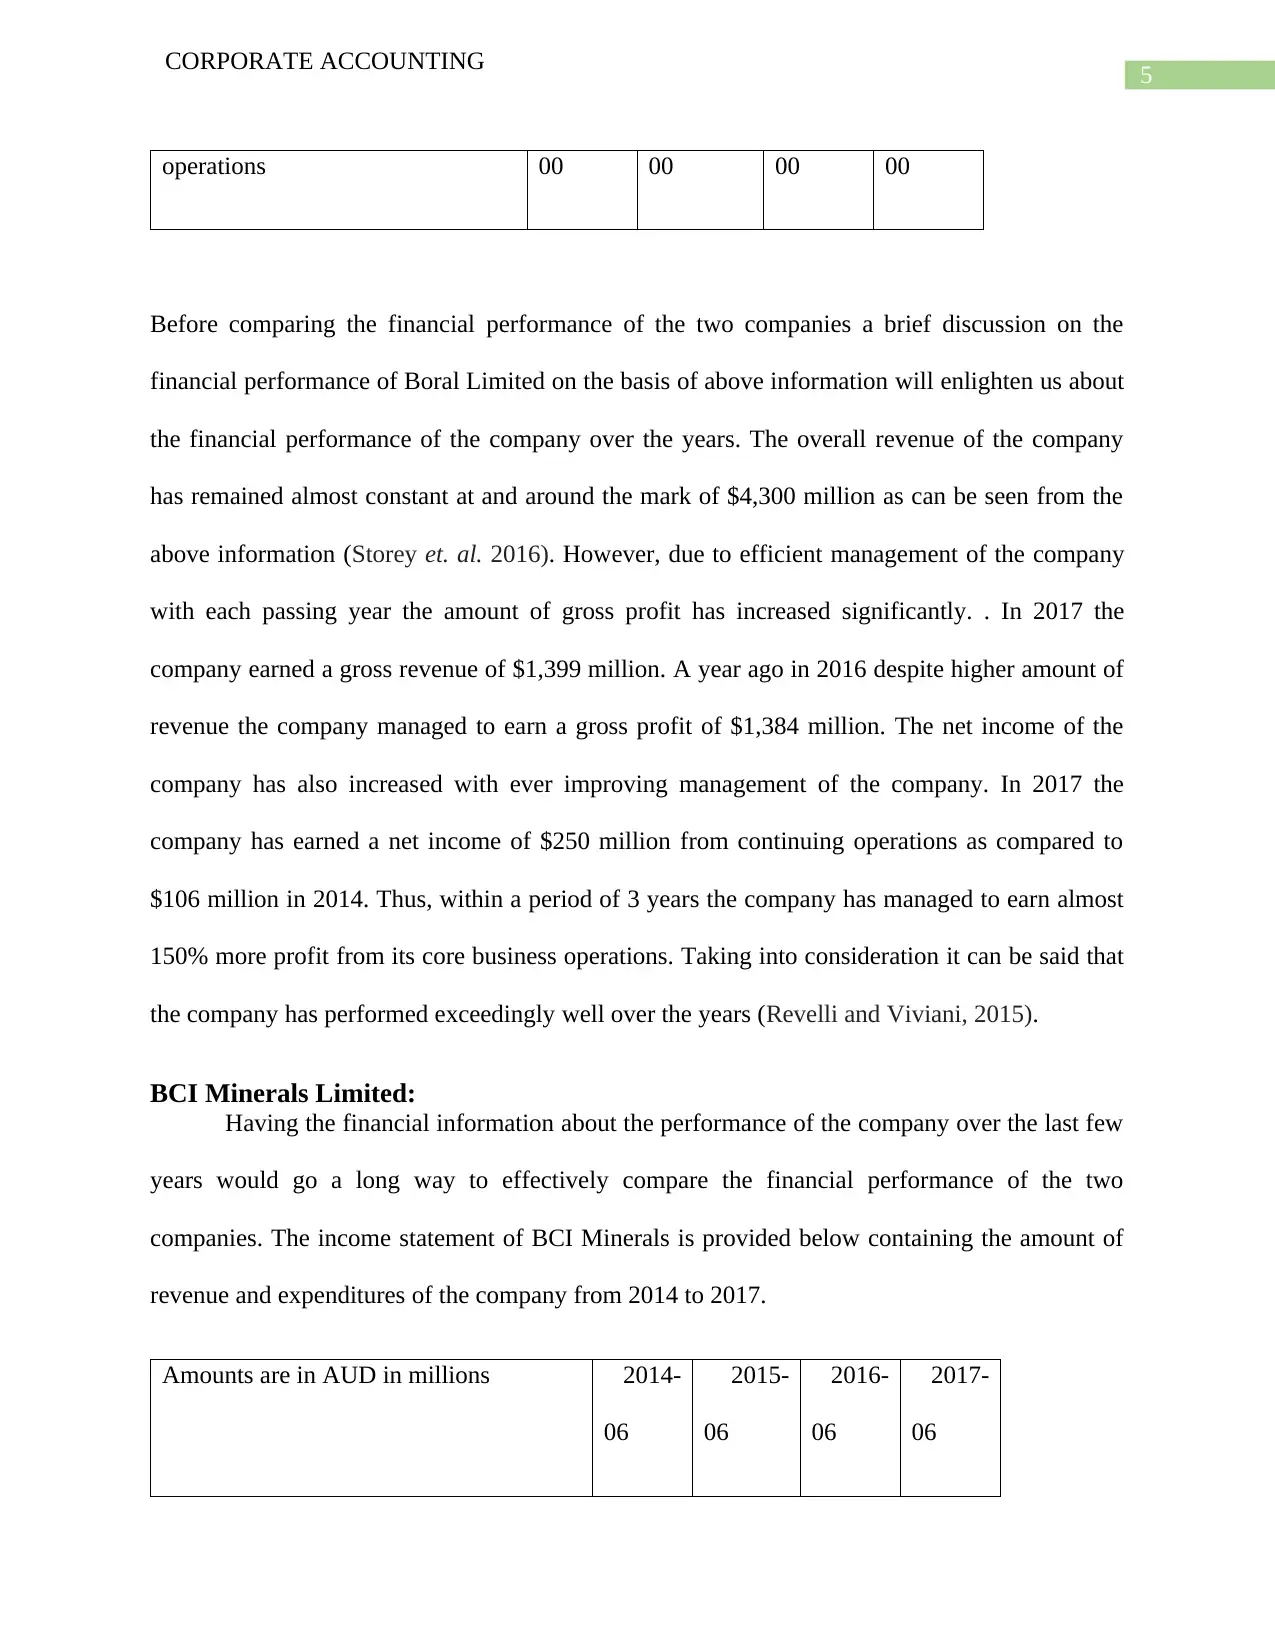
BCI Minerals Limited:
Having the financial information about the performance of the company over the last few
years would go a long way to effectively compare the financial performance of the two
companies. The income statement of BCI Minerals is provided below containing the amount of
revenue and expenditures of the company from 2014 to 2017.
Amounts are in AUD in millions 2014-
06
2015-
06
2016-
06
2017-
06
CORPORATE ACCOUNTING
operations 00 00 00 00
Before comparing the financial performance of the two companies a brief discussion on the
financial performance of Boral Limited on the basis of above information will enlighten us about
the financial performance of the company over the years. The overall revenue of the company
has remained almost constant at and around the mark of $4,300 million as can be seen from the
above information (Storey et. al. 2016). However, due to efficient management of the company
with each passing year the amount of gross profit has increased significantly. . In 2017 the
company earned a gross revenue of $1,399 million. A year ago in 2016 despite higher amount of
revenue the company managed to earn a gross profit of $1,384 million. The net income of the
company has also increased with ever improving management of the company. In 2017 the
company has earned a net income of $250 million from continuing operations as compared to
$106 million in 2014. Thus, within a period of 3 years the company has managed to earn almost
150% more profit from its core business operations. Taking into consideration it can be said that
the company has performed exceedingly well over the years (Revelli and Viviani, 2015).
BCI Minerals Limited:
Having the financial information about the performance of the company over the last few
years would go a long way to effectively compare the financial performance of the two
companies. The income statement of BCI Minerals is provided below containing the amount of
revenue and expenditures of the company from 2014 to 2017.
Amounts are in AUD in millions 2014-
06
2015-
06
2016-
06
2017-
06
⊘ This is a preview!⊘
Do you want full access?
Subscribe today to unlock all pages.
Trusted by 1+ million students worldwide
6
CORPORATE ACCOUNTING
Revenue 466.
00
278.
00
150.
00
63
.00
Cost of goods sold 245.
00
247.
00
135.
00
45
.00
Gross profit 221.
00
31.
00
15
.00
19
.00
Operating expenses 101.
00
234.
00
68
.00
12
.00
Earnings before interest and tax 120.
00
(203.0
0)
(53.
00)
7
.00
Net income from continuing operations 74
.00
(158.0
0)
(80.
00)
7
.00
The fortune of BCI Minerals is almost opposite to that of Boral Limited. Where Boral has
progressed year after year by earning higher amount of income BCI has struggled very badly and
its revenue as well as it profits have all plummet down the bottom. In 2017 the company has
merely earn a revenue of $63 million whereas the amount of revenue was almost 8 times higher
even 3 years ago (Telecky and Cejka, 2017). Since 2014 the revenue as well as operating income
of the company have decreased consistently without any exception. Net income of the company
in 2017 is $7 million whereas in 2014 the company earned a positive income of $74 million.
Paraphrase This Document
Need a fresh take? Get an instant paraphrase of this document with our AI Paraphraser
7
CORPORATE ACCOUNTING
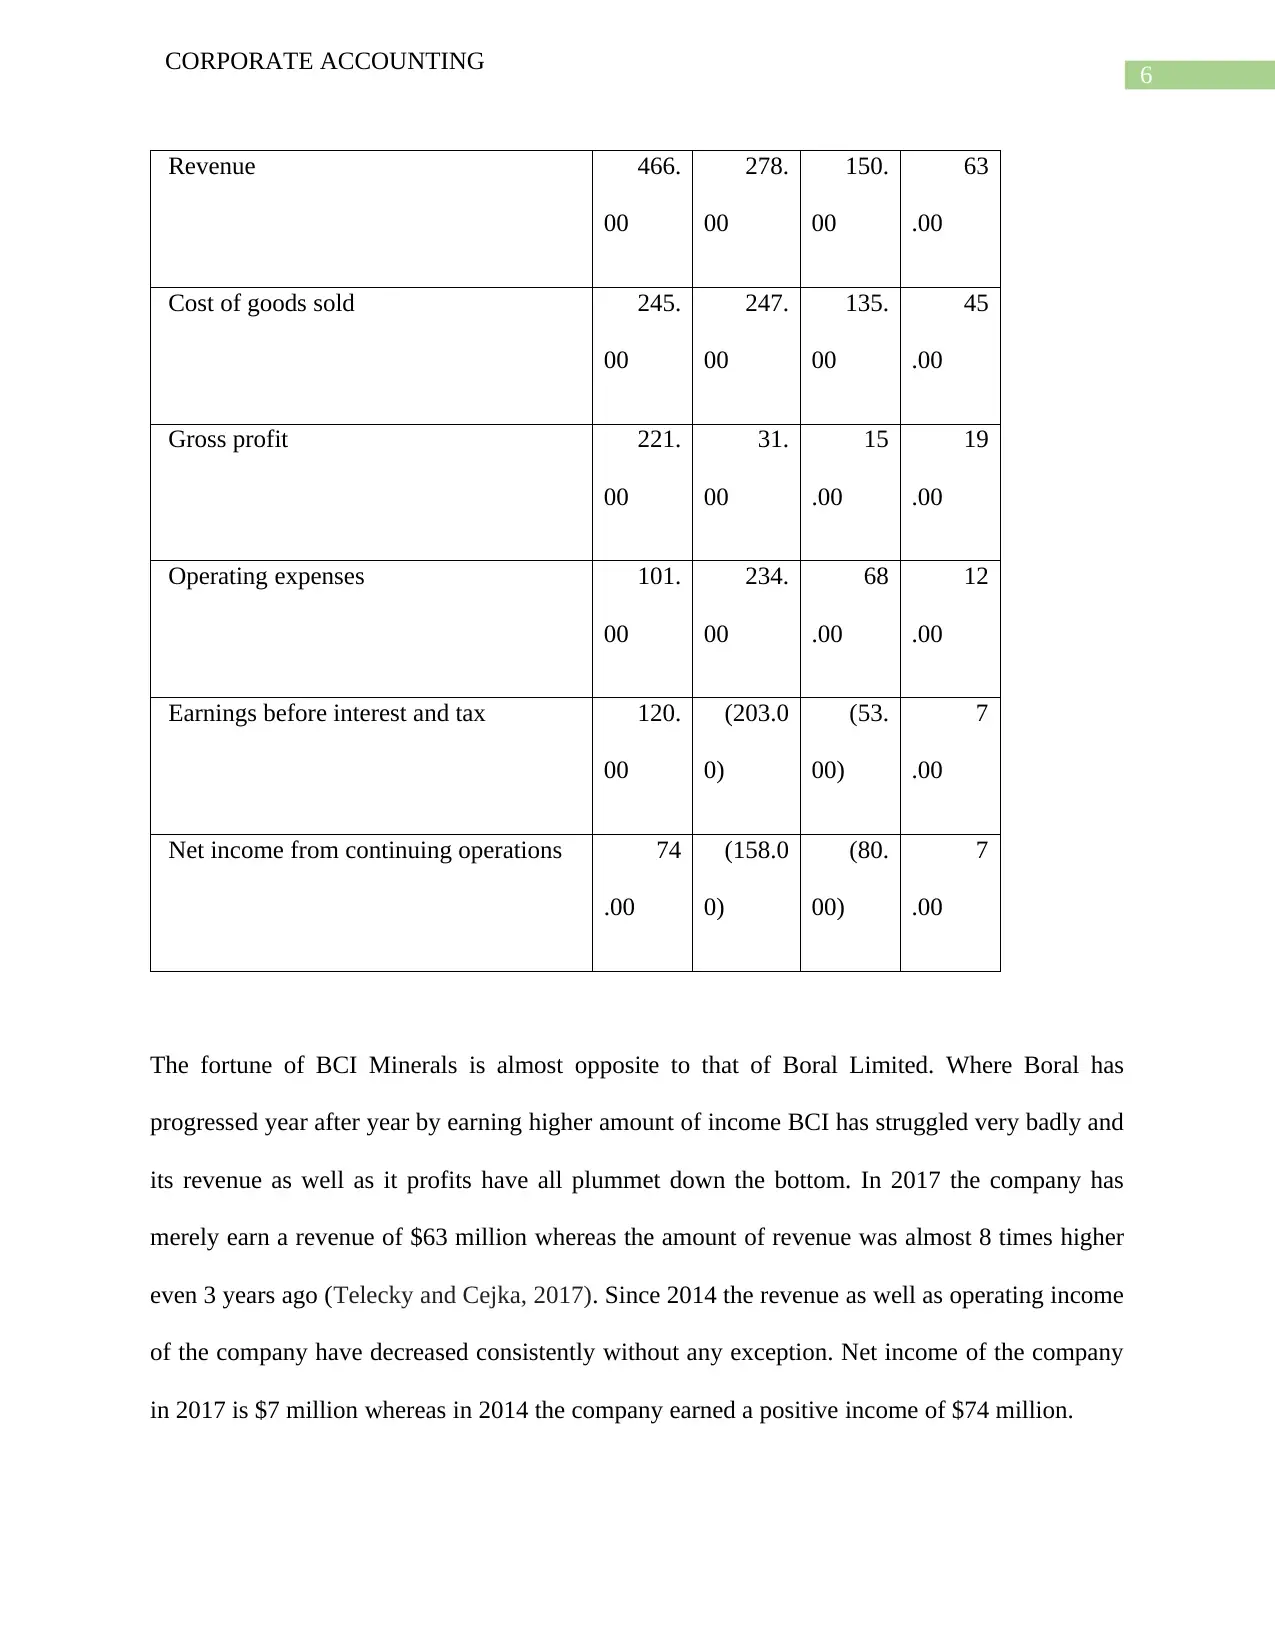
Comparative analysis of financial performance:
An effective comparison between the financial performance of Boral Limited and BCI
Minerals Limited is not possible without having the information containing in the income
statements of the two companies. In order to compare the financial performances of the two
companies, the items of revenue and expenditures of 2016-17 and 2017-18 have been
considered.
2016-06 2017-06
Amounts are in AUD in millions Boral BCI Minerals Boral BCI
Minerals
Revenue 4,311.00 150.00 4,258.00 63.00
Cost of goods sold 2,927.00 135.00 2,858.00 45.00
Gross profit 1,384.00 15.00 1,399.00 19.00
Operating expenses 1,369.00 - 1,325.00 -
Earnings before interest and tax 15.00 (53.00) 75.0
0
7.00
Interest Expense 70.00 75.0
0
Other income (expense) 339.00 301.00
Earnings before taxes 284.00 301.00
CORPORATE ACCOUNTING
Comparative analysis of financial performance:
An effective comparison between the financial performance of Boral Limited and BCI
Minerals Limited is not possible without having the information containing in the income
statements of the two companies. In order to compare the financial performances of the two
companies, the items of revenue and expenditures of 2016-17 and 2017-18 have been
considered.
2016-06 2017-06
Amounts are in AUD in millions Boral BCI Minerals Boral BCI
Minerals
Revenue 4,311.00 150.00 4,258.00 63.00
Cost of goods sold 2,927.00 135.00 2,858.00 45.00
Gross profit 1,384.00 15.00 1,399.00 19.00
Operating expenses 1,369.00 - 1,325.00 -
Earnings before interest and tax 15.00 (53.00) 75.0
0
7.00
Interest Expense 70.00 75.0
0
Other income (expense) 339.00 301.00
Earnings before taxes 284.00 301.00
8
CORPORATE ACCOUNTING
Income tax expense 32.00 51.0
0
Net income from continuing
operations
252.00 (80.00) 250.00 7.00
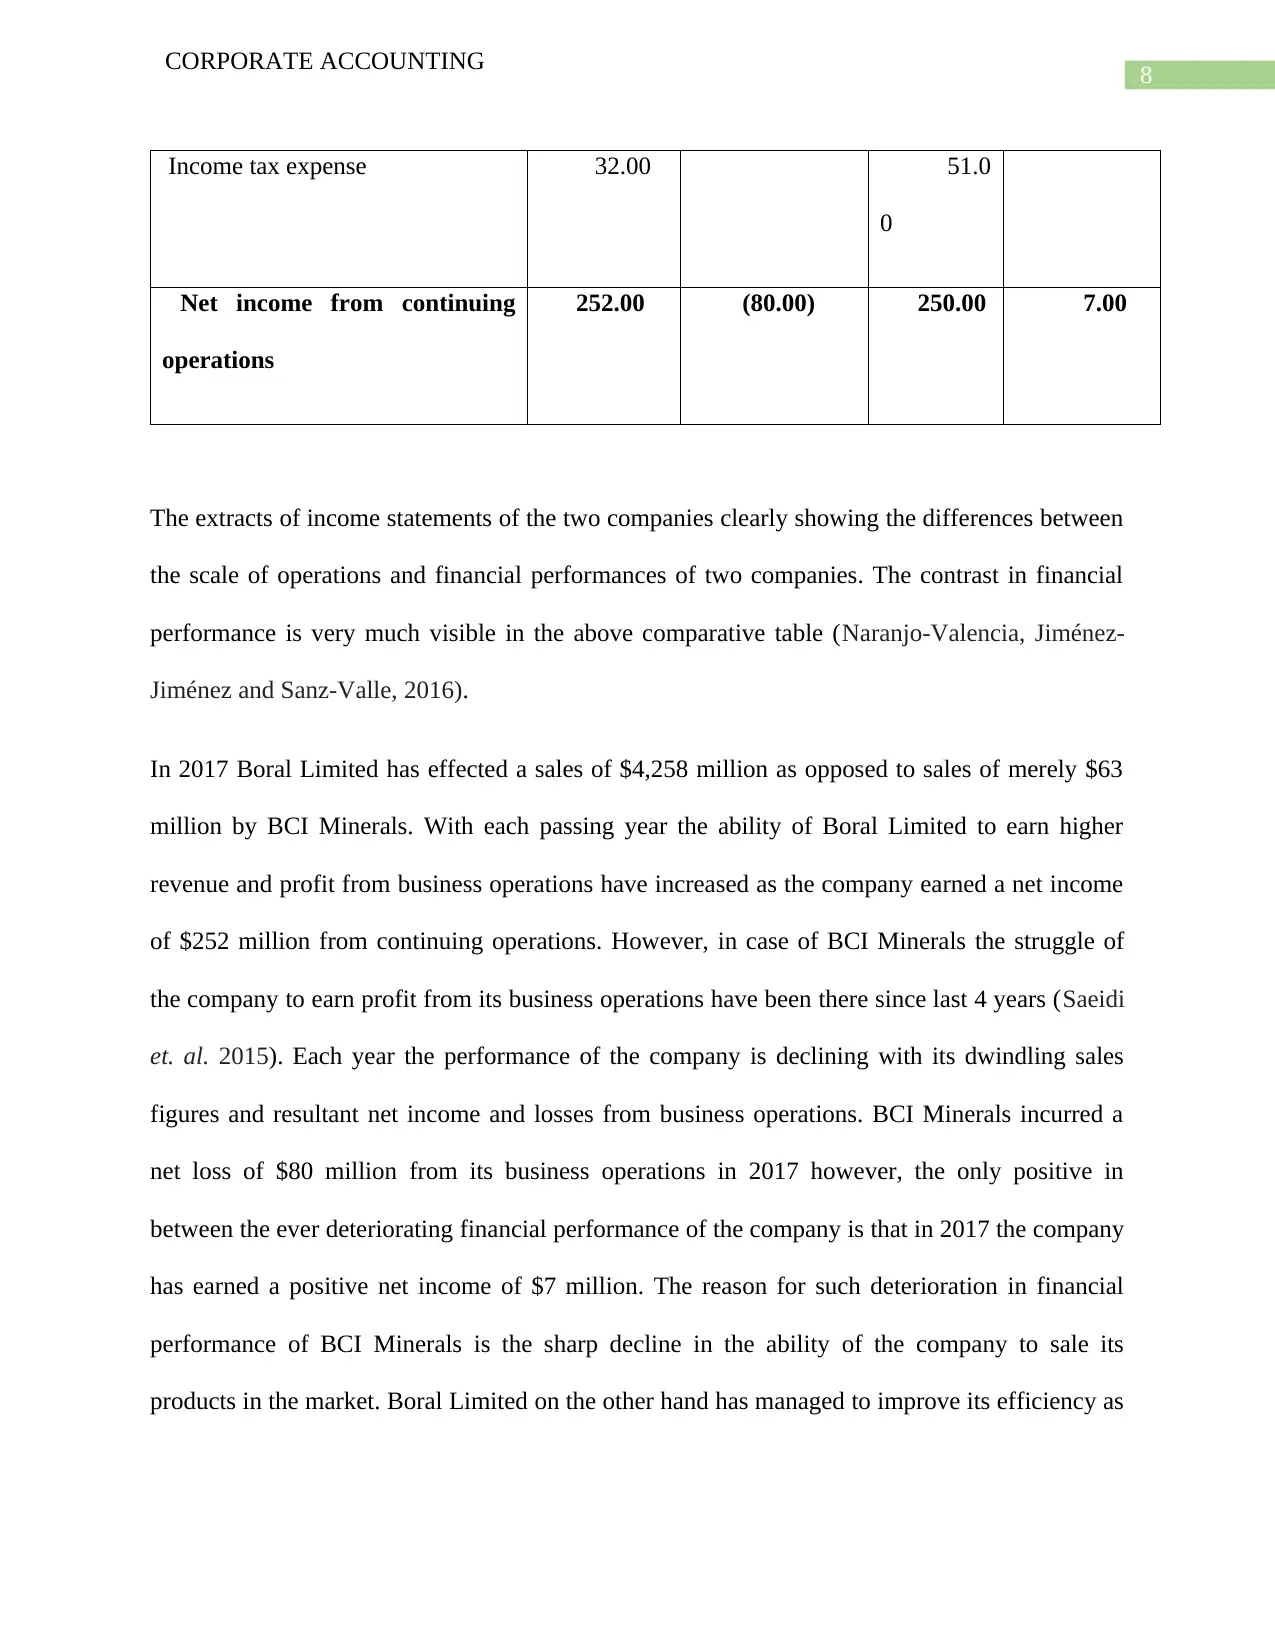
The extracts of income statements of the two companies clearly showing the differences between
the scale of operations and financial performances of two companies. The contrast in financial
performance is very much visible in the above comparative table (Naranjo-Valencia, Jiménez-
Jiménez and Sanz-Valle, 2016).
In 2017 Boral Limited has effected a sales of $4,258 million as opposed to sales of merely $63
million by BCI Minerals. With each passing year the ability of Boral Limited to earn higher
revenue and profit from business operations have increased as the company earned a net income
of $252 million from continuing operations. However, in case of BCI Minerals the struggle of
the company to earn profit from its business operations have been there since last 4 years (Saeidi
et. al. 2015). Each year the performance of the company is declining with its dwindling sales
figures and resultant net income and losses from business operations. BCI Minerals incurred a
net loss of $80 million from its business operations in 2017 however, the only positive in
between the ever deteriorating financial performance of the company is that in 2017 the company
has earned a positive net income of $7 million. The reason for such deterioration in financial
performance of BCI Minerals is the sharp decline in the ability of the company to sale its
products in the market. Boral Limited on the other hand has managed to improve its efficiency as
CORPORATE ACCOUNTING
Income tax expense 32.00 51.0
0
Net income from continuing
operations
252.00 (80.00) 250.00 7.00
The extracts of income statements of the two companies clearly showing the differences between
the scale of operations and financial performances of two companies. The contrast in financial
performance is very much visible in the above comparative table (Naranjo-Valencia, Jiménez-
Jiménez and Sanz-Valle, 2016).
In 2017 Boral Limited has effected a sales of $4,258 million as opposed to sales of merely $63
million by BCI Minerals. With each passing year the ability of Boral Limited to earn higher
revenue and profit from business operations have increased as the company earned a net income
of $252 million from continuing operations. However, in case of BCI Minerals the struggle of
the company to earn profit from its business operations have been there since last 4 years (Saeidi
et. al. 2015). Each year the performance of the company is declining with its dwindling sales
figures and resultant net income and losses from business operations. BCI Minerals incurred a
net loss of $80 million from its business operations in 2017 however, the only positive in
between the ever deteriorating financial performance of the company is that in 2017 the company
has earned a positive net income of $7 million. The reason for such deterioration in financial
performance of BCI Minerals is the sharp decline in the ability of the company to sale its
products in the market. Boral Limited on the other hand has managed to improve its efficiency as
⊘ This is a preview!⊘
Do you want full access?
Subscribe today to unlock all pages.
Trusted by 1+ million students worldwide
9
CORPORATE ACCOUNTING
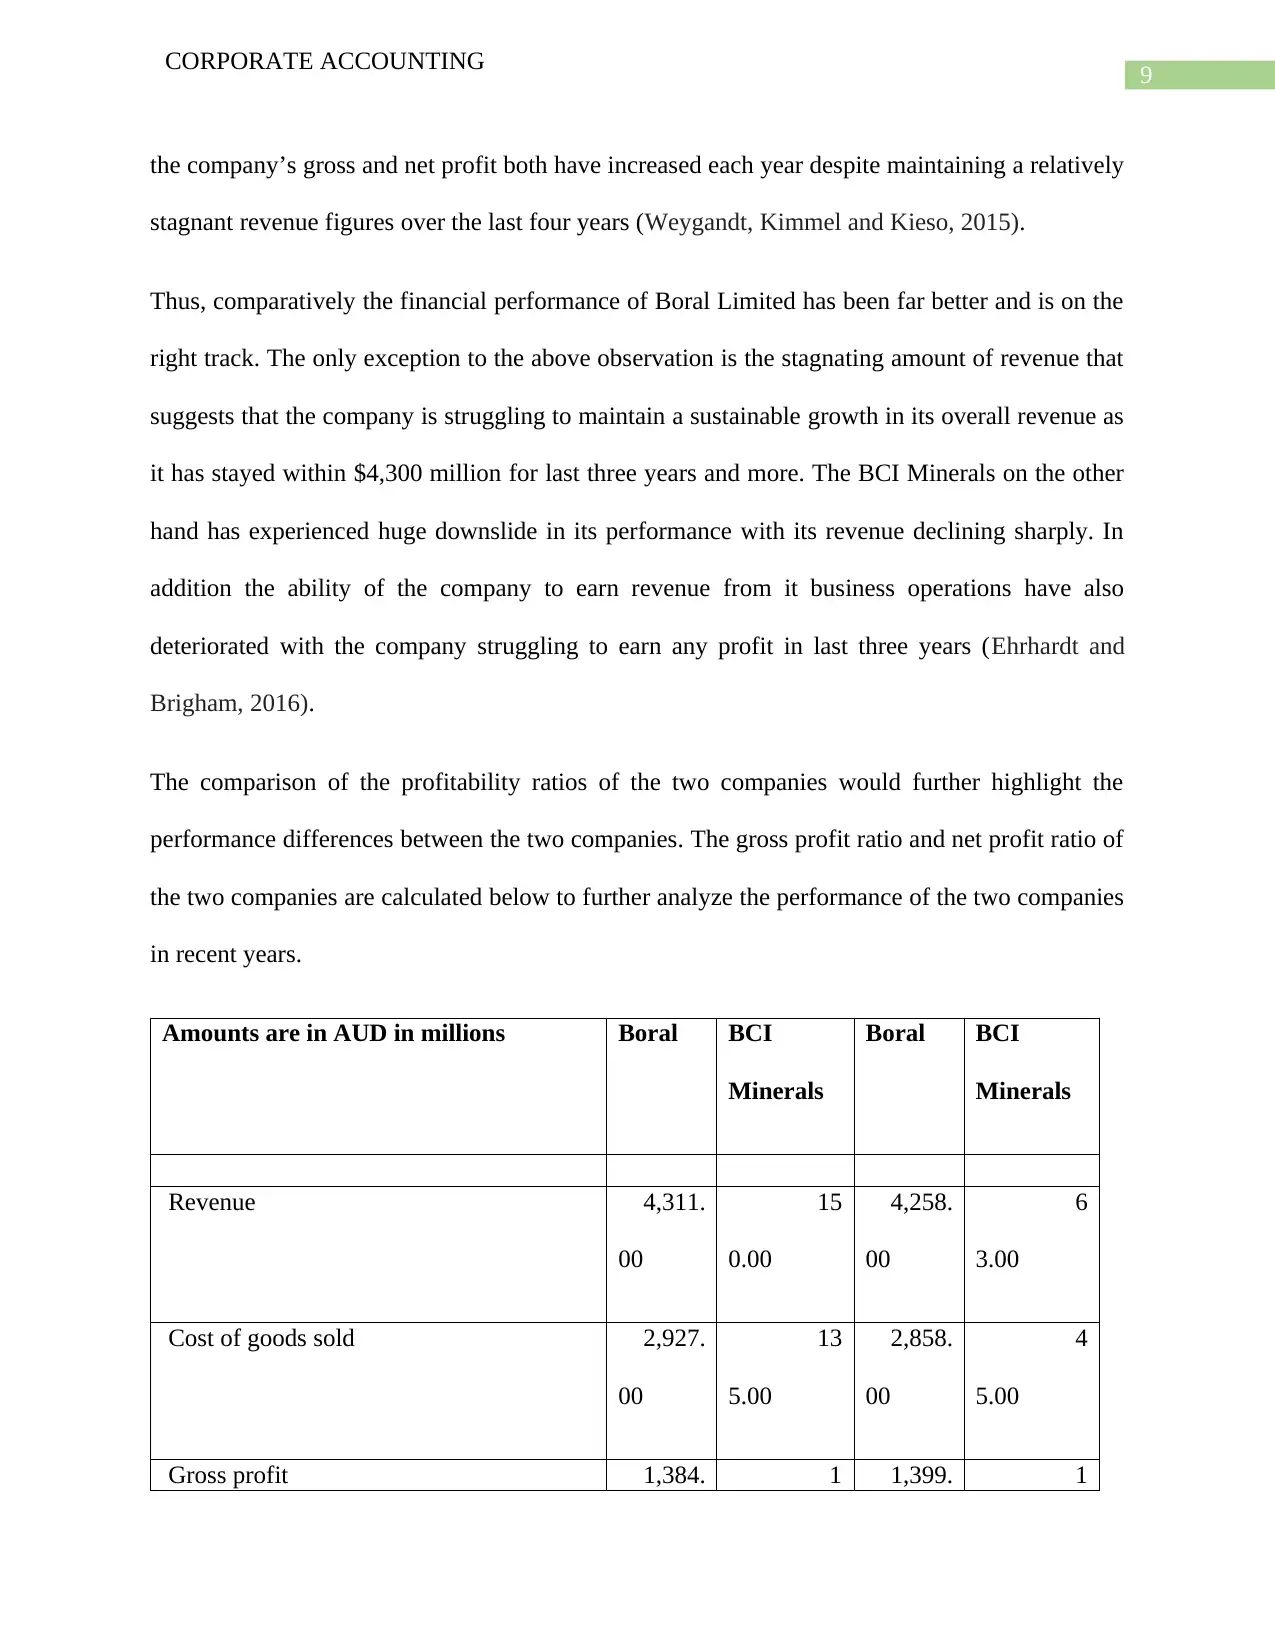
the company’s gross and net profit both have increased each year despite maintaining a relatively
stagnant revenue figures over the last four years (Weygandt, Kimmel and Kieso, 2015).
Thus, comparatively the financial performance of Boral Limited has been far better and is on the
right track. The only exception to the above observation is the stagnating amount of revenue that
suggests that the company is struggling to maintain a sustainable growth in its overall revenue as
it has stayed within $4,300 million for last three years and more. The BCI Minerals on the other
hand has experienced huge downslide in its performance with its revenue declining sharply. In
addition the ability of the company to earn revenue from it business operations have also
deteriorated with the company struggling to earn any profit in last three years (Ehrhardt and
Brigham, 2016).
The comparison of the profitability ratios of the two companies would further highlight the
performance differences between the two companies. The gross profit ratio and net profit ratio of
the two companies are calculated below to further analyze the performance of the two companies
in recent years.
Amounts are in AUD in millions Boral BCI
Minerals
Boral BCI
Minerals
Revenue 4,311.
00
15
0.00
4,258.
00
6
3.00
Cost of goods sold 2,927.
00
13
5.00
2,858.
00
4
5.00
Gross profit 1,384. 1 1,399. 1
CORPORATE ACCOUNTING
the company’s gross and net profit both have increased each year despite maintaining a relatively
stagnant revenue figures over the last four years (Weygandt, Kimmel and Kieso, 2015).
Thus, comparatively the financial performance of Boral Limited has been far better and is on the
right track. The only exception to the above observation is the stagnating amount of revenue that
suggests that the company is struggling to maintain a sustainable growth in its overall revenue as
it has stayed within $4,300 million for last three years and more. The BCI Minerals on the other
hand has experienced huge downslide in its performance with its revenue declining sharply. In
addition the ability of the company to earn revenue from it business operations have also
deteriorated with the company struggling to earn any profit in last three years (Ehrhardt and
Brigham, 2016).
The comparison of the profitability ratios of the two companies would further highlight the
performance differences between the two companies. The gross profit ratio and net profit ratio of
the two companies are calculated below to further analyze the performance of the two companies
in recent years.
Amounts are in AUD in millions Boral BCI
Minerals
Boral BCI
Minerals
Revenue 4,311.
00
15
0.00
4,258.
00
6
3.00
Cost of goods sold 2,927.
00
13
5.00
2,858.
00
4
5.00
Gross profit 1,384. 1 1,399. 1
Paraphrase This Document
Need a fresh take? Get an instant paraphrase of this document with our AI Paraphraser
10
CORPORATE ACCOUNTING
00 5.00 00 9.00
Gross profit ratio (Gross profit x 100/
Revenue)
32.
10
1
0.00
32.
86
3
0.16
Net income from continuing operations 252 -80 250 7
Net profit ratio (Net profit x
100//Revenue)
5.
85
(53
.33)
5.
87
1
1.11
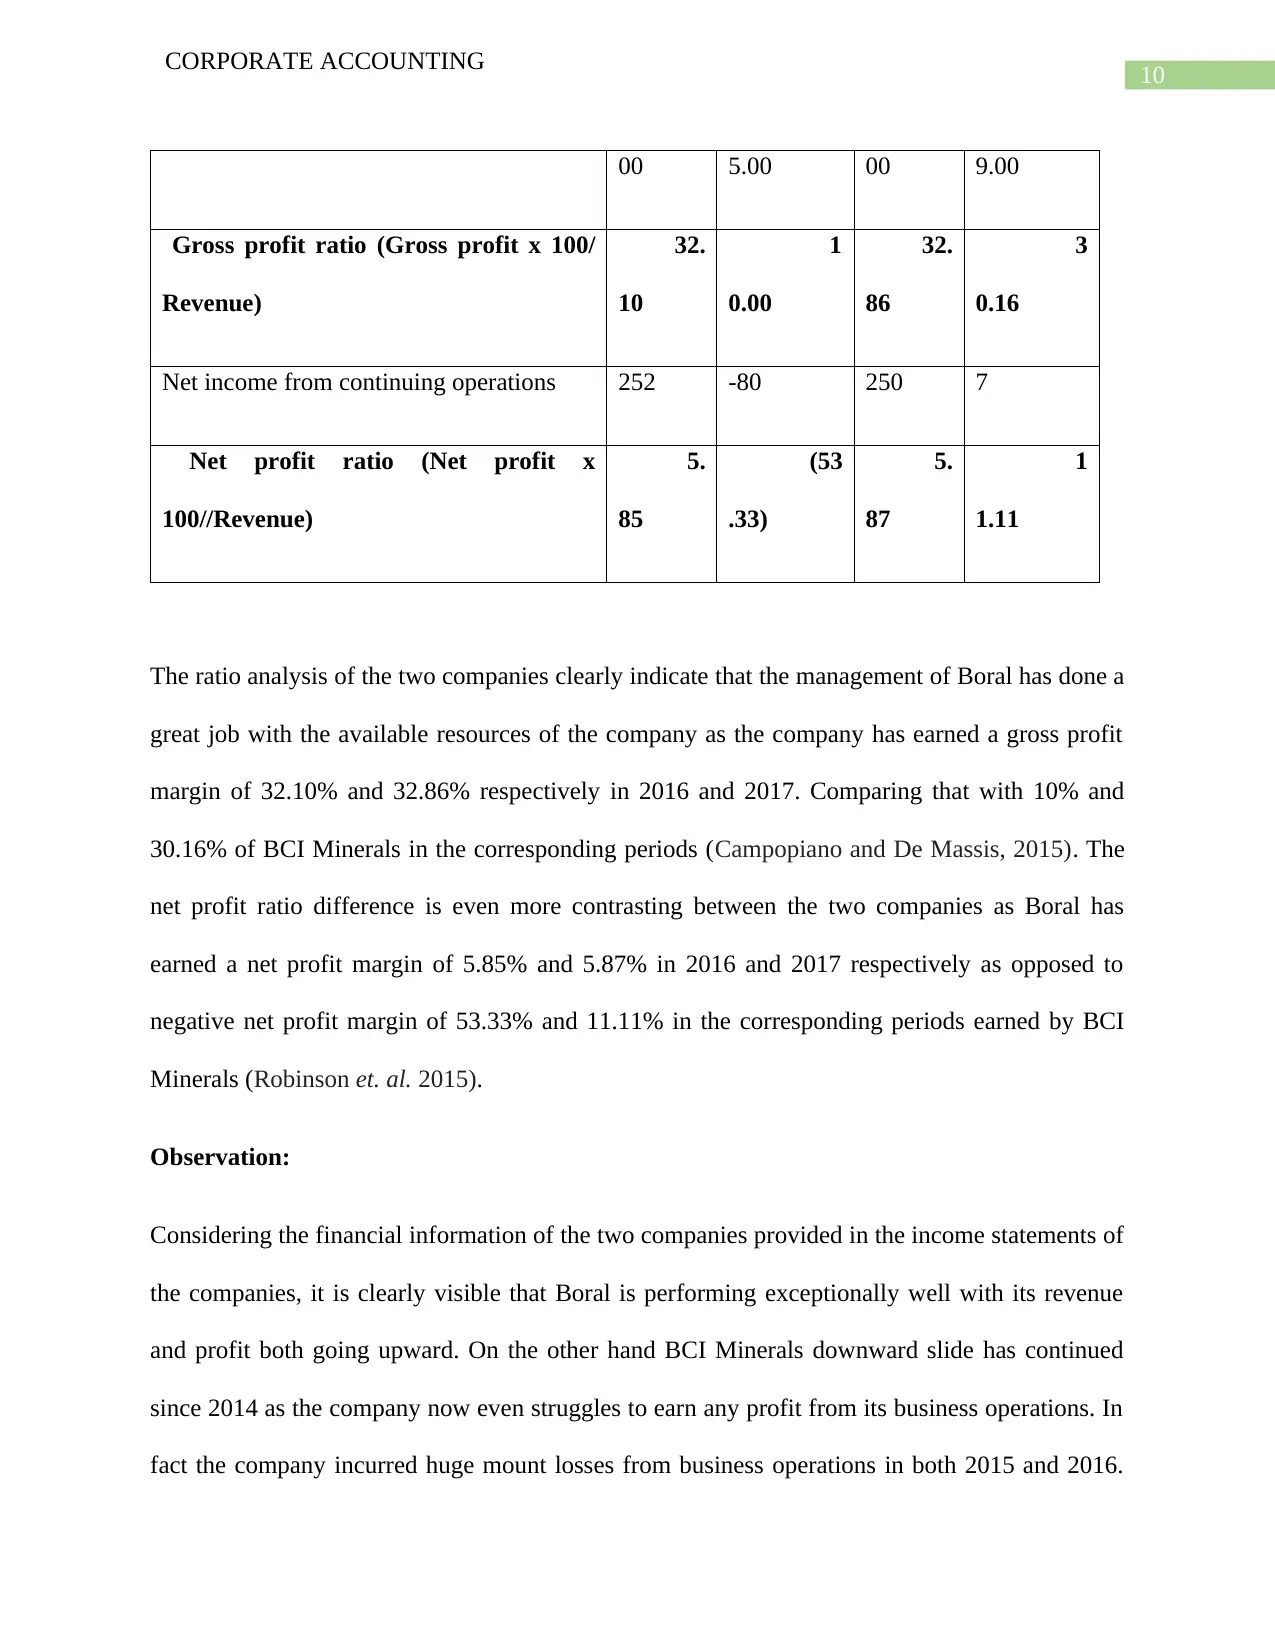
The ratio analysis of the two companies clearly indicate that the management of Boral has done a
great job with the available resources of the company as the company has earned a gross profit
margin of 32.10% and 32.86% respectively in 2016 and 2017. Comparing that with 10% and
30.16% of BCI Minerals in the corresponding periods (Campopiano and De Massis, 2015). The
net profit ratio difference is even more contrasting between the two companies as Boral has
earned a net profit margin of 5.85% and 5.87% in 2016 and 2017 respectively as opposed to
negative net profit margin of 53.33% and 11.11% in the corresponding periods earned by BCI
Minerals (Robinson et. al. 2015).
Observation:
Considering the financial information of the two companies provided in the income statements of
the companies, it is clearly visible that Boral is performing exceptionally well with its revenue
and profit both going upward. On the other hand BCI Minerals downward slide has continued
since 2014 as the company now even struggles to earn any profit from its business operations. In
fact the company incurred huge mount losses from business operations in both 2015 and 2016.
CORPORATE ACCOUNTING
00 5.00 00 9.00
Gross profit ratio (Gross profit x 100/
Revenue)
32.
10
1
0.00
32.
86
3
0.16
Net income from continuing operations 252 -80 250 7
Net profit ratio (Net profit x
100//Revenue)
5.
85
(53
.33)
5.
87
1
1.11
The ratio analysis of the two companies clearly indicate that the management of Boral has done a
great job with the available resources of the company as the company has earned a gross profit
margin of 32.10% and 32.86% respectively in 2016 and 2017. Comparing that with 10% and
30.16% of BCI Minerals in the corresponding periods (Campopiano and De Massis, 2015). The
net profit ratio difference is even more contrasting between the two companies as Boral has
earned a net profit margin of 5.85% and 5.87% in 2016 and 2017 respectively as opposed to
negative net profit margin of 53.33% and 11.11% in the corresponding periods earned by BCI
Minerals (Robinson et. al. 2015).
Observation:
Considering the financial information of the two companies provided in the income statements of
the companies, it is clearly visible that Boral is performing exceptionally well with its revenue
and profit both going upward. On the other hand BCI Minerals downward slide has continued
since 2014 as the company now even struggles to earn any profit from its business operations. In
fact the company incurred huge mount losses from business operations in both 2015 and 2016.
11
CORPORATE ACCOUNTING
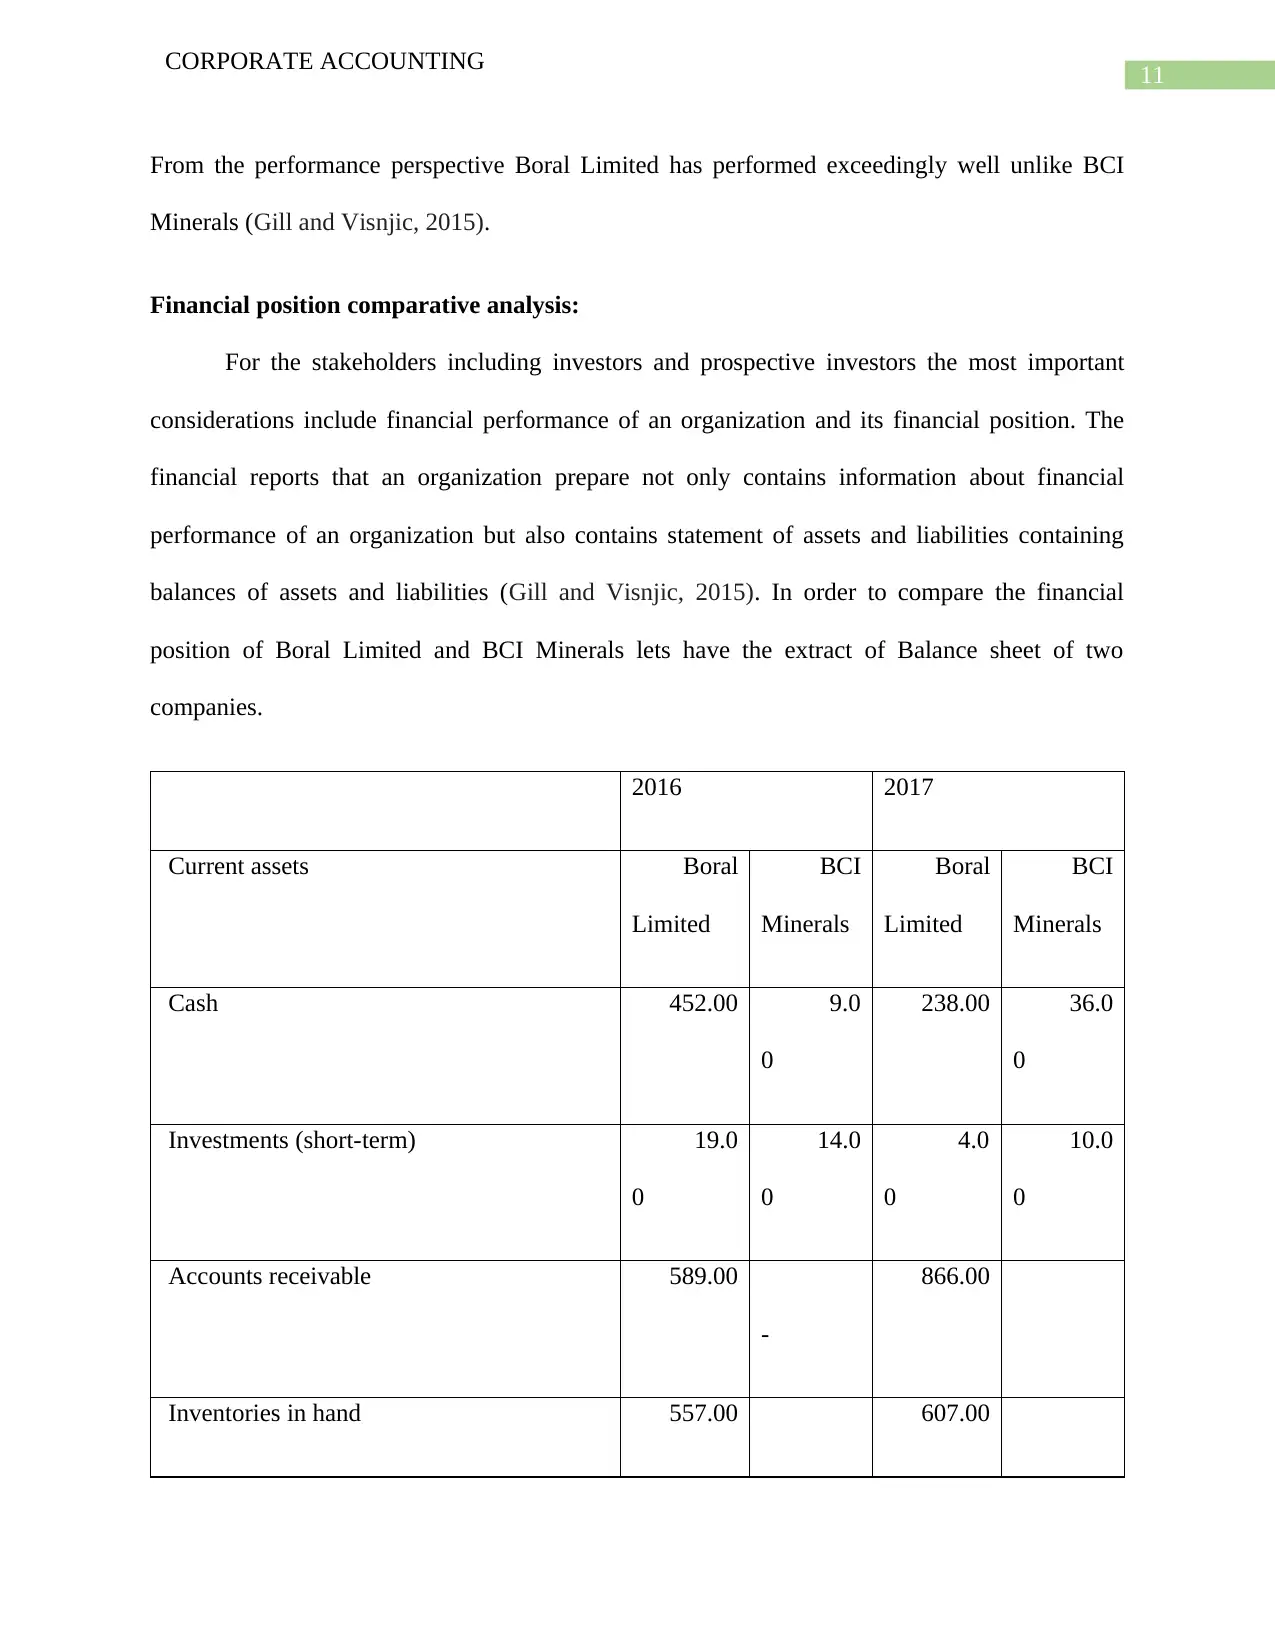
From the performance perspective Boral Limited has performed exceedingly well unlike BCI
Minerals (Gill and Visnjic, 2015).
Financial position comparative analysis:
For the stakeholders including investors and prospective investors the most important
considerations include financial performance of an organization and its financial position. The
financial reports that an organization prepare not only contains information about financial
performance of an organization but also contains statement of assets and liabilities containing
balances of assets and liabilities (Gill and Visnjic, 2015). In order to compare the financial
position of Boral Limited and BCI Minerals lets have the extract of Balance sheet of two
companies.
2016 2017
Current assets Boral
Limited
BCI
Minerals
Boral
Limited
BCI
Minerals
Cash 452.00 9.0
0
238.00 36.0
0
Investments (short-term) 19.0
0
14.0
0
4.0
0
10.0
0
Accounts receivable 589.00
-
866.00
Inventories in hand 557.00 607.00
CORPORATE ACCOUNTING
From the performance perspective Boral Limited has performed exceedingly well unlike BCI
Minerals (Gill and Visnjic, 2015).
Financial position comparative analysis:
For the stakeholders including investors and prospective investors the most important
considerations include financial performance of an organization and its financial position. The
financial reports that an organization prepare not only contains information about financial
performance of an organization but also contains statement of assets and liabilities containing
balances of assets and liabilities (Gill and Visnjic, 2015). In order to compare the financial
position of Boral Limited and BCI Minerals lets have the extract of Balance sheet of two
companies.
2016 2017
Current assets Boral
Limited
BCI
Minerals
Boral
Limited
BCI
Minerals
Cash 452.00 9.0
0
238.00 36.0
0
Investments (short-term) 19.0
0
14.0
0
4.0
0
10.0
0
Accounts receivable 589.00
-
866.00
Inventories in hand 557.00 607.00
⊘ This is a preview!⊘
Do you want full access?
Subscribe today to unlock all pages.
Trusted by 1+ million students worldwide
1 out of 24
Related Documents


Your All-in-One AI-Powered Toolkit for Academic Success.
+13062052269
info@desklib.com
Available 24*7 on WhatsApp / Email
![[object Object]](/_next/static/media/star-bottom.7253800d.svg)
Unlock your academic potential
Copyright © 2020–2026 A2Z Services. All Rights Reserved. Developed and managed by ZUCOL.