Business Planning: Budgeted vs. Actual Financial Statement Analysis
VerifiedAdded on  2023/06/18
|14
|2157
|457
Practical Assignment
AI Summary
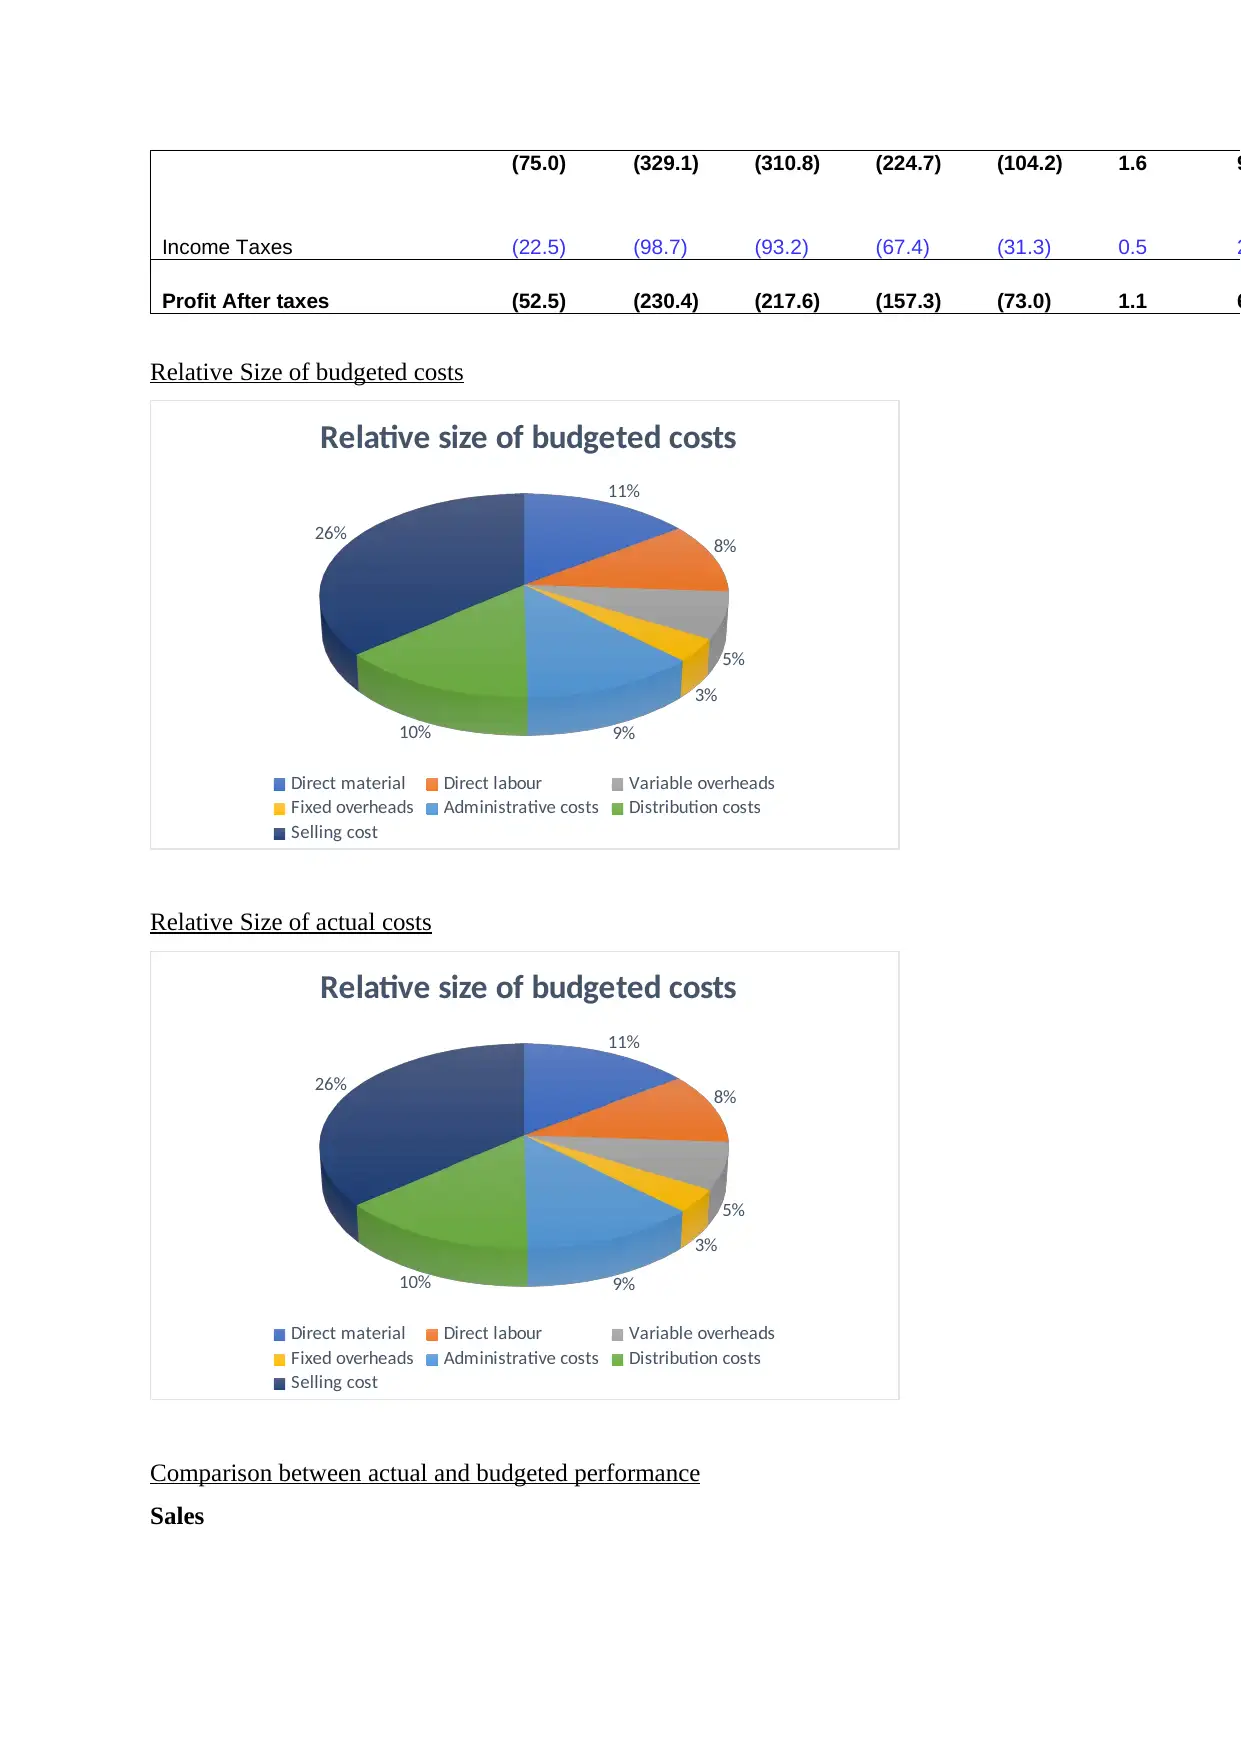
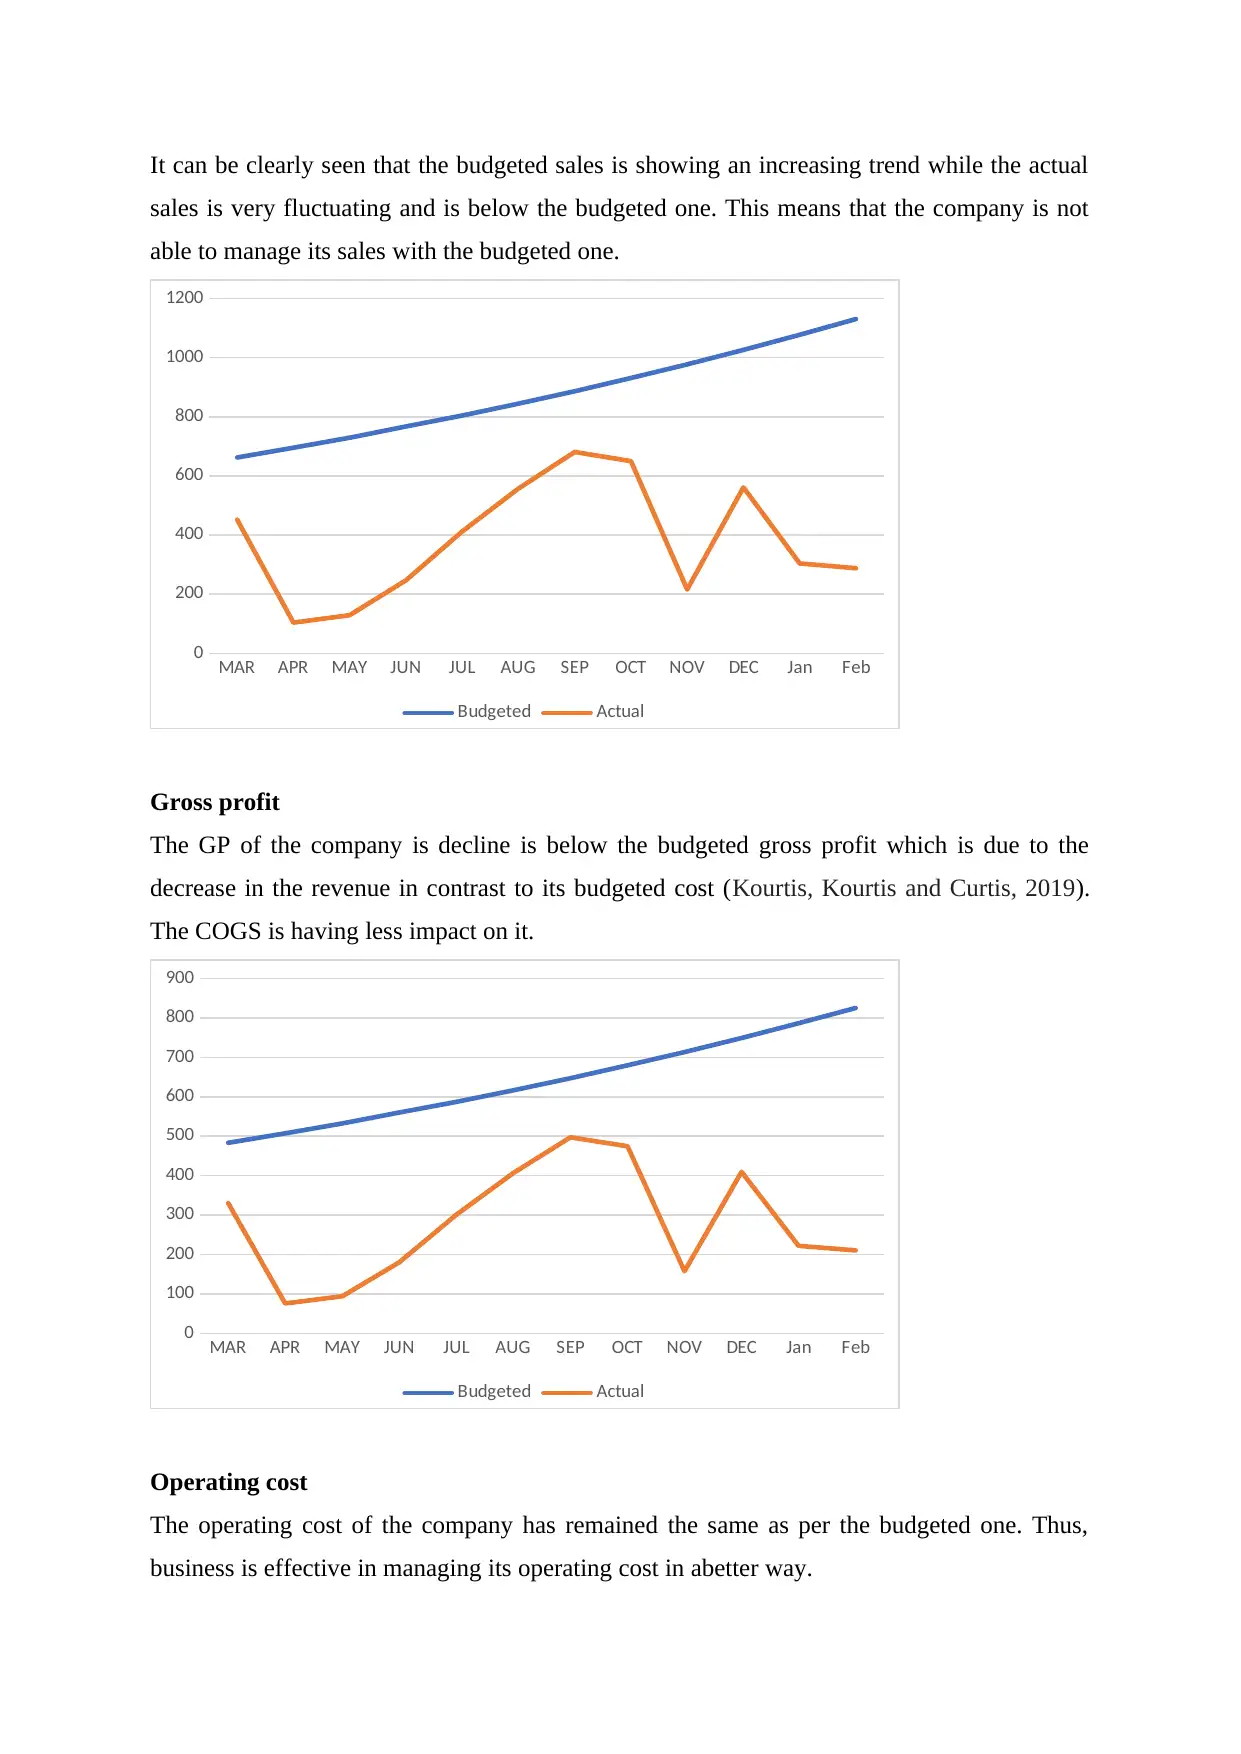
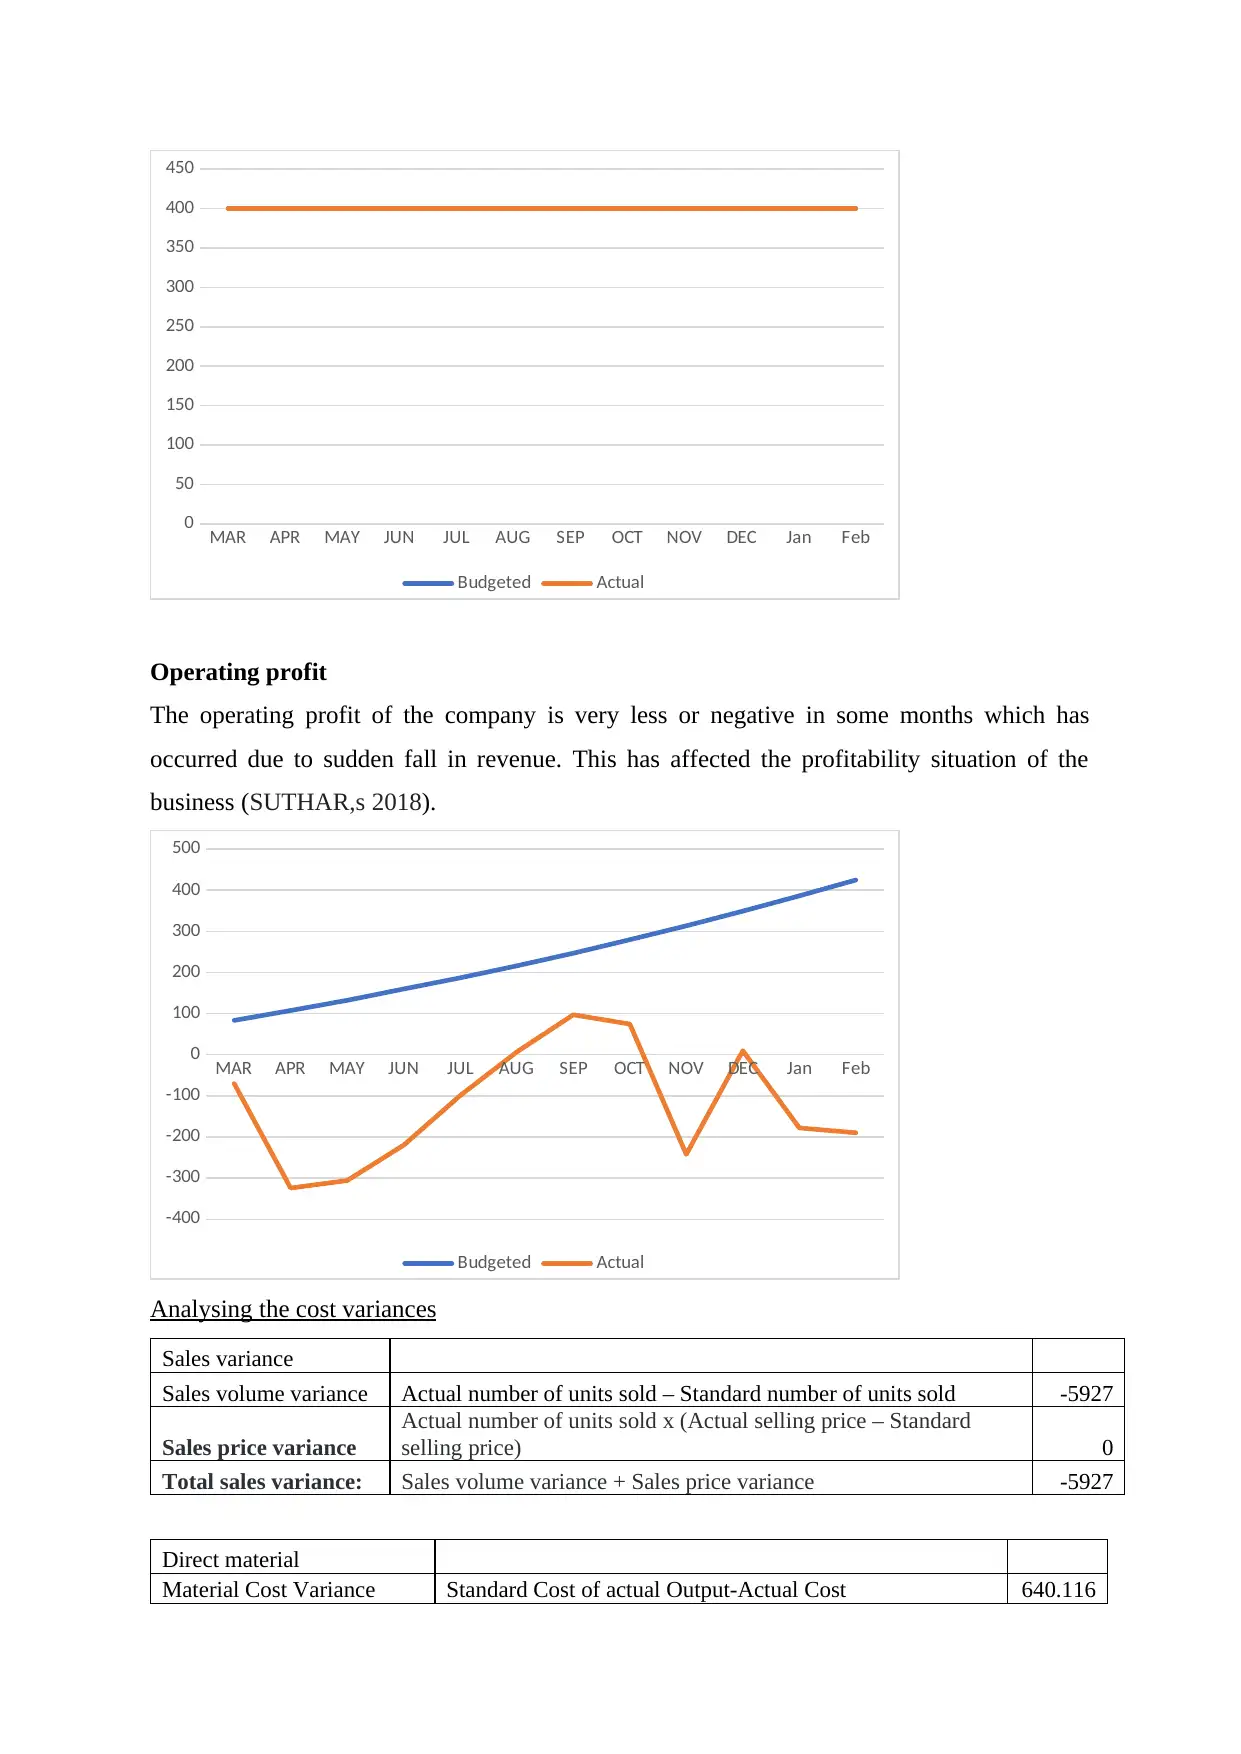
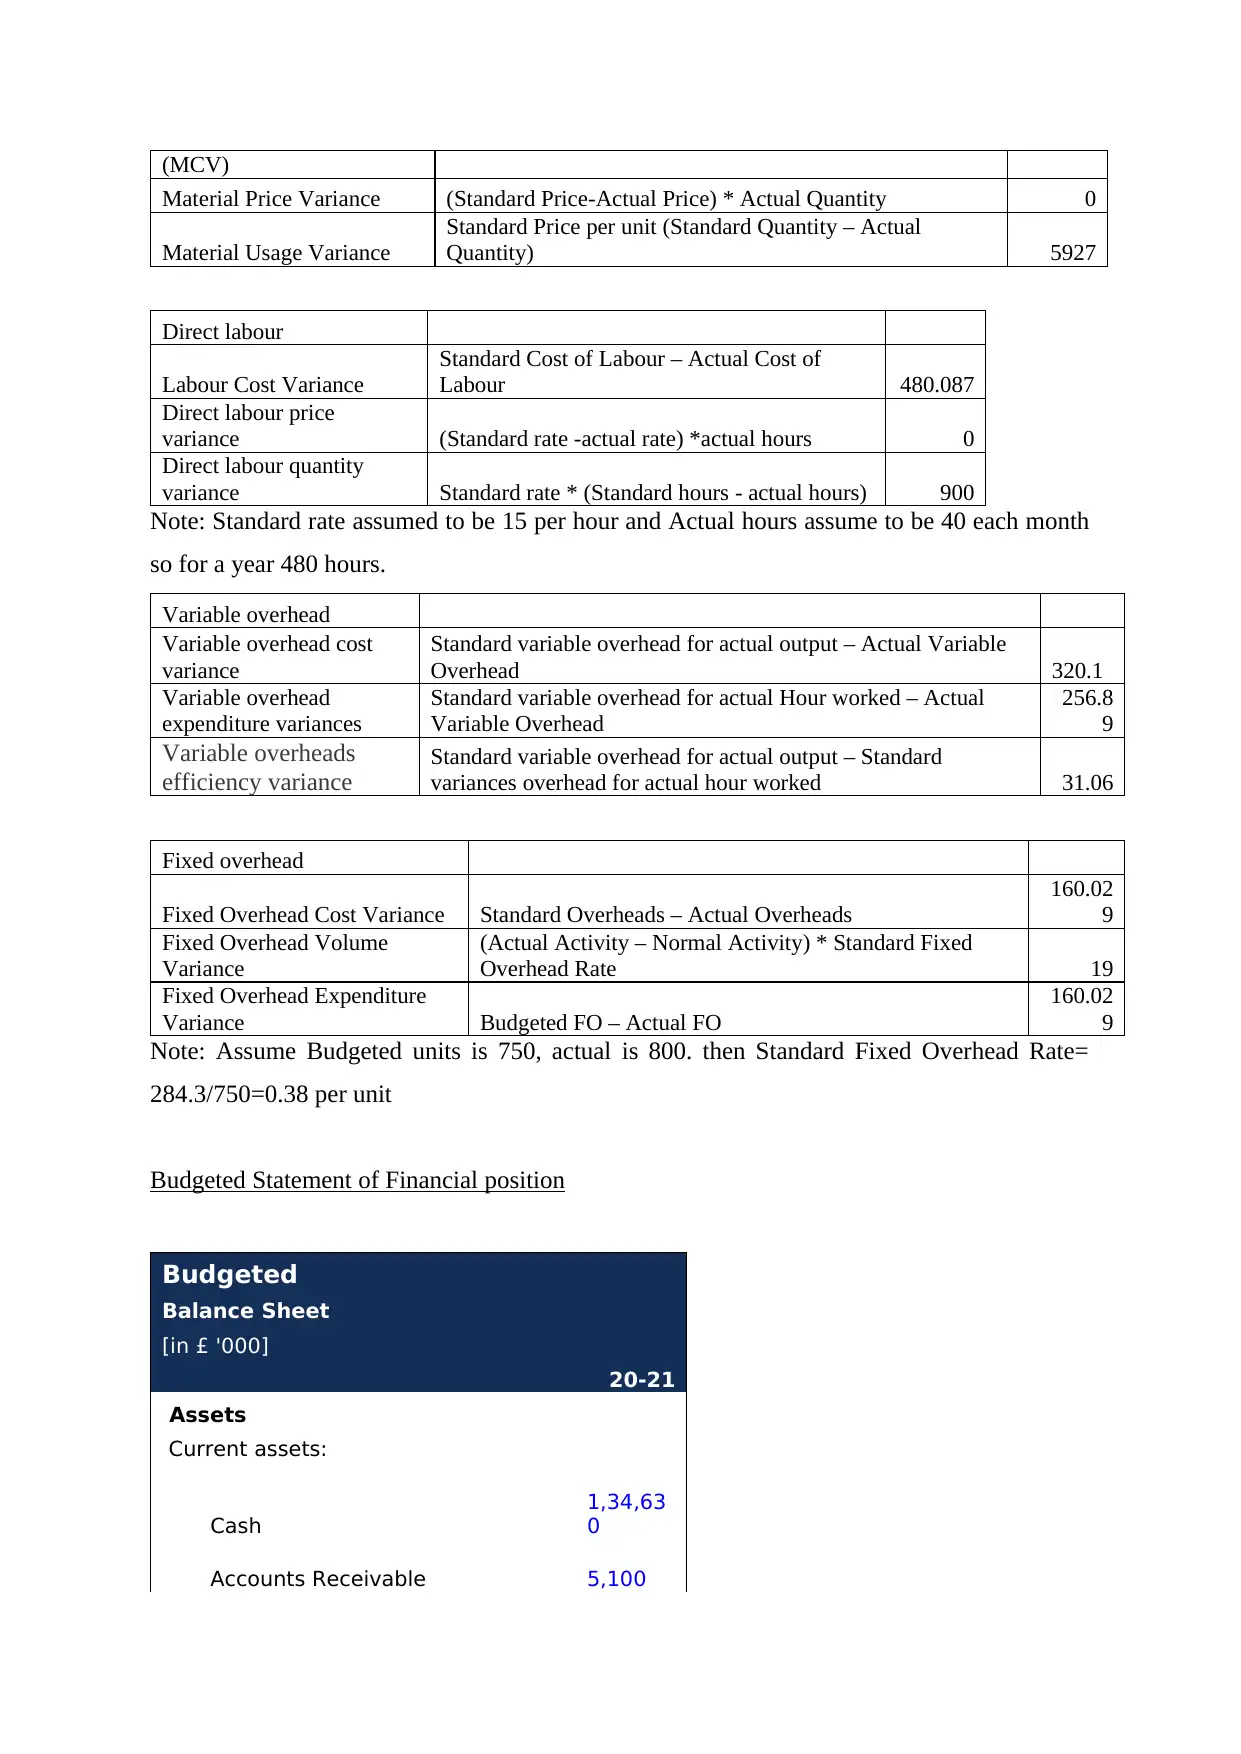
This practical assignment provides a comprehensive financial analysis of a business, comparing budgeted and actual performance over a 12-month period. It includes budgeted and actual statements of profit and loss, highlighting variances in sales, gross profit, and operating profit. The analysis delves into cost variances for direct materials, direct labor, and overhead, alongside a review of budgeted and actual statements of financial position. Key financial ratios are calculated and compared, revealing insights into profitability, liquidity, activity, and risk. The report identifies the company's inability to meet budgeted targets, manage debt effectively, and maintain consistent sales, ultimately affecting its market position. Desklib offers this and similar solved assignments to aid students in their studies.
Contribute Materials
Your contribution can guide someone’s learning journey. Share your
documents today.

Business Planning : practical
Examination
Examination
Secure Best Marks with AI Grader
Need help grading? Try our AI Grader for instant feedback on your assignments.

TABLE OF CONTENTS
Report summary.....................................................................................................................3
Budgeted Statement of Profit and Loss..................................................................................3
Actual Statement of Profit and Loss......................................................................................4
Relative Size of budgeted costs..............................................................................................5
Relative Size of actual costs...................................................................................................5
Comparison between actual and budgeted performance........................................................5
Analysing the cost variances..................................................................................................7
Budgeted Statement of Financial position.............................................................................8
Actual Statement of Financial position..................................................................................9
Ratio analysis.......................................................................................................................11
Comparison of ratios between budgeted and actual figures.................................................12
REFERENCES.........................................................................................................................14

Report summary
Based upon, the findings, it has been identified that the over the period of 12
months, the performance of the company is not good which has resulted into affecting the
positioning of the company in the market. In terms of profitability, the company has not been
able to manage it and achieve the desired budgeted amount. In addition to this, the debt
composition in the capital structure of the company is also not very good. Also, the it clearly
states about the inability of the company to meet with its budget. It clearly depicts that either
the management was not effective in carrying out the budgeting practices effectively which
has resulted into making it unachievable for the company. Along with the same, the there has
been a huge variance between the actual and budgeted outcomes of the financial results. The
company has not been able to meet with its budgeted revenue and it is having high difference
and sudden fall.
Budgeted Statement of Profit and Loss
Budgeted
Profit and Loss (P&L) Statement
[in £ '000]
MAR APR MAY JUN JUL AUG
Revenue from sales 662.0 695.0 729.0 767.0 804.0 844.0 88
Total Net Revenue 662.0 695.0 729.0 767.0 804.0 844.0 88
Less: Cost of Goods Sold 178.7 187.7 196.8 207.1 217.1 227.9 23
Direct material 71.5 75.1 78.7 82.8 86.8 91.2 95
Direct labour 53.6 56.3 59.0 62.1 65.1 68.4 71
Variable overheads 35.7 37.5 39.4 41.4 43.4 45.6 47
Fixed overheads 17.87 18.77 19.68 20.71 21.71 22.79 23
Gross Profit 483.3 507.4 532.2 559.9 586.9 616.1 64
Expenses
Administrative costs 80.0 80.0 80.0 80.0 80.0 80.0 80
Distribution costs 90.0 90.0 90.0 90.0 90.0 90.0 90
Selling cost 230.0 230.0 230.0 230.0 230.0 230.0 23
Total Expenses 400.0 400.0 400.0 400.0 400.0 400.0 40

Operating profit (Earnings
Before Interest & Taxes) 83.3 107.4 132.2 159.9 186.9 216.1 24
Finance Cost 5.0 5.0 5.0 5.0 5.0 5.0 5.
Earnings Before Taxes 78.3 102.4 127.2 154.9 181.9 211.1 24
Income Taxes 23.5 30.7 38.2 46.5 54.6 63.3 72
Profit After taxes 54.8 71.6 89.0 108.4 127.3 147.8 16
Actual Statement of Profit and Loss
Actual
Profit and Loss (P&L) Statement
[in £ '000]
MAR APR MAY JUN JUL AUG
Revenue from sales 452.0 104.0 129.0 247.0 412.0 557.0 6
Total Net Revenue 452.0 104.0 129.0 247.0 412.0 557.0 6
Less: Cost of Goods Sold 122.0 28.1 34.8 66.7 111.2 150.4 1
Direct material 48.8 11.2 13.9 26.7 44.5 60.2 7
Direct labour 36.6 8.4 10.4 20.0 33.4 45.1 5
Variable overheads 24.4 5.6 7.0 13.3 22.2 30.1 3
Fixed overheads 12.20 2.81 3.48 6.67 11.12 15.04 1
Gross Profit 330.0 75.9 94.2 180.3 300.8 406.6 4
Expenses
Administrative costs 80.0 80.0 80.0 80.0 80.0 80.0 8
Distribution costs 90.0 90.0 90.0 90.0 90.0 90.0 9
Selling cost 230.0 230.0 230.0 230.0 230.0 230.0 2
Total Expenses 400.0 400.0 400.0 400.0 400.0 400.0 4
Operating profit (Earnings
Before Interest & Taxes) (70.0) (324.1) (305.8) (219.7) (99.2) 6.6 9
Finance Cost 5.0 5.0 5.0 5.0 5.0 5.0 5
Earnings Before Taxes
Secure Best Marks with AI Grader
Need help grading? Try our AI Grader for instant feedback on your assignments.

(75.0) (329.1) (310.8) (224.7) (104.2) 1.6 9
Income Taxes (22.5) (98.7) (93.2) (67.4) (31.3) 0.5 2
Profit After taxes (52.5) (230.4) (217.6) (157.3) (73.0) 1.1 6
Relative Size of budgeted costs
11%
8%
5%
3%
9%10%
26%
Relative size of budgeted costs
Direct material Direct labour Variable overheads
Fixed overheads Administrative costs Distribution costs
Selling cost
Relative Size of actual costs
11%
8%
5%
3%
9%10%
26%
Relative size of budgeted costs
Direct material Direct labour Variable overheads
Fixed overheads Administrative costs Distribution costs
Selling cost
Comparison between actual and budgeted performance
Sales

It can be clearly seen that the budgeted sales is showing an increasing trend while the actual
sales is very fluctuating and is below the budgeted one. This means that the company is not
able to manage its sales with the budgeted one.
MAR APR MAY JUN JUL AUG SEP OCT NOV DEC Jan Feb
0
200
400
600
800
1000
1200
Budgeted Actual
Gross profit
The GP of the company is decline is below the budgeted gross profit which is due to the
decrease in the revenue in contrast to its budgeted cost (Kourtis, Kourtis and Curtis, 2019).
The COGS is having less impact on it.
MAR APR MAY JUN JUL AUG SEP OCT NOV DEC Jan Feb
0
100
200
300
400
500
600
700
800
900
Budgeted Actual
Operating cost
The operating cost of the company has remained the same as per the budgeted one. Thus,
business is effective in managing its operating cost in abetter way.

MAR APR MAY JUN JUL AUG SEP OCT NOV DEC Jan Feb
0
50
100
150
200
250
300
350
400
450
Budgeted Actual
Operating profit
The operating profit of the company is very less or negative in some months which has
occurred due to sudden fall in revenue. This has affected the profitability situation of the
business (SUTHAR,s 2018).
MAR APR MAY JUN JUL AUG SEP OCT NOV DEC Jan Feb
-400
-300
-200
-100
0
100
200
300
400
500
Budgeted Actual
Analysing the cost variances
Sales variance
Sales volume variance Actual number of units sold – Standard number of units sold -5927
Sales price variance
Actual number of units sold x (Actual selling price – Standard
selling price) 0
Total sales variance: Sales volume variance + Sales price variance -5927
Direct material
Material Cost Variance Standard Cost of actual Output-Actual Cost 640.116
0
50
100
150
200
250
300
350
400
450
Budgeted Actual
Operating profit
The operating profit of the company is very less or negative in some months which has
occurred due to sudden fall in revenue. This has affected the profitability situation of the
business (SUTHAR,s 2018).
MAR APR MAY JUN JUL AUG SEP OCT NOV DEC Jan Feb
-400
-300
-200
-100
0
100
200
300
400
500
Budgeted Actual
Analysing the cost variances
Sales variance
Sales volume variance Actual number of units sold – Standard number of units sold -5927
Sales price variance
Actual number of units sold x (Actual selling price – Standard
selling price) 0
Total sales variance: Sales volume variance + Sales price variance -5927
Direct material
Material Cost Variance Standard Cost of actual Output-Actual Cost 640.116
Paraphrase This Document
Need a fresh take? Get an instant paraphrase of this document with our AI Paraphraser

(MCV)
Material Price Variance (Standard Price-Actual Price) * Actual Quantity 0
Material Usage Variance
Standard Price per unit (Standard Quantity – Actual
Quantity) 5927
Direct labour
Labour Cost Variance
Standard Cost of Labour – Actual Cost of
Labour 480.087
Direct labour price
variance (Standard rate -actual rate) *actual hours 0
Direct labour quantity
variance Standard rate * (Standard hours - actual hours) 900
Note: Standard rate assumed to be 15 per hour and Actual hours assume to be 40 each month
so for a year 480 hours.
Variable overhead
Variable overhead cost
variance
Standard variable overhead for actual output – Actual Variable
Overhead 320.1
Variable overhead
expenditure variances
Standard variable overhead for actual Hour worked – Actual
Variable Overhead
256.8
9
Variable overheads
efficiency variance
Standard variable overhead for actual output – Standard
variances overhead for actual hour worked 31.06
Fixed overhead
Fixed Overhead Cost Variance Standard Overheads – Actual Overheads
160.02
9
Fixed Overhead Volume
Variance
(Actual Activity – Normal Activity) * Standard Fixed
Overhead Rate 19
Fixed Overhead Expenditure
Variance Budgeted FO – Actual FO
160.02
9
Note: Assume Budgeted units is 750, actual is 800. then Standard Fixed Overhead Rate=
284.3/750=0.38 per unit
Budgeted Statement of Financial position
Budgeted
Balance Sheet
[in £ '000]
20-21
Assets
Current assets:
Cash
1,34,63
0
Accounts Receivable 5,100

Prepaid expenses 4,805
Accrued income 20,000
Inventory 7,805
Total current assets
1,72,34
0
Land & building 45,500
Plant & machinery 3,580
Total Assets
2,21,42
0
Liabilities
Current liabilities:
Accounts Payable 3,902
Accrued expenses 2,000
Deferred income 1,540
Total current liabilities 7,442
Non-Current liabilities
Long-term bank loan 42,000
Total Liabilities 49,442
Shareholder's Equity
Equity Capital
1,70,00
0
Retained Earnings 1,978
Shareholder's Equity
1,71,97
8
Total Liabilities & Shareholder's
Equity
2,21,42
0
Actual Statement of Financial position

Actual
Balance Sheet
[in £ '000]
20-21
Assets
Current assets:
Cash
1,31,70
2
Accounts Receivable 5,000
Prepaid expenses 4,805
Accrued income 20,000
Inventory 7,805
Total current assets
1,69,31
2
Land & building 45,500
Plant & machinery 3,580
Total Assets
2,18,39
2
Liabilities
Current liabilities:
Accounts Payable 3,902
Accrued expenses 2,000
Deferred income 1,540
Total current liabilities 7,442
Non-Current liabilities
Long-term bank loan 42,000
Total Liabilities 49,442
Shareholder's Equity
Equity Capital
1,70,00
0
Secure Best Marks with AI Grader
Need help grading? Try our AI Grader for instant feedback on your assignments.

Retained Earnings (1,051)
Shareholder's Equity
1,68,94
9
Total Liabilities & Shareholder's
Equity
2,18,39
1
Ratio analysis
Ratio Analysis 2020-21 2020-21
PROFITABILITY Budgeted Actual
NET PROFIT MARGIN
NET PROFIT 1,978 -1,051
REVENUES 10,528
18.79
% 4,601
-
22.84%
Gross profit margin GROSS PROFIT 7,685 3,359
REVENUES 10,528
73.00
% 4,601 73.00%
RETURN ON
INVESTMENT OPERATING PROFIT (LOSS) 2,885
-
1,441
TOTAL ASSETS 2,21,420 1.30% 2,18,392 -0.66%
Operating profit margin OPERATING PROFIT (LOSS) 2,885
-
1,441
-
0.3133
REVENUES 10,528
27.41
% 4,601
-
31.33%
LIQUIDITY
CURRENT RATIO = CURRENT ASSETS 1,72,340 1,69,312
CURRENT LIABILITIES 7,442 23.16 7,442 22.75
QUICK RATIO = RECEIVABLES AND CASH 1,64,535 1,61,507
CURRENT LIABILITIES 7,442 22.11 7,442 21.70
EFFICIENCY
WC TURNOVER = REVENUES 10,528 4,601
WORKING CAPITAL 1,64,898 0.06 1,61,869 0.03
TOTAL ASSET
TURNOVER RATIO
SALES 10,528 4,601
TOTAL ASSETS 2,21,420 0.05 2,18,392 0.02
FIXED ASSET TURNOVER
=
REVENUES 10,528 4,601
FIXED ASSETS 49,080 0.21 49,080 0.09
INVESTMENT

RETURN ON EQUITY NET INCOME 1,978
-
1,051
SHAREHOLDER'S EQUITY 14,587
13.56
% 1,68,949 -0.62%
DEBT TO EQUITY = NC LIAB + C LIAB 42,000 42,000
SHAREHOLDER'S EQUITY 1,71,978
24.42
% 1,68,949 24.86%
Comparison of ratios between budgeted and actual figures
Profitability Ratios
On account of NP margin, it has been a loss as against the profit budgeted. Also, the GP
margin ratio has remained the same which means that there is a same proportion of change in
GP (Ishak, Nasir, Ismail and Hashim, 2017). The operating profit margin and ROI is negative
which is due to reduction in revenue and the loss incurred by the organization.
Budgeted
Actual
-40.00% -20.00% 0.00% 20.00% 40.00% 60.00% 80.00%
18.79%
-22.84%
73.00%
73.00%
1.30%
-0.66%
27.41%
-31.33%
OPERATING PROFIT MARGIN RETURN ON INVESTMENT
GROSS PROFIT MARGIN NET PROFIT MARGIN
Liquidity ratios
The liquidity position of the company is very serious nad vulnerable a sit is much higher then
the ideal ratio. This means that the company is having huge amount of ideal funds, not
generating any return.

Activity ratios
In terms of activity ratios, the company has performed very low in comparison to the
budgeted one. This indicates the inability of the company to meet with the required level of
efficiency (Islami and Rio, 2019).
Budgeted
Actual
0.00 0.05 0.10 0.15 0.20 0.25
FIXED ASSET TURNOVER TOTAL ASSET TURNOVER RATIO
WC TURNOVER
Risk ratios
The company is being generating loss which has affected its ability to provide higher return
to its equity holders. Also, the proportion of the debt to equity is moderate but the company
should try to reduce it further as looking at its current situation.
Paraphrase This Document
Need a fresh take? Get an instant paraphrase of this document with our AI Paraphraser

RETURN ON EQUITY
DEBT TO EQUITY
-5.00% 0.00% 5.00% 10.00% 15.00% 20.00% 25.00% 30.00%
Actual Budgeted
DEBT TO EQUITY
-5.00% 0.00% 5.00% 10.00% 15.00% 20.00% 25.00% 30.00%
Actual Budgeted
1 out of 14
Related Documents

Your All-in-One AI-Powered Toolkit for Academic Success.
 +13062052269
info@desklib.com
Available 24*7 on WhatsApp / Email
Unlock your academic potential
© 2024  |  Zucol Services PVT LTD  |  All rights reserved.