Managerial Finance Report: Financial Performance and Stock Analysis
VerifiedAdded on 2020/07/22
|16
|3505
|67
Report
AI Summary
This report provides a comprehensive analysis of managerial finance, focusing on the financial performance of Grand Central Enterprise Berhad (GCE) and Landmark Berhad, both operating in the hotel industry. The first part of the report uses ratio analysis to compare the financial performance of the two companies over the fiscal years 2015 and 2016, examining revenue, profitability, liquidity, solvency, efficiency, and investment performance. The second part delves into stock valuation, exploring methods like the Capital Asset Pricing Model (CAPM) to determine the required rate of return, and the Gordon growth model to calculate expected dividend streams, current stock prices, and future stock values. The report also discusses the limitations of ratio analysis and provides insights into the valuation of stocks regardless of dividend patterns. Detailed calculations and figures are included to support the analysis, providing a thorough understanding of financial management and stock valuation techniques.
Contribute Materials
Your contribution can guide someone’s learning journey. Share your
documents today.
MANAGERIAL
FINANCE
FINANCE
Secure Best Marks with AI Grader
Need help grading? Try our AI Grader for instant feedback on your assignments.
Table of Contents
INTRODUCTION...........................................................................................................................1
PART 1............................................................................................................................................1
PART 2............................................................................................................................................6
A. Stock valuation regardless dividend pattern...........................................................................6
B. Calculation of required rate of return......................................................................................6
C. (i) Calculation of expected dividend stream............................................................................7
C. (ii) Calculation of firm’s current stock price...........................................................................8
C. (iii) Calculation of stock’s expected value 1 year from now..................................................8
D. Expected rate of return of stock..............................................................................................9
E. Calculation of stock’s current value........................................................................................9
F. Selling price at a 5% constant decline in earnings.................................................................10
G. Possible issues in dividend discounted method in stock valuation and suggesting an
alternative...................................................................................................................................10
CONCLUSION..............................................................................................................................11
REFERENCES..............................................................................................................................12
List of Figures
Figure 1 Revenue of Grand Central Enterprise Bhd for FY 2015..................................................2
Figure 2Revenue of Grand Central Enterprise Bhd for FY 2016...................................................3
Figure 3 Revenue of GCE Enterprise and Land mark for FY 2015 and 2016................................3
Figure 4 Revenue of GCE Enterprise and Land mark for FY 2015 and 2016................................4
INTRODUCTION
Financial management is a specific branch of finance that specializes in acquisition,
collection, utilization, management and control of funds or capital with the aim to attain financial
goals. Grand Central Enterprise Berhad (GCE) is engaged in hotel business, limousine and hotel
management facilities. Landmark Berhad was established with the key intention to deliver and
integrate multiple of activities to provide the best consumer experience. This paper will
investigate and compare both hoteliers financial performance for the two latest fiscal years, 2015
and 2016 by different ratios. Second part of the report will present stock valuation approaches
with necessary computations.
PART 1
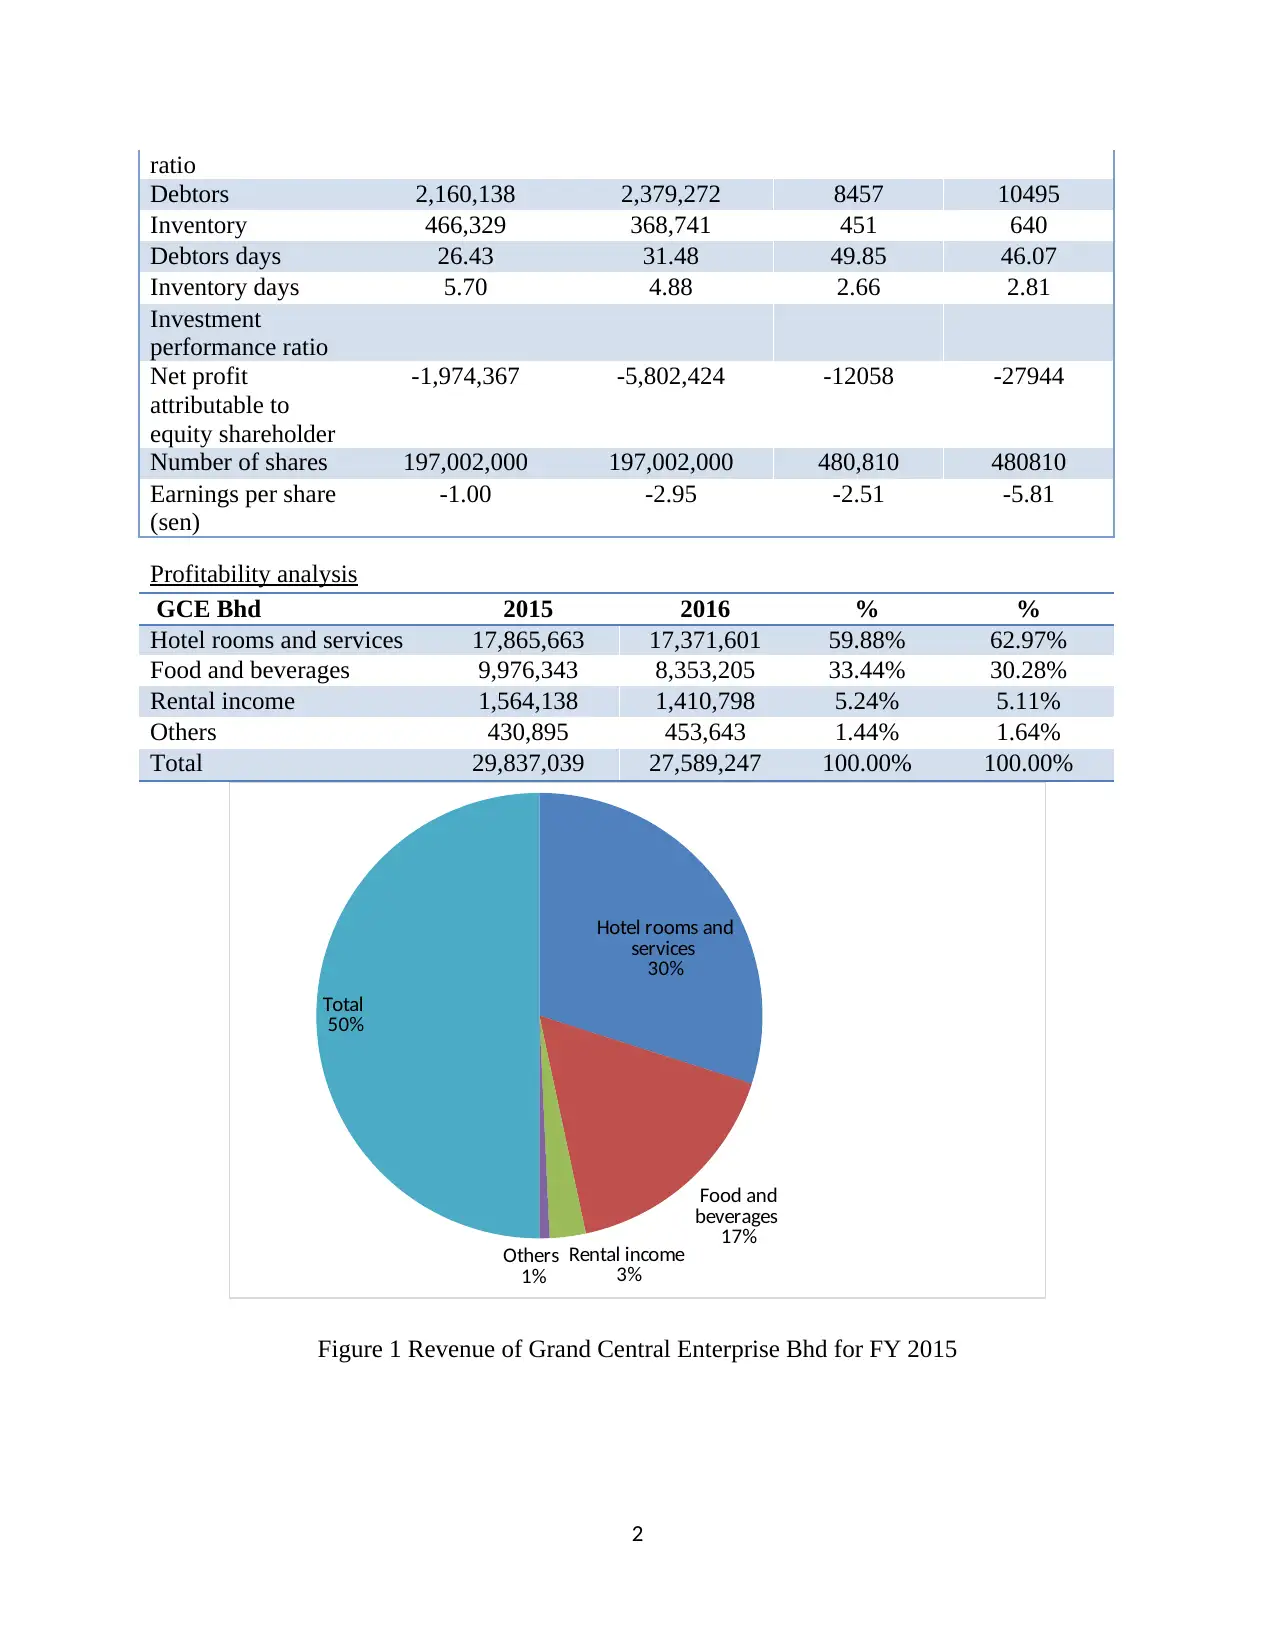
Calculations of ratios
Items Grand Central Enterprise (GCE) In
RM Except EPS
LandMark Berhad (In
RM000) except EPS
2015 2016 2015 2016
Revenue 29837039 27589247 61920 83158
Operating
profit/loss
-1,599,660 -3,203,846 -19,501 -37403
Net profit/loss -1,896,482 -5,758,114 -12058 -27944
Operating margin -5.36% -11.61% -31.49% -44.98%
Net margin -6.36% -20.87% -19.47% -33.60%
Liquidity ratio
Current assets 77,090,900 73,474,501 145,287 123103
Current liabilities 5,293,469 5,563,394 32,848 47928
Current ratio 14.56 13.21 4.42 2.57
Inventory 466,329 368,741 451 640
Quick ratio 14.48 13.14 4.41 2.56
Solvency ratio
Long-term debts 0 0 70183 57430
Shareholders’
equity
17,856,919 17,196,081 1774162 1747212
Financial leverage 0.00 0.00 0.04 0.03
Finance costs 706 4607 5187 4080
EBIT -1,599,660 -3,203,846 -19,501 -37,403
Interest bearing
ratio
-2265.807365 -695.4299978 -3.759591286 -9.167401961
Activity/efficiency
1
Financial management is a specific branch of finance that specializes in acquisition,
collection, utilization, management and control of funds or capital with the aim to attain financial
goals. Grand Central Enterprise Berhad (GCE) is engaged in hotel business, limousine and hotel
management facilities. Landmark Berhad was established with the key intention to deliver and
integrate multiple of activities to provide the best consumer experience. This paper will
investigate and compare both hoteliers financial performance for the two latest fiscal years, 2015
and 2016 by different ratios. Second part of the report will present stock valuation approaches
with necessary computations.
PART 1
Calculations of ratios
Items Grand Central Enterprise (GCE) In
RM Except EPS
LandMark Berhad (In
RM000) except EPS
2015 2016 2015 2016
Revenue 29837039 27589247 61920 83158
Operating
profit/loss
-1,599,660 -3,203,846 -19,501 -37403
Net profit/loss -1,896,482 -5,758,114 -12058 -27944
Operating margin -5.36% -11.61% -31.49% -44.98%
Net margin -6.36% -20.87% -19.47% -33.60%
Liquidity ratio
Current assets 77,090,900 73,474,501 145,287 123103
Current liabilities 5,293,469 5,563,394 32,848 47928
Current ratio 14.56 13.21 4.42 2.57
Inventory 466,329 368,741 451 640
Quick ratio 14.48 13.14 4.41 2.56
Solvency ratio
Long-term debts 0 0 70183 57430
Shareholders’
equity
17,856,919 17,196,081 1774162 1747212
Financial leverage 0.00 0.00 0.04 0.03
Finance costs 706 4607 5187 4080
EBIT -1,599,660 -3,203,846 -19,501 -37,403
Interest bearing
ratio
-2265.807365 -695.4299978 -3.759591286 -9.167401961
Activity/efficiency
1
ratio
Debtors 2,160,138 2,379,272 8457 10495
Inventory 466,329 368,741 451 640
Debtors days 26.43 31.48 49.85 46.07
Inventory days 5.70 4.88 2.66 2.81
Investment
performance ratio
Net profit
attributable to
equity shareholder
-1,974,367 -5,802,424 -12058 -27944
Number of shares 197,002,000 197,002,000 480,810 480810
Earnings per share
(sen)
-1.00 -2.95 -2.51 -5.81
Profitability analysis
GCE Bhd 2015 2016 % %
Hotel rooms and services 17,865,663 17,371,601 59.88% 62.97%
Food and beverages 9,976,343 8,353,205 33.44% 30.28%
Rental income 1,564,138 1,410,798 5.24% 5.11%
Others 430,895 453,643 1.44% 1.64%
Total 29,837,039 27,589,247 100.00% 100.00%
Hotel rooms and
services
30%
Food and
beverages
17%
Rental income
3%
Others
1%
Total
50%
Figure 1 Revenue of Grand Central Enterprise Bhd for FY 2015
2
Secure Best Marks with AI Grader
Need help grading? Try our AI Grader for instant feedback on your assignments.
Hotel rooms and
services
63%
Food and beverages
30%
Rental income
5%
Others
2%
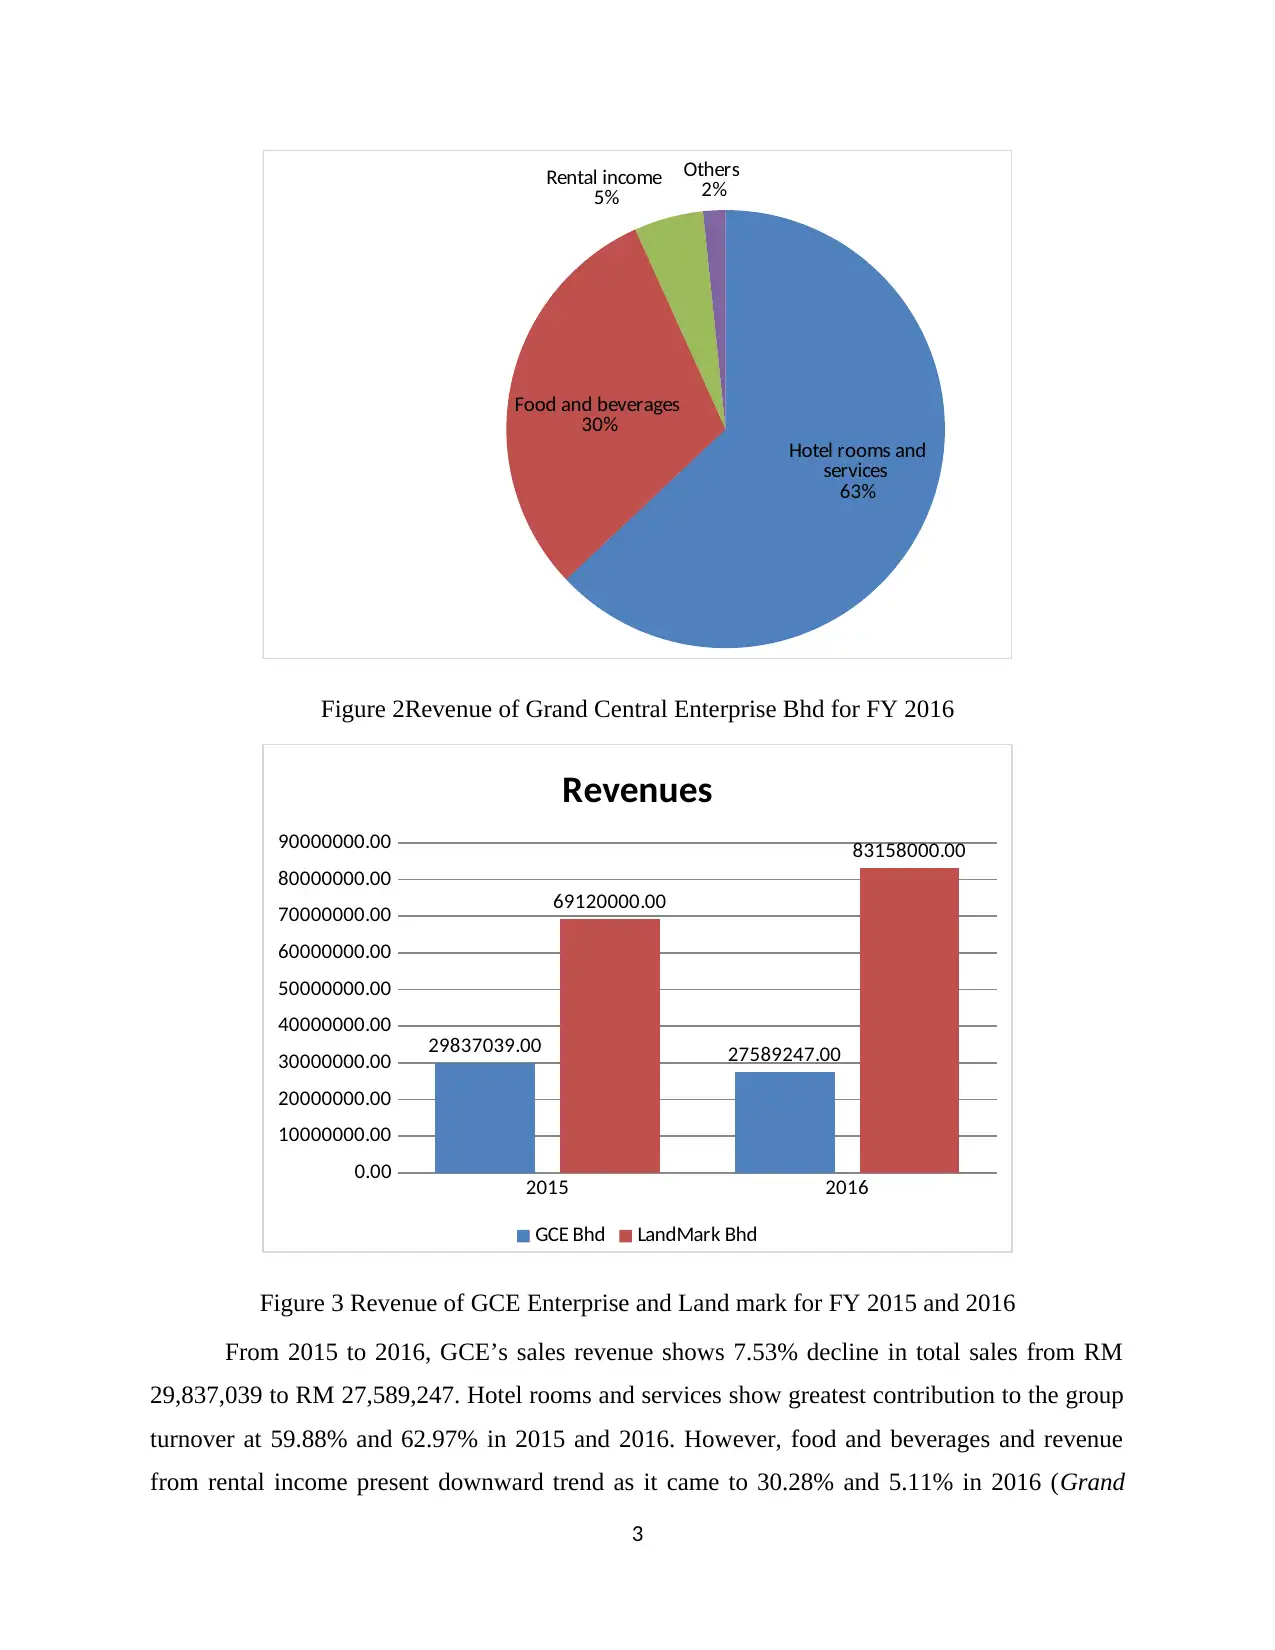
Figure 2Revenue of Grand Central Enterprise Bhd for FY 2016
2015 2016
0.00
10000000.00
20000000.00
30000000.00
40000000.00
50000000.00
60000000.00
70000000.00
80000000.00
90000000.00
29837039.00 27589247.00
69120000.00
83158000.00
Revenues
GCE Bhd LandMark Bhd
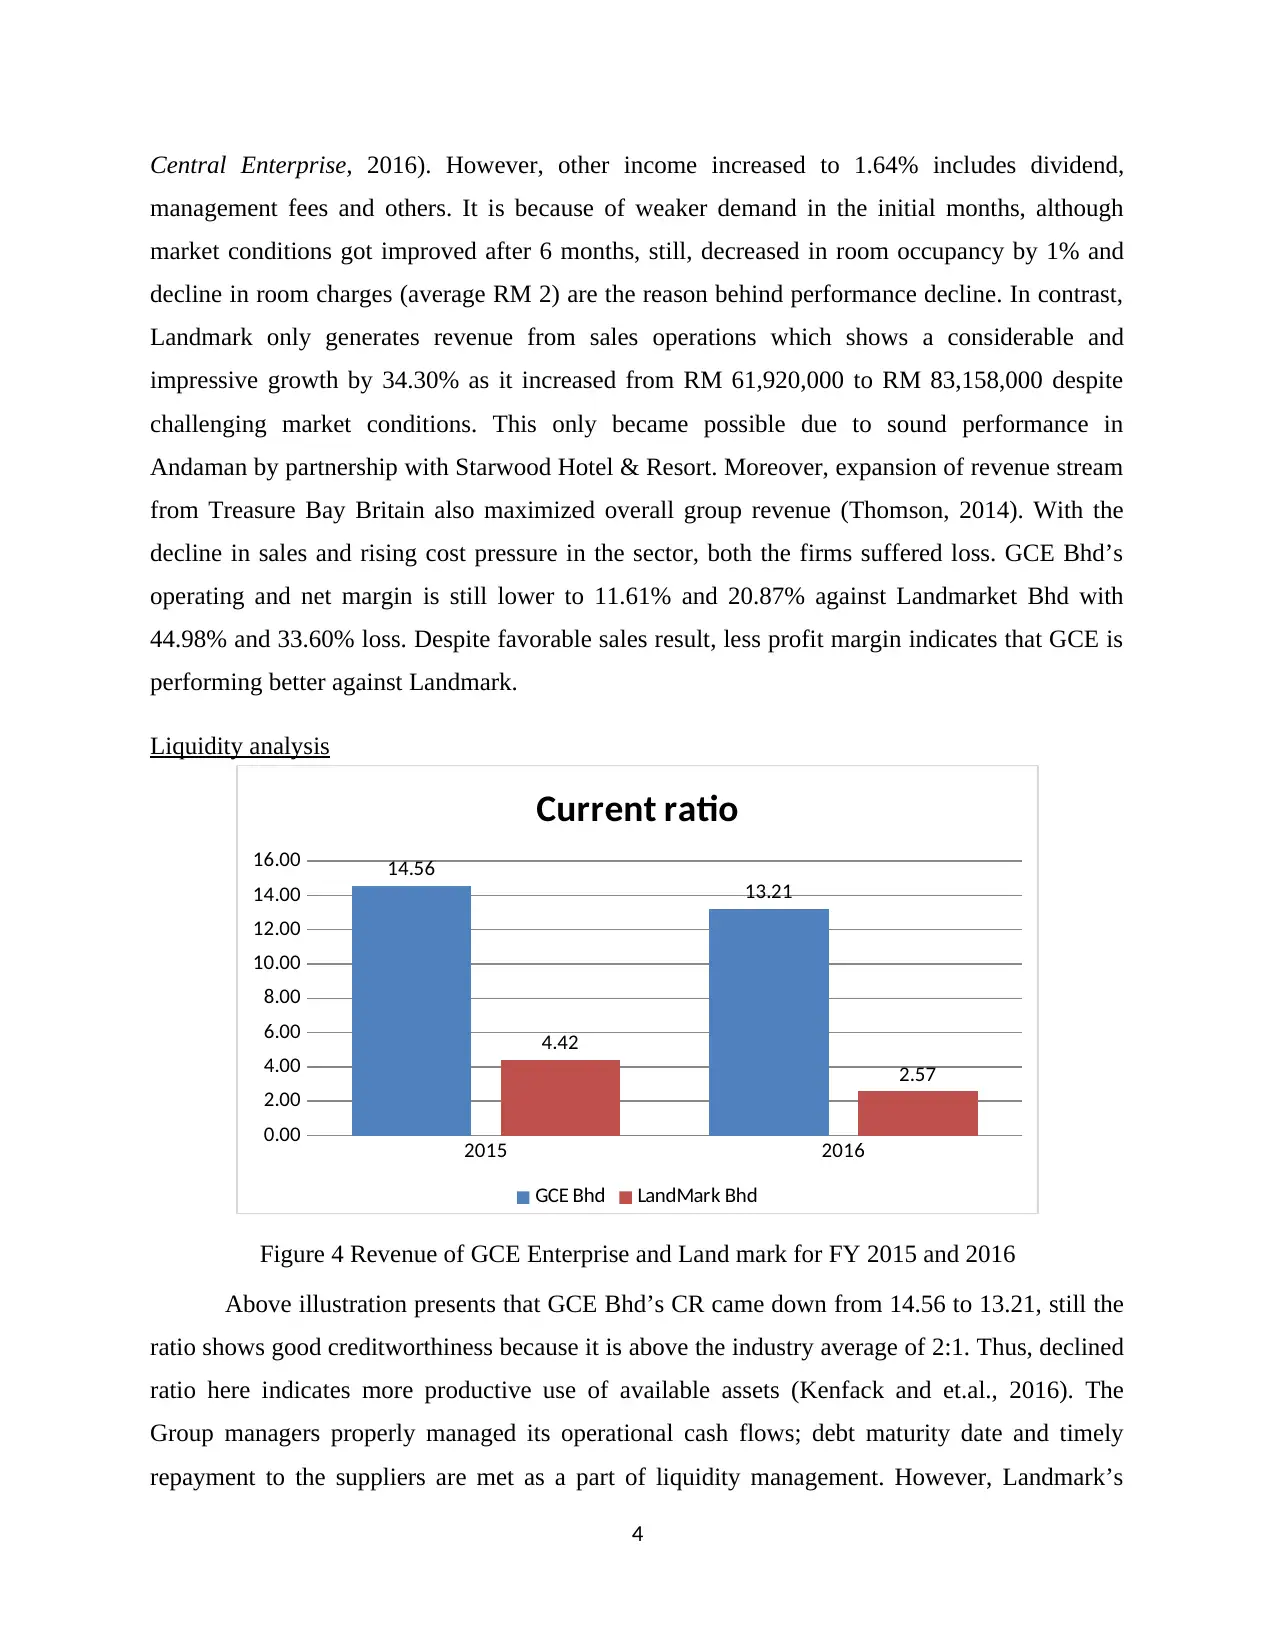
Figure 3 Revenue of GCE Enterprise and Land mark for FY 2015 and 2016
From 2015 to 2016, GCE’s sales revenue shows 7.53% decline in total sales from RM
29,837,039 to RM 27,589,247. Hotel rooms and services show greatest contribution to the group
turnover at 59.88% and 62.97% in 2015 and 2016. However, food and beverages and revenue
from rental income present downward trend as it came to 30.28% and 5.11% in 2016 (Grand
3
services
63%
Food and beverages
30%
Rental income
5%
Others
2%
Figure 2Revenue of Grand Central Enterprise Bhd for FY 2016
2015 2016
0.00
10000000.00
20000000.00
30000000.00
40000000.00
50000000.00
60000000.00
70000000.00
80000000.00
90000000.00
29837039.00 27589247.00
69120000.00
83158000.00
Revenues
GCE Bhd LandMark Bhd
Figure 3 Revenue of GCE Enterprise and Land mark for FY 2015 and 2016
From 2015 to 2016, GCE’s sales revenue shows 7.53% decline in total sales from RM
29,837,039 to RM 27,589,247. Hotel rooms and services show greatest contribution to the group
turnover at 59.88% and 62.97% in 2015 and 2016. However, food and beverages and revenue
from rental income present downward trend as it came to 30.28% and 5.11% in 2016 (Grand
3
Central Enterprise, 2016). However, other income increased to 1.64% includes dividend,
management fees and others. It is because of weaker demand in the initial months, although
market conditions got improved after 6 months, still, decreased in room occupancy by 1% and
decline in room charges (average RM 2) are the reason behind performance decline. In contrast,
Landmark only generates revenue from sales operations which shows a considerable and
impressive growth by 34.30% as it increased from RM 61,920,000 to RM 83,158,000 despite
challenging market conditions. This only became possible due to sound performance in
Andaman by partnership with Starwood Hotel & Resort. Moreover, expansion of revenue stream
from Treasure Bay Britain also maximized overall group revenue (Thomson, 2014). With the
decline in sales and rising cost pressure in the sector, both the firms suffered loss. GCE Bhd’s
operating and net margin is still lower to 11.61% and 20.87% against Landmarket Bhd with
44.98% and 33.60% loss. Despite favorable sales result, less profit margin indicates that GCE is
performing better against Landmark.
Liquidity analysis
2015 2016
0.00
2.00
4.00
6.00
8.00
10.00
12.00
14.00
16.00 14.56
13.21
4.42
2.57
Current ratio
GCE Bhd LandMark Bhd
Figure 4 Revenue of GCE Enterprise and Land mark for FY 2015 and 2016
Above illustration presents that GCE Bhd’s CR came down from 14.56 to 13.21, still the
ratio shows good creditworthiness because it is above the industry average of 2:1. Thus, declined
ratio here indicates more productive use of available assets (Kenfack and et.al., 2016). The
Group managers properly managed its operational cash flows; debt maturity date and timely
repayment to the suppliers are met as a part of liquidity management. However, Landmark’s
4
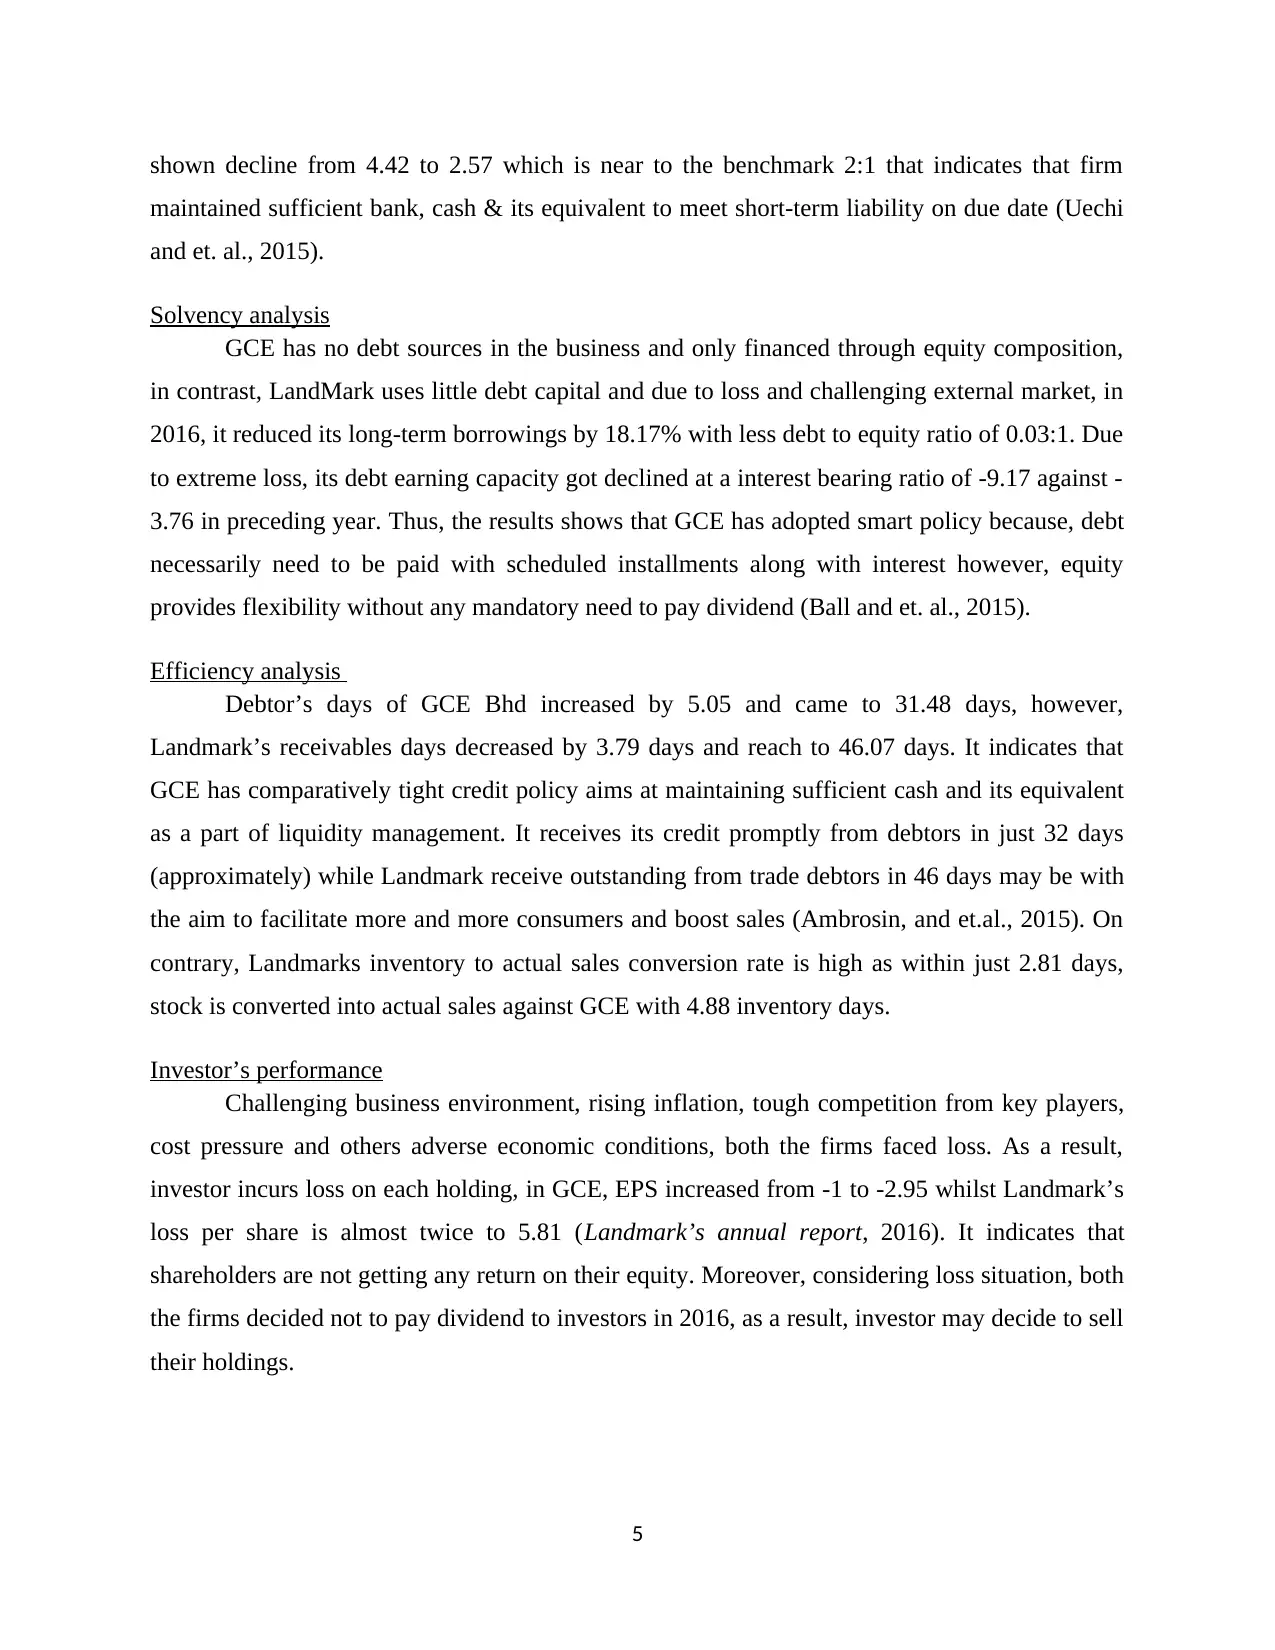
shown decline from 4.42 to 2.57 which is near to the benchmark 2:1 that indicates that firm
maintained sufficient bank, cash & its equivalent to meet short-term liability on due date (Uechi
and et. al., 2015).
Solvency analysis
GCE has no debt sources in the business and only financed through equity composition,
in contrast, LandMark uses little debt capital and due to loss and challenging external market, in
2016, it reduced its long-term borrowings by 18.17% with less debt to equity ratio of 0.03:1. Due
to extreme loss, its debt earning capacity got declined at a interest bearing ratio of -9.17 against -
3.76 in preceding year. Thus, the results shows that GCE has adopted smart policy because, debt
necessarily need to be paid with scheduled installments along with interest however, equity
provides flexibility without any mandatory need to pay dividend (Ball and et. al., 2015).
Efficiency analysis
Debtor’s days of GCE Bhd increased by 5.05 and came to 31.48 days, however,
Landmark’s receivables days decreased by 3.79 days and reach to 46.07 days. It indicates that
GCE has comparatively tight credit policy aims at maintaining sufficient cash and its equivalent
as a part of liquidity management. It receives its credit promptly from debtors in just 32 days
(approximately) while Landmark receive outstanding from trade debtors in 46 days may be with
the aim to facilitate more and more consumers and boost sales (Ambrosin, and et.al., 2015). On
contrary, Landmarks inventory to actual sales conversion rate is high as within just 2.81 days,
stock is converted into actual sales against GCE with 4.88 inventory days.
Investor’s performance
Challenging business environment, rising inflation, tough competition from key players,
cost pressure and others adverse economic conditions, both the firms faced loss. As a result,
investor incurs loss on each holding, in GCE, EPS increased from -1 to -2.95 whilst Landmark’s
loss per share is almost twice to 5.81 (Landmark’s annual report, 2016). It indicates that
shareholders are not getting any return on their equity. Moreover, considering loss situation, both
the firms decided not to pay dividend to investors in 2016, as a result, investor may decide to sell
their holdings.
5
Paraphrase This Document
Need a fresh take? Get an instant paraphrase of this document with our AI Paraphraser
Limitation of Ratio analysis
Although, as per the results, GCE Bhd showed better performance, still, there are many
drawbacks associated with performed ratio analysis.
Quantitative results: One of the most important thing about ratio is that it just
represented quantitative financial outcome whereas there are number of quality factors like
employee excellencies, consumer satisfaction, corporate image, environmental performance,
stakeholder engagement that cannot be examined through ratio (Limitation of ratio analysis,
2017).
No benchmark: There is a ideal ratio for profitability, efficiency and investment
performance. At the same time, interpreting a single ratio is quite difficult because, it cannot be
said that a particular ratio is good or worse.
Backward looking: Both the GCE and Landmark’s investors will be interested in
knowing whether they will get positive return in future or not, however, in these area, ratio does
not provide any assistance because it is backward looking taking that uses historical information
and cannot be used in forward prediction.
Inflation: With the change in period, inflation rate also increases which impact business
sales and profitability to a great extent, thus, in such situation. Financial statements for two
different periods are not comparable.
Change in accounting policies: Both GCE and Landmark may use different policies and
principles of accounting to record their financial activities which affect the quantitative results
reported in annual account (Limitation of ratio analysis, 2017). Thus, financial analysis and
comparison between both without addressing the policies may be misinterpreted and of no use.
PART 2
A. Stock valuation regardless dividend pattern
In financial market, valuation of stock refers to the application of various methods to
determine company’s stock value. The ultimate objective of such valuation is to forecast or
anticipate future prices and judging the impact of movement in stock price over net return. As
per the theories, when a stock is undervalued are bought by the investors whereas overvalued
6
stock are sold because undervalued stock is expected to rise whereas later prices is expected to
fall (Grasse, Whaley and Ihrke, 2016). There are various ways to value any stock such as
discounted cash flow model, marketing multiple method i.e. EPS, DPS, price to earnings and
others. Price to earnings ratio presents relationship between firm’s current share price and
earnings per share, also called price or earning multiple.
Price ¿ earnings ratio : Market value of stock / EPS
Historical P/E ratios are derived by dividing stock’s current price with EPS of latest 4
quarters while forward P/E ratio is used for assessing and predicting future price. It is computed
by dividing current year price with estimated EPS for future. Here, stock price is found by
multiplying predicted EPS with expected P/E ratio.
B. Calculation of required rate of return
In the field of corporate finance, Capital assets pricing model (CAPM) is the best method
that is available to determine required rate of return (RRR) on a stock. It not only determines
return but also take into consideration various risk factors to adjust the potential return. CAPM
takes into consideration risk-free rate, stock volatility and also the market return. Here, volatility
of a stock is measured by beta to assess systematic risk (Baker and Riddick, 2013). It presents
the sensitivity of a security by indicating how more or less a security is volatile against the
market volatility.
Beta >1 = Less volatile stock
Beta < 1 = highly volatile stock
Here, risk-free rate = 5%
Market risk premium = 6% (Rm- Rf)
Beta coefficient = 1.25
Required rate of return=R f + beta( R m−R f )
RRR=R f +(beta∗market risk premium)
RRR=5 %+ 1.25(6 %)
7
RRR=5 %+ 7.5 %
RRR=12.5 %
Thus, according to the outcome, it becomes clear that at 5% risk free rate and 6% risk
premium, expected return on a stock is 12.5%.
C. (i) Calculation of expected dividend stream
As per the scenario, company is a constant growth establishment which dividend is
expected to grow at a constant rate of 5% and its recent year dividend (D0) is $0.30. Gordon
growth model of dividend believes that stock price is greatly affected by the company’s dividend
policy about how much it pays to investors as dividend and also the growth rate in it. Constant
growth model of stock valuation helps to identify the current price of stock taking into account
dividend payment (Tong, Hu and Hu, 2017).
Current dividend ( D 0)$ 0.30
Constant growth rate(G)=5 % per annum
Firm ’s expected dividend=Current dividend∗(1+g)
Year Formula Results
Year 1 0.30*(1+5%) 0.315
Year 2 0.315*(1+5%) 0.33075
Year 3 0.33075*(1+5%) 0.347288
Thus, from the results, it can be seen that expected dividend in the future that the
company will pay to their investors will be $0.315, $0.33075 and $0.347288 respectively. In all
the period, dividend has been increased addressing constant rate of 5%.
C. (ii) Calculation of firm’s current stock price
K – Required rate of return
G – Expected growthrate
C :Current price
current stock price=Current annual dividend (1+ g)/k −g
It also can be expressed in following mathematical equation, presented below:
Price=D 0(1+ g)/(1+ k )+D 0 (1+ g) 2/(1+ k)2+D 0(1+ g)3 /(1+k )3
8
Secure Best Marks with AI Grader
Need help grading? Try our AI Grader for instant feedback on your assignments.
K=12.50 %(Computed earlier )
G=5 %
Price=$ 0.30(1+5 % )/12.50 %−5 %
Price=$ 0.315/ 4.20 %
Price=$ 4.20
According to the outcome, it is identified that currently, company’s stock is trading at a
price of $4.20.
C. (iii) Calculation of stock’s expected value 1 year from now
Current stock price=Current annual dividend (1+g) /k−g
K=12.50 %(Computed earlier )
G=5 %
Price=$ 0.315(1+5 %)/12.50 %−5 %
Price=$ 0.33075/ 4.20 %
Price=$ 4.41
According to the outcome, it is found that after one year, company’s stock is expected to
trade at a price of $4.41.
D. Expected rate of return of stock
Looking to the scenario, if currently stock is traded by the firm at a price of $4.20, then,
the expected rate of return can be computed applying below mentioned formula:
Required rate of return (RRR) = g + Current dividend (1 + g) / Current price
= 5% + $0.30*(1+5%)/$4.20
= 12.50%
According to the reverse calculation using dividend and growth rate, derived required
rate of return (RRR) is 12.50% that is equal to the calculations made earlier. Thus, it can be said
that investors expects a return of 12.50% on the total investment made in the firm.
9
G=5 %
Price=$ 0.30(1+5 % )/12.50 %−5 %
Price=$ 0.315/ 4.20 %
Price=$ 4.20
According to the outcome, it is identified that currently, company’s stock is trading at a
price of $4.20.
C. (iii) Calculation of stock’s expected value 1 year from now
Current stock price=Current annual dividend (1+g) /k−g
K=12.50 %(Computed earlier )
G=5 %
Price=$ 0.315(1+5 %)/12.50 %−5 %
Price=$ 0.33075/ 4.20 %
Price=$ 4.41
According to the outcome, it is found that after one year, company’s stock is expected to
trade at a price of $4.41.
D. Expected rate of return of stock
Looking to the scenario, if currently stock is traded by the firm at a price of $4.20, then,
the expected rate of return can be computed applying below mentioned formula:
Required rate of return (RRR) = g + Current dividend (1 + g) / Current price
= 5% + $0.30*(1+5%)/$4.20
= 12.50%
According to the reverse calculation using dividend and growth rate, derived required
rate of return (RRR) is 12.50% that is equal to the calculations made earlier. Thus, it can be said
that investors expects a return of 12.50% on the total investment made in the firm.
9
E. Calculation of stock’s current value
Gordon dividend model uses compute stock price when there is no growth in the dividend
distribution, constant rate of growth and supernormal growth. If dividend is expected to grow up
at an extreme or super rate them, the model derives expected dividend and discount it to know
their present value (Constant Growth Model, 2017). The process encompasses four steps that are
presented below:
1. Finding out supernormal growth rate in dividend
2. Constant growth rate in dividend
3. Discounting to reflect current value
4. Summing up the total amount
Supernormal growth∈dividend for the first 2 ear =40 % per annum
Long−term constant growth rate=5 % per annum
Period Dividend Calculation Results
Present value
of 1 @ 12.5% Present value
Year 1 D1 $0.30*(1+40%) $ 0.42 0.888889 $0.37
Year 2 D2 $0.30*(1+40%)2 $ 0.59 0.790123 $0.46
Year 3 D3 $0.588*(1+5%) $ 0.62
$0.62/(12.50%-5%) $ 8.27
$8.267/(1+12.50%)^2 $ 6.53 $6.53
Net present
value $7.37
Presented table indicates that NPV of $7.37. The technique is highly found suitable for
companies which expect high or superb growth in their dividend than average growth. However,
it is obvious, that in today’s uncertain and competitive world, it is not possible for the
organizations to maintain such a high growth for a longer period of time. It is because, looking to
the supernormal growth, new entry threats become high as other entities also wish to come into
the industry to enjoy such extreme growth, resultant falling return on equity.
F. Selling price at a 5% constant decline in earnings
If it is predicted that company’s earnings and dividend is expected to fall in near future,
then it may be due to varied reasons, such as future investment project like expansion, new
product development, and investment in new technology, machinery and building others. In such
case, it is often seen that companies reduce their dividend payment in order to secure fund. From
10
the news release, annual reports, investors can easily gather information about business future
prospectus and plans. Although, such companies deliver less or no dividend, still, in future, there
is a possibility of very high return, which encourage investors to buy its stock even with declined
current dividend.
Current stock price=Current annual dividend (1+g) /k−g
Price=0.30 (1−5 %)/12.50 %−5 % ¿
Price=$ 1.62
G. Possible issues in dividend discounted method in stock valuation and suggesting an
alternative
It does not denote accurate results and therefore it is not relevant. In this the paid
dividend is not related to actual value especially for short term goals.
It does not consider the fluctuation of dividend instead it is focused on the last
calculation.
It is based on assumption which may be wrong with the considerable change in market
environment
The model is uncertain and the dividend growth rate can lead to major changes.
Demands forecast for long periods therefore determination of value for short period
becomes difficult.
As an alternative, company can use market multiple method for stock valuation. It is used
by the organisation to control the difference between asset and per group which impact the
financial performance of the company. Further, it assists the enterprise in determining the market
value of assets and then helps in converting market value in standardized value according to key
statistic of business. It assists in revealing rating of business in accordance to capital structure,
transaction interest in merger and acquisition.
CONCLUSION
From the report, it becomes clear that although GCE Bhd reported declined sales, still,
shown less loss with good liquidity and efficiency. However, lastly, it is found that CAPM is the
best way to determine required return whereas Gordon Growth Model is the method which
considers dividend rate, investor’s expectations and growth rate to measure stock price.
11
Paraphrase This Document
Need a fresh take? Get an instant paraphrase of this document with our AI Paraphraser

12
REFERENCES
Books and Journals
Ambrosin, and et. al., 2015. Advanced strategic management: A multi-perspective approach.
Palgrave Macmillan.
Baker, H.K. and Riddick, L.A., 2013. International finance: a survey. Oxford University Press.
Ball, R. and et. al., 2015. Deflating profitability. Journal of Financial Economics. 117(2). pp.
225-248.
Grasse, N.J., Whaley, K.M. and Ihrke, D.M., 2016. Modern Portfolio Theory and Nonprofit Arts
Organizations: Identifying the Efficient Frontier. Nonprofit and Voluntary Sector
Quarterly. 45(4). pp.825-843.
Kenfack, H. and et.al., 2016. The pricing of illiquidity risk on emerging stock exchange markets:
A portfolio panel data analysis. Journal of Economics and International Finance. 8(8).
pp.127-141.
Thomson, J.C., 2014. A year of growth in members, influence, and respect. Strategic Finance.
97(7). pp. 10-11.
Tong, J., Hu, J. and Hu, J., 2017. Computing equilibrium prices for a capital asset pricing model
with heterogeneous beliefs and margin-requirement constraints. European Journal of
Operational Research. 256(1). pp.24-34.
Uechi, L. and et. al., 2015. Sector dominance ratio analysis of financial markets. Physica A:
Statistical Mechanics and its Applications. 42(1). pp. 488-509.
Online
Constant Growth Model, 2017. [Online]. Available through: <
http://www.ultimatecalculators.com/constant_growth_model_calculator.html>.
Grand Central Enterprise. 2016. [PDF]. Available through: <
http://www.malaysiastock.biz/GetReport.aspx?file=AR/2017/4/4/5592%20-
%201710215272978.pdf&name=GCE%20Annual%20Report%202016%20(Final).pdf>
Landmark’s annual report, 2016. [PDF]. Available through: <
http://www.landmarks.com.my/investor-relations/annual-report>.
13

Limitation of ratio analysis. 2017. [Online]. Available through: <
https://www.accountingtools.com/articles/what-are-the-limitations-of-ratio-
analysis.html>.
14
https://www.accountingtools.com/articles/what-are-the-limitations-of-ratio-
analysis.html>.
14
1 out of 16
Your All-in-One AI-Powered Toolkit for Academic Success.
+13062052269
info@desklib.com
Available 24*7 on WhatsApp / Email
![[object Object]](/_next/static/media/star-bottom.7253800d.svg)
Unlock your academic potential
© 2024 | Zucol Services PVT LTD | All rights reserved.