Financial Analysis and Balance Scorecard Approach for Centaur Media

Verified

Added on  2020/04/21

|9
|1356
|118
Report
AI Summary
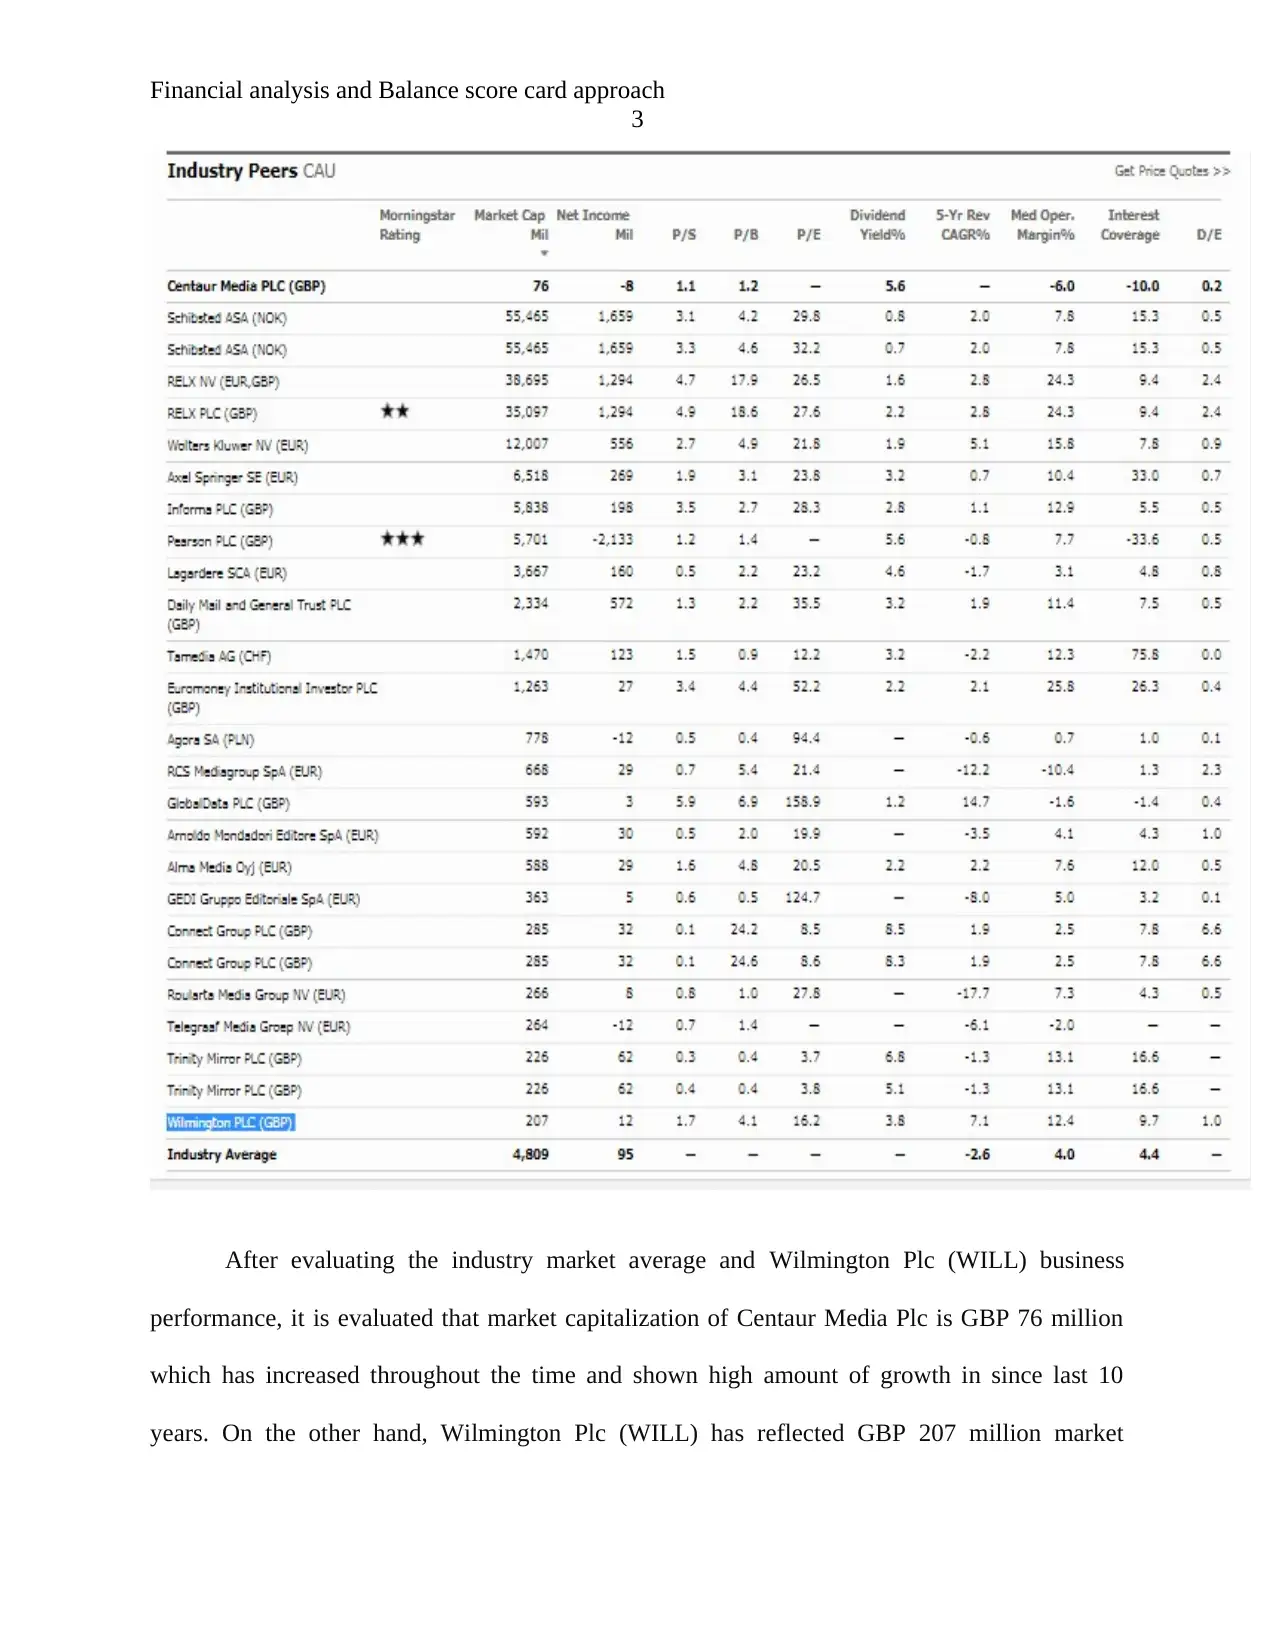
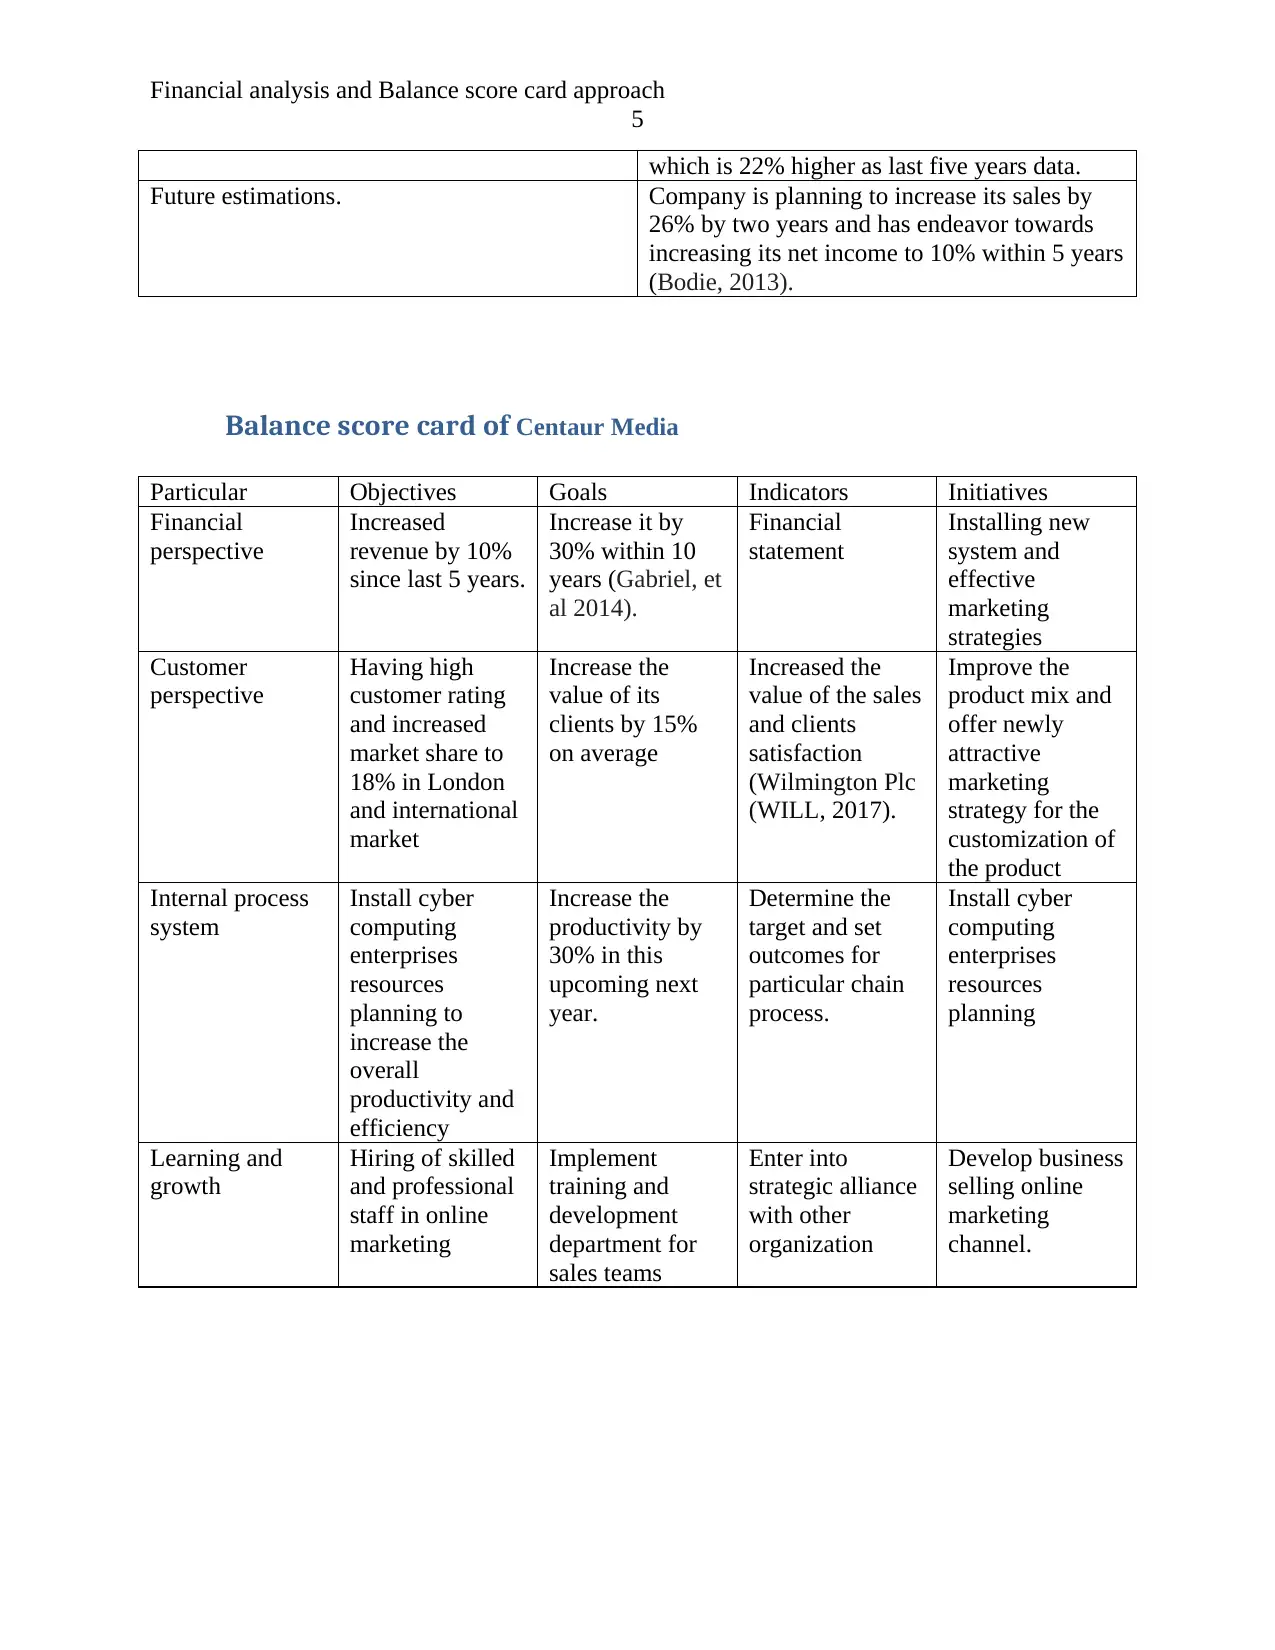
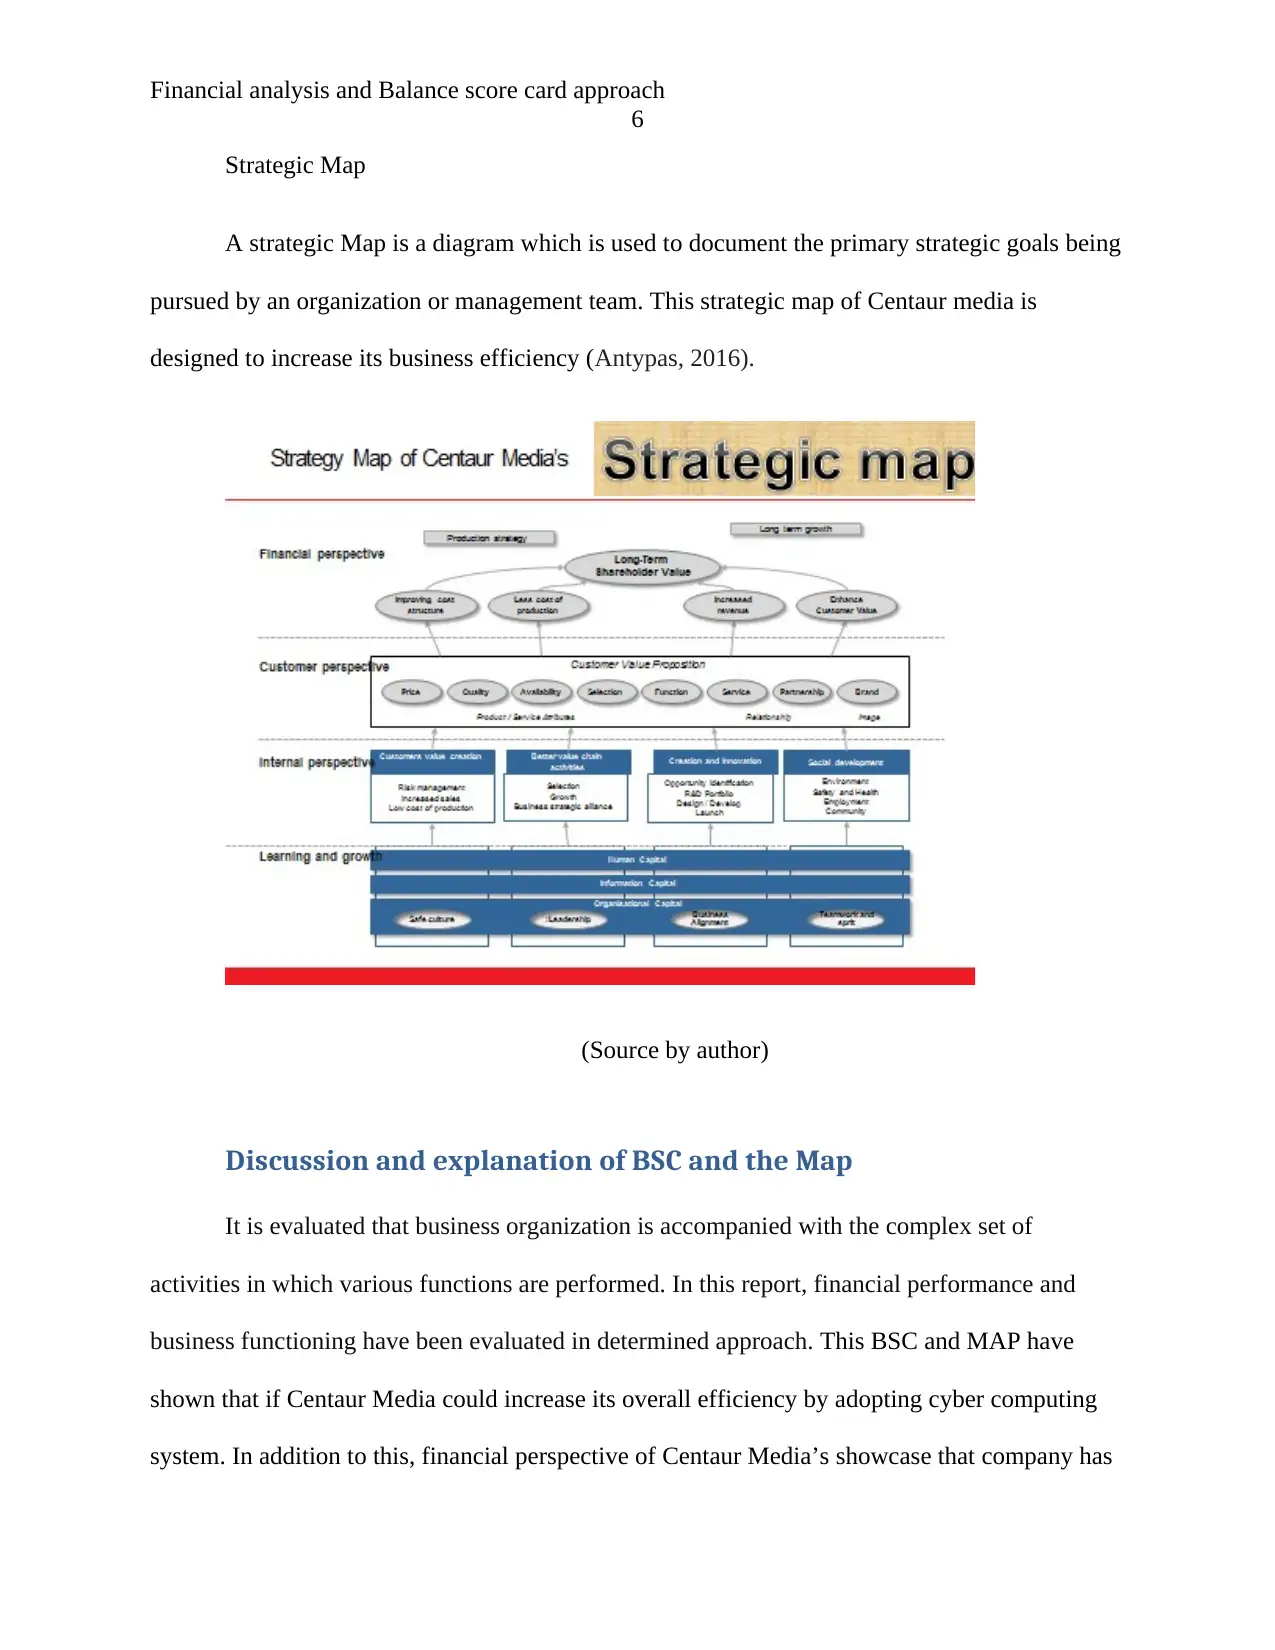
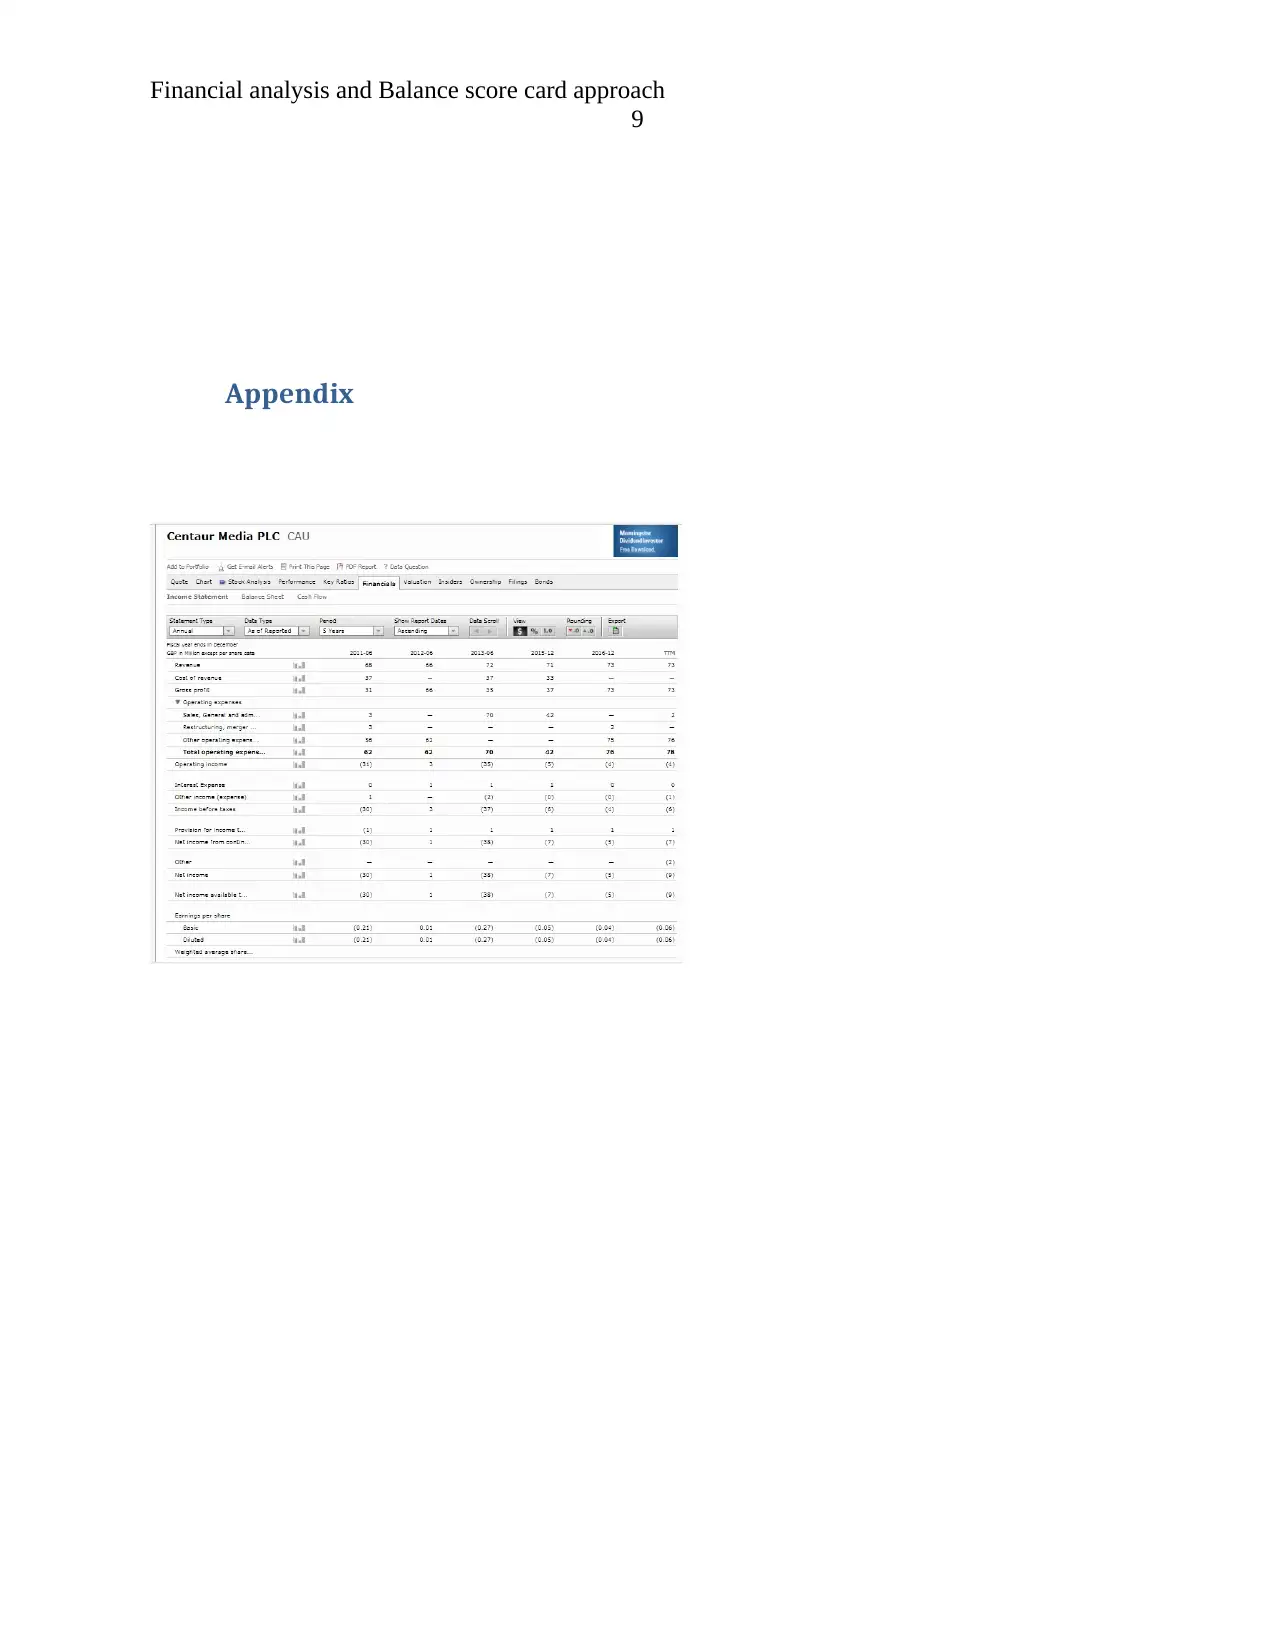
This report provides a financial and business performance evaluation of Centaur Media, a London-based events and marketing solutions company. The analysis compares Centaur Media with its competitor, Wilmington Plc, examining key financial metrics such as market capitalization, net income, and earnings ratios. It also assesses Centaur Media's performance against its KPIs, including revenue and market share, and uses a balance scorecard to evaluate objectives across financial, customer, internal process, and learning & growth perspectives. The report includes a strategic map to visualize the company's goals and concludes with recommendations for strategic improvements, such as implementing new systems and enhancing the balance scorecard to drive better financial results. The report also includes a discussion and explanation of the balance scorecard and strategic map to increase business efficiency.
Document Page
RUNNING HEAD: Financial analysis and Balance score card approach
1
Name of the student-
Topic- Financial analysis and Balance score card approach
University name-
tabler-icon-diamond-filled.svg

Paraphrase This Document

Need a fresh take? Get an instant paraphrase of this document with our AI Paraphraser
Document Page
Financial analysis and Balance score card approach
2
In this report, study has been conducted to evaluate the financial and business
performance of company.
Present description of company
Centaur Media Company is events and marketing Solution Company based in London
and providing commercial market services around the globe. It provides financial, marketing
and commodity based services to its clients (Centaur media, 2017).
Competitors name of the Centaur Media Company
In this report, Wilmington Plc (WILL) has been taken as rival company for Centaur
Media Company to evaluate its business and financial performance (Wilmington Plc (WILL,
2017).
Comparison with competitor and industry average figure
There are several tools such as using of balance score card approach, KPI assigning
factors, competitor’s industry figure and strategic map to evaluate the performance of company.
In this report, Centaur Media Company has been taken into consideration.
Document Page
Financial analysis and Balance score card approach
3
After evaluating the industry market average and Wilmington Plc (WILL) business
performance, it is evaluated that market capitalization of Centaur Media Plc is GBP 76 million
which has increased throughout the time and shown high amount of growth in since last 10
years. On the other hand, Wilmington Plc (WILL) has reflected GBP 207 million market
Document Page
Financial analysis and Balance score card approach
4
capitalisation in 2017 (Centaur media, 2017). This has shown that Wilmington Plc (WILL) has
performed 3 times better as compared to the business performance of Centaur Media plc. In
addition to this, net income of Centaur Media is also in negative 8 million which reflects its
negative business performance (Delen, Kuzey, and Uyar, 2013). On the other hand, Wilmington
Plc (WILL) has shown positive GBP 12 million amount of net income in 2017 which is 22%
higher as compared to last five years data. Moreover, Present earnings ratio of Centaur Media is
negative which reflects that company has been decreasing value of its business. Wilmington Plc
(WILL) has 1.7 PE ratios which reflect that company has been creating value on its investment.
Interest coverage of Centaur Company is also negative 10. It reflects that company has high
financial leverage and should lower down its financial leverage. On the other hand, Wilmington
Plc (WILL) has positive 12.41 interest coverage ratio which reflects that company has low
financial leverage and could increase its debt funding to increase the overall business efficiency
and reduce the overall cost of capital.
Measurement against the Centaur Media’s KPIs and evaluation of
the use of KPIs in assessing organization performance
There are several key performance indicators of Centaur Media which could be used to
gauge the performance of company (Carmona, 2014).
Key performance indicators Observation
Revenue GBP 73 million. This has shown that Centaur
Media was GBP 68 million revenue in 2012
which increased by 10% since last five years.
Net income It has negative -7million net income which is
far better than last five year data. Company is
struggling with the sluggish market condition
Market capitalization It had GBP 76 million market capitalization
tabler-icon-diamond-filled.svg

Paraphrase This Document

Need a fresh take? Get an instant paraphrase of this document with our AI Paraphraser
Document Page
Financial analysis and Balance score card approach
5
which is 22% higher as last five years data.
Future estimations. Company is planning to increase its sales by
26% by two years and has endeavor towards
increasing its net income to 10% within 5 years
(Bodie, 2013).
Balance score card of Centaur Media
Particular Objectives Goals Indicators Initiatives
Financial
perspective
Increased
revenue by 10%
since last 5 years.
Increase it by
30% within 10
years (Gabriel, et
al 2014).
Financial
statement
Installing new
system and
effective
marketing
strategies
Customer
perspective
Having high
customer rating
and increased
market share to
18% in London
and international
market
Increase the
value of its
clients by 15%
on average
Increased the
value of the sales
and clients
satisfaction
(Wilmington Plc
(WILL, 2017).
Improve the
product mix and
offer newly
attractive
marketing
strategy for the
customization of
the product
Internal process
system
Install cyber
computing
enterprises
resources
planning to
increase the
overall
productivity and
efficiency
Increase the
productivity by
30% in this
upcoming next
year.
Determine the
target and set
outcomes for
particular chain
process.
Install cyber
computing
enterprises
resources
planning
Learning and
growth
Hiring of skilled
and professional
staff in online
marketing
Implement
training and
development
department for
sales teams
Enter into
strategic alliance
with other
organization
Develop business
selling online
marketing
channel.
Document Page
Financial analysis and Balance score card approach
6
Strategic Map
A strategic Map is a diagram which is used to document the primary strategic goals being
pursued by an organization or management team. This strategic map of Centaur media is
designed to increase its business efficiency (Antypas, 2016).
(Source by author)
Discussion and explanation of BSC and the Map
It is evaluated that business organization is accompanied with the complex set of
activities in which various functions are performed. In this report, financial performance and
business functioning have been evaluated in determined approach. This BSC and MAP have
shown that if Centaur Media could increase its overall efficiency by adopting cyber computing
system. In addition to this, financial perspective of Centaur Media’s showcase that company has
Document Page
Financial analysis and Balance score card approach
7
increased its overall value of the business but still due to sluggish market condition, it has
increased its overall revenue (Coe, and Letza, 2014). Internal perspective of business is also
reflects that company needs to hire professional staff and cyber computing system. Learning and
growth of Centaur Media reflects, it has to invest more capital in its research and development
department for the creation and innovative value chain activities.
Conclusion
After evaluating all the required details and collected information, it could be inferred
that Centaur Media needs to make changes in its business functioning by implementing new
strategic plans and installing new system. It has been facing sluggish market condition and
negative business factors that has resulted to negative net income and non-effective business.
Company needs to evaluate the points given by its balance score card and required changes
should be made to make better result and increasing its overall revenue.
tabler-icon-diamond-filled.svg

Paraphrase This Document

Need a fresh take? Get an instant paraphrase of this document with our AI Paraphraser
Document Page
Financial analysis and Balance score card approach
8
References
Antypas, N., 2016. Essays on mergers and acquisitions: acquisition target prediction, CEO deal
experience on deal performance, and value creation on a massive scale (Doctoral dissertation,
University of Reading).
Bodie, Z., 2013. Investments. McGraw-Hill.
Carmona, R., 2014. Statistical analysis of financial data in R (Vol. 2). New York: Springer.
Centaur media, 2017, annual report, retrieved on 06th November, 2017 from
https://www.google.co.in/search?
q=Centaur+media+anual+reprot&oq=Centaur+media+anual+reprot&aqs=chrome..69i57j0l2.121
74j0j7&sourceid=chrome&ie=UTF-8
Coe, N. and Letza, S., 2014. Two decades of the balanced scorecard: A review of
developments. The Poznan University of Economics Review, 14(1), p.63.
Delen, D., Kuzey, C. and Uyar, A., 2013. Measuring firm performance using financial ratios: A
decision tree approach. Expert Systems with Applications, 40(10), pp.3970-3983.
Gabriel, R.A., Gimlich, R., Ehrenfeld, J.M. and Urman, R.D., 2014. Operating room metrics
score card—creating a prototype for individualized feedback. Journal of medical
systems, 38(11), p.144.
Wilmington Plc (WILL, 2017), annual report, retrieved on 06th November, 2017 from
http://quicktake.morningstar.com/stocknet/secdocuments.aspx?symbol=wil&country=gbr
Document Page
Financial analysis and Balance score card approach
9
Appendix
chevron_up_icon
1 out of 9
circle_padding
hide_on_mobile
zoom_out_icon
[object Object]