Financial Analysis of Samsung Ltd and Apple Inc. Comparison
VerifiedAdded on 2020/10/05
|18
|3781
|358
Report
AI Summary
This report offers a comprehensive financial analysis comparing the performance of Samsung Ltd. and Apple Inc. The analysis delves into various financial ratios, including profitability (gross profit margin, net profit margin), liquidity (current ratio, quick ratio), solvency (debt-equity ratio), and efficiency ratios (inventory turnover, asset turnover). The report evaluates the financial strengths and weaknesses of both companies, providing insights into their market positions and operational efficiencies. It also explores the Corporate Social Responsibility (CSR) initiatives of both organizations. The financial ratio analysis covers a four-year period, highlighting trends and fluctuations in key financial metrics. The comparison aims to provide a detailed understanding of each company's financial health and performance in the competitive telecom and technology industry. The report concludes with a summary of findings and references.
Financial Analysis Management &
Enterprise - FAME
Enterprise - FAME
Paraphrase This Document
Need a fresh take? Get an instant paraphrase of this document with our AI Paraphraser
Table of Contents
INTRODUCTION...........................................................................................................................1
MAIN BODY...................................................................................................................................1
1. Comparison and contrasting the financial position and performance of two companies...1
Interpretation:.......................................................................................................................10
maintained its position in market with not much growth.....................................................10
2. Analysis of CSR of two companies..................................................................................10
CONCLUSION..............................................................................................................................14
REFERENCES..............................................................................................................................15
INTRODUCTION
Accounting is the language of a business. Accounting mainly Inc.ludes two branches that
are financial and management accounting. The present report is about financial accounting. This
branch deals with presenting the financial information of a business in appropriate and specific
format so that owners and stakeholders can abstract relevant information from such data.
The present report is about Samsung Ltd and Apple Inc.. with a detailed analysis and
comparison between two businesses. The strengths and weaknesses of both businesses are
evaluated with the help of financial ratio analysis. The responsibilities of both organisations
towards the society and environment are also presented through Corporate Social Responsibility
reports annually.
MAIN BODY
1. Comparison and contrasting the financial position and performance of two companies
Financial strength and weaknesses
In the present world among many industries a major industry is telecom and
telecommunication industry and two important players of this industry are Samsung Ltd and
Apple Inc. the major product of both these companies are smart phones which has become an
integral and non separable part of each and every individual around the globe. Both the
organisations have an efficient and effective research and development departments which us
dedicated to a continuous and active development of new and advanced technology which can be
presented to the world in short time (Husein, and Mahfud, 2015). Apple Inc. have dominated the
market for a very long time but now Samsung Ltd. id giving Apple Inc. a tough competition for
both financial and technology development. These are one of the few factors of both the
organisation, a detailed comparison and evaluation of both the firms in respect of financial
performance is carried out and present below in this report, which is as follows:
Financial ratio analysis
Financial ratios of a business present the picture of a business in terms of financial
performance. The financial position of an organisation is presented through various statements
such as Inc.ome statement, balance sheet, cash flow statement and statement of change in
shareholder's equity. All these data set together present the financial data and informational
related to a business.
1
⊘ This is a preview!⊘
Do you want full access?
Subscribe today to unlock all pages.
Trusted by 1+ million students worldwide
With all the present data, an analysis is carried out through ratios that determine actual
performance of a business in comparison with its past performances and also with other
organisations (Handayani and Zulyanti, 2018). For both organisations such as Apple Inc.. and
Samsung Ltd, a detailed analysis of financial performance of a business is carried out with
calculation and interpretation of various ratios.
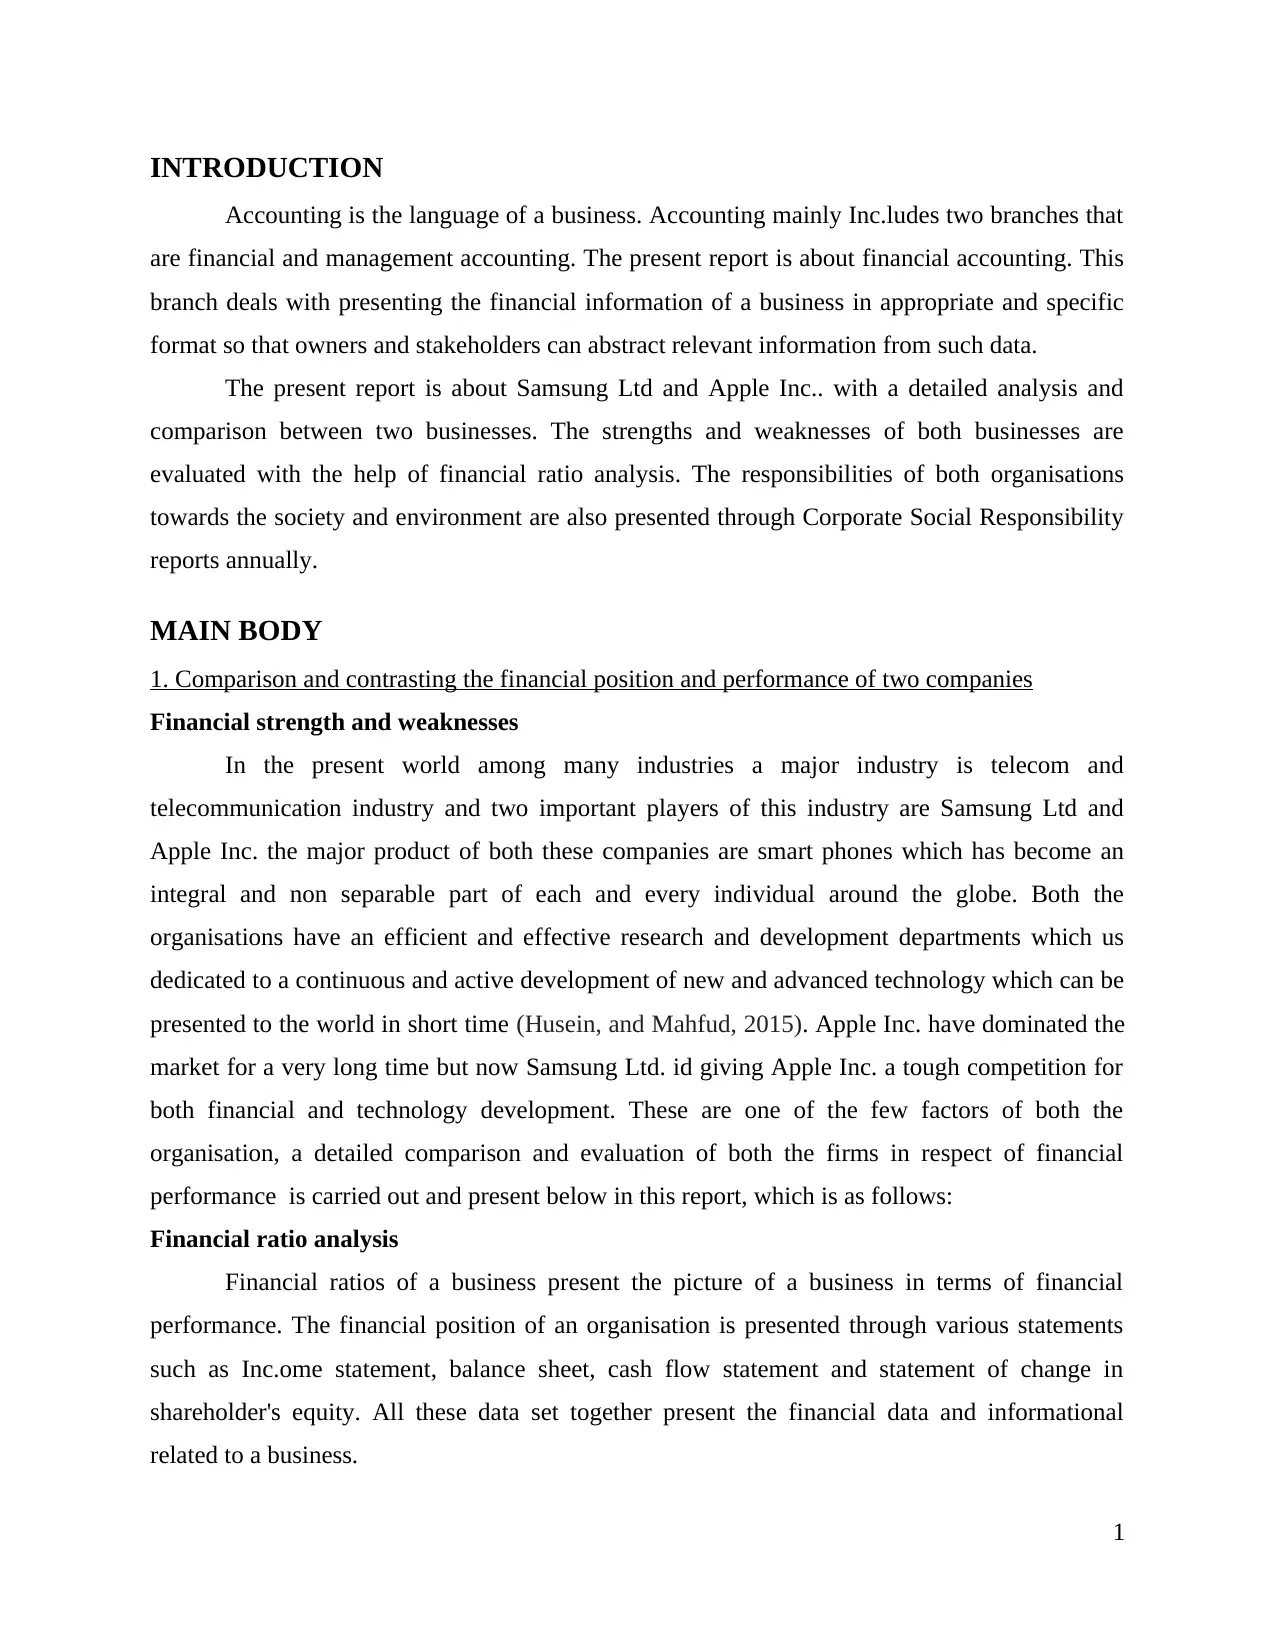
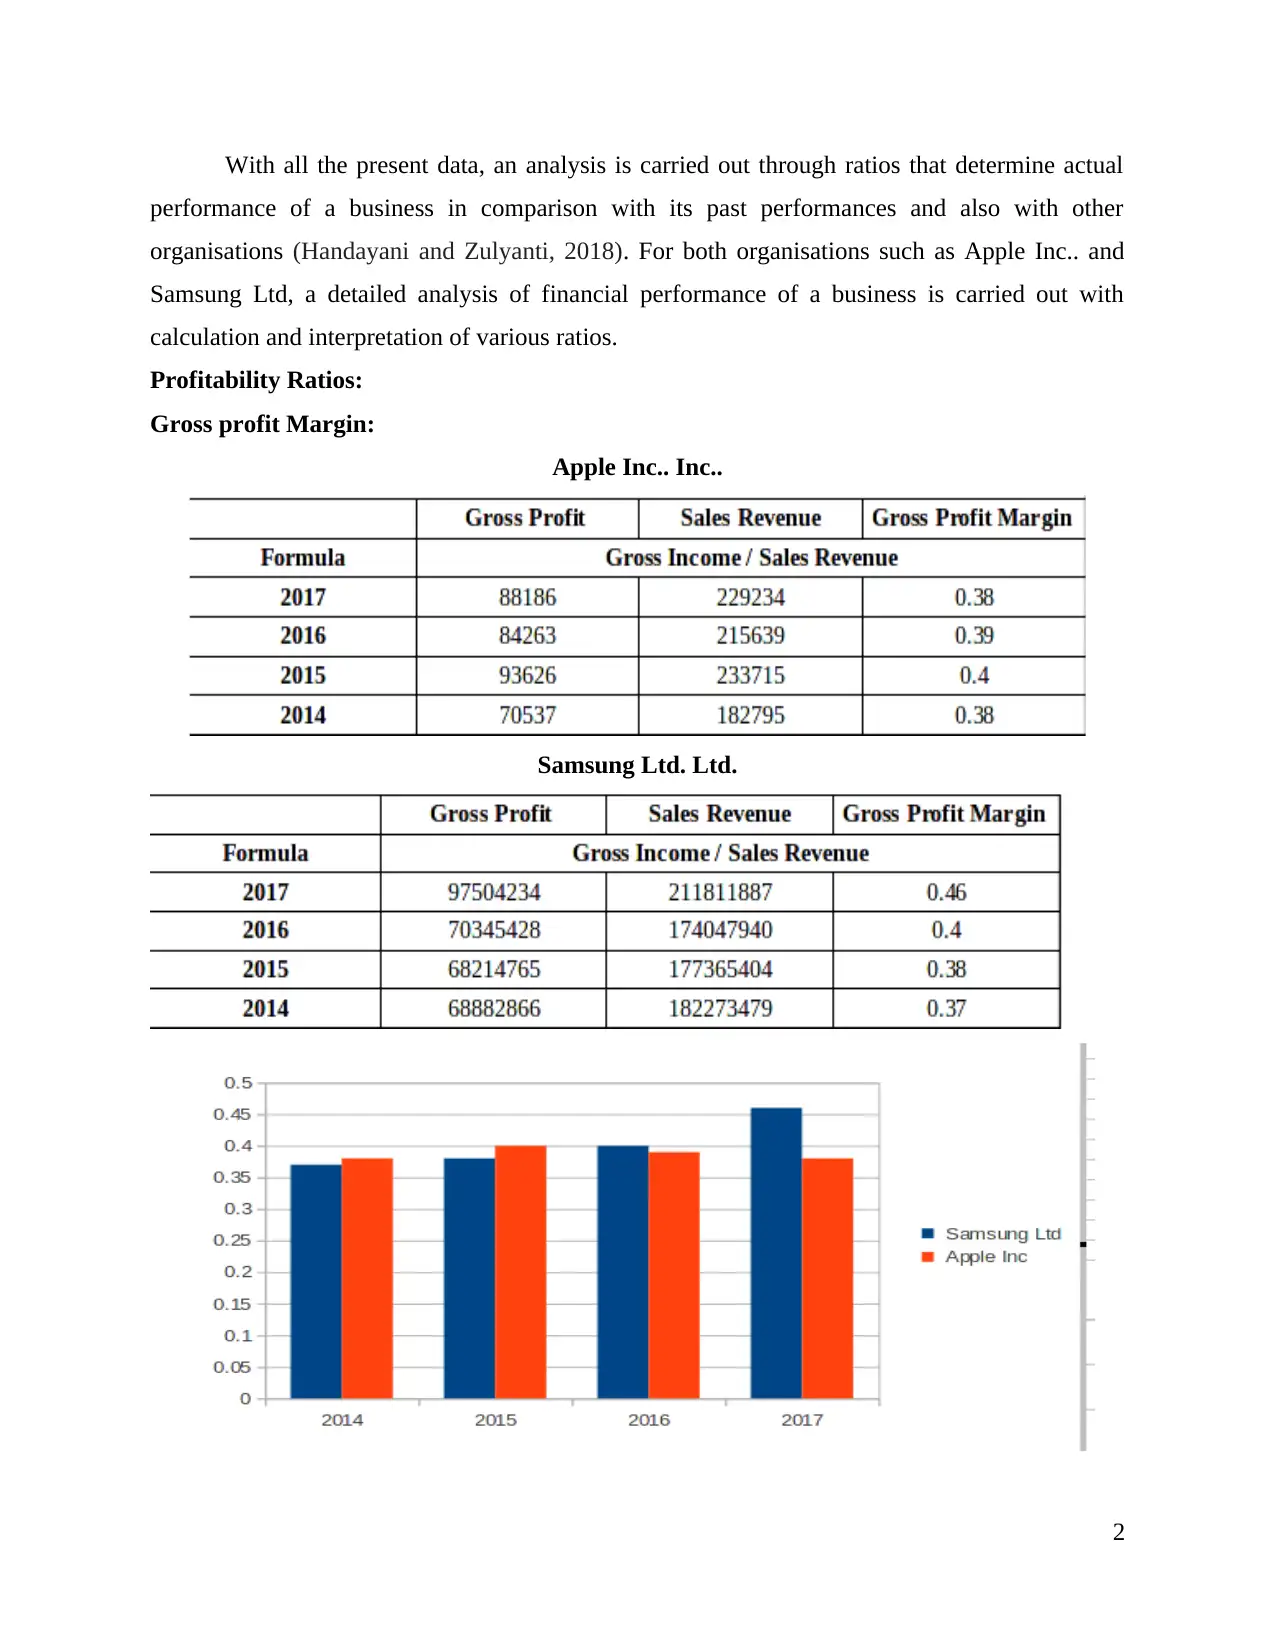
Profitability Ratios:
Gross profit Margin:
Apple Inc.. Inc..
Samsung Ltd. Ltd.
2
performance of a business in comparison with its past performances and also with other
organisations (Handayani and Zulyanti, 2018). For both organisations such as Apple Inc.. and
Samsung Ltd, a detailed analysis of financial performance of a business is carried out with
calculation and interpretation of various ratios.
Profitability Ratios:
Gross profit Margin:
Apple Inc.. Inc..
Samsung Ltd. Ltd.
2
Paraphrase This Document
Need a fresh take? Get an instant paraphrase of this document with our AI Paraphraser
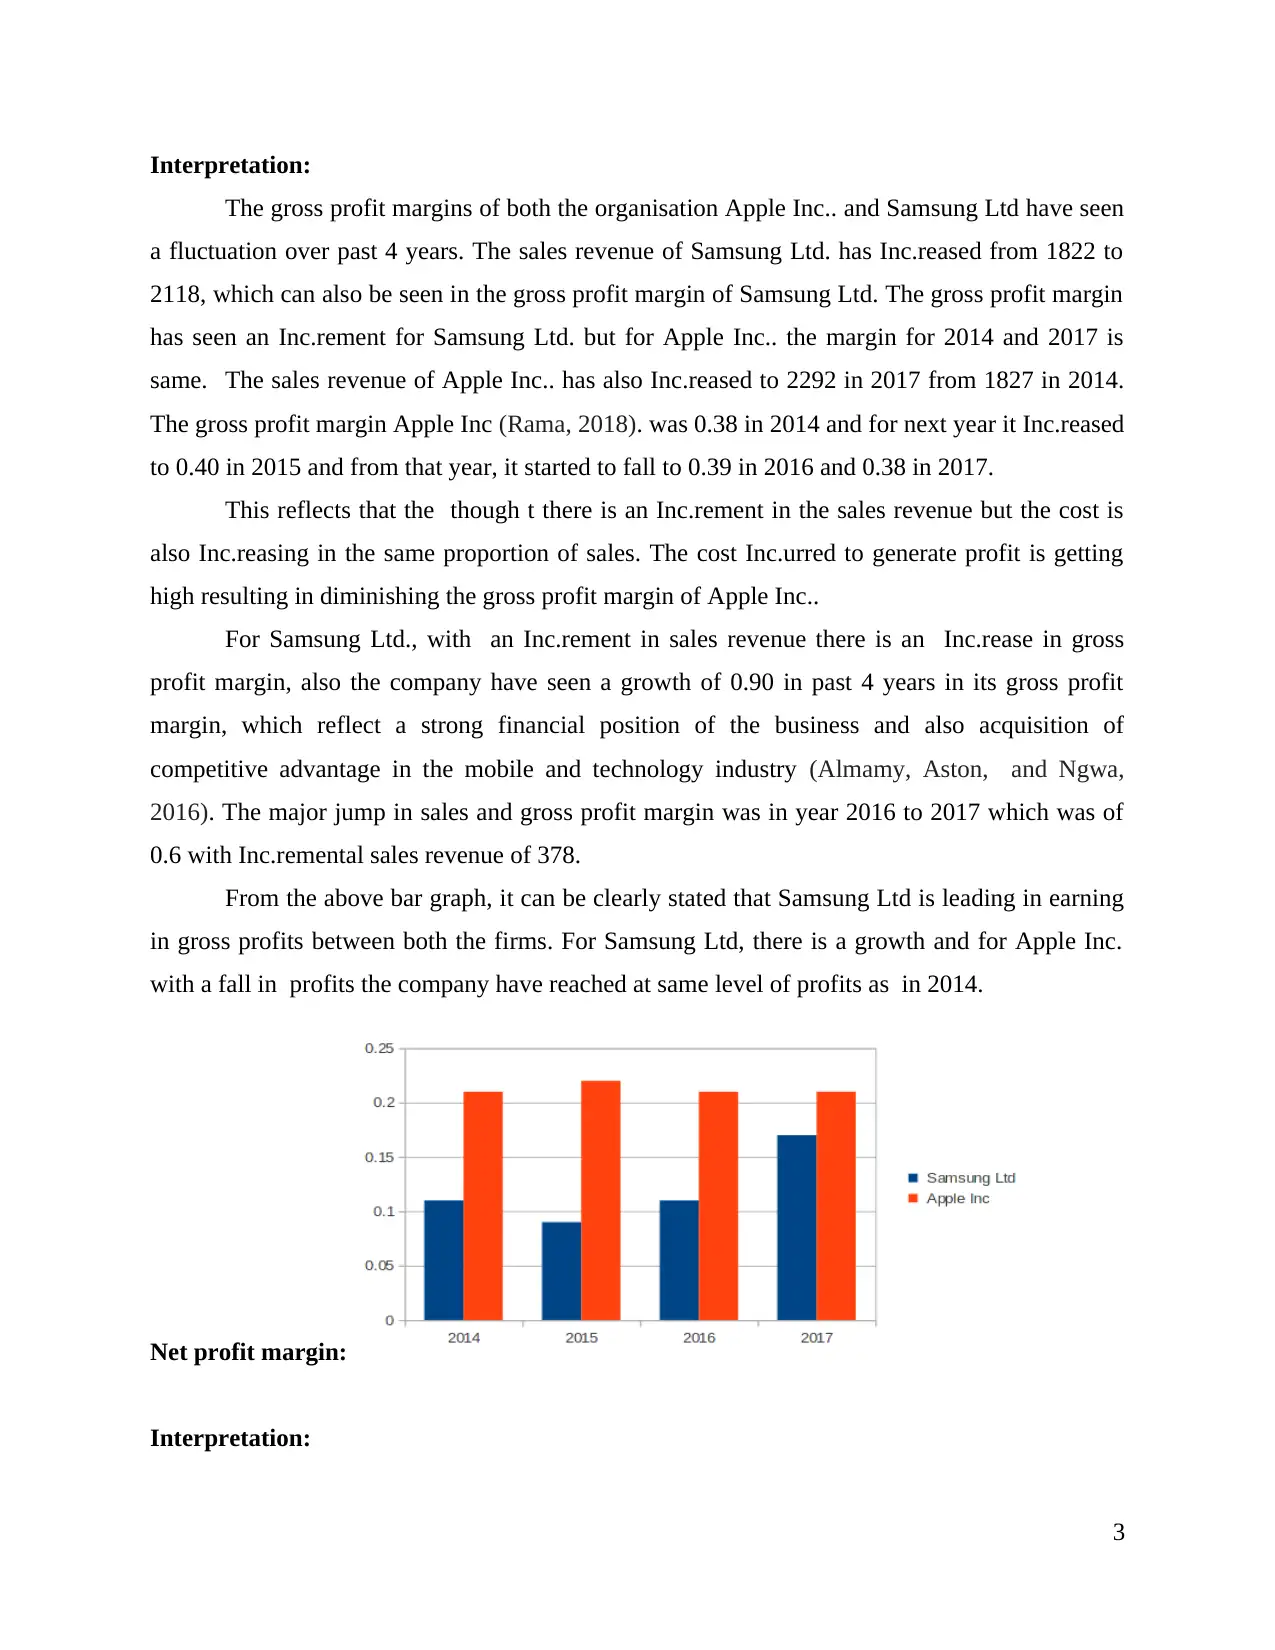
Interpretation:
The gross profit margins of both the organisation Apple Inc.. and Samsung Ltd have seen
a fluctuation over past 4 years. The sales revenue of Samsung Ltd. has Inc.reased from 1822 to
2118, which can also be seen in the gross profit margin of Samsung Ltd. The gross profit margin
has seen an Inc.rement for Samsung Ltd. but for Apple Inc.. the margin for 2014 and 2017 is
same. The sales revenue of Apple Inc.. has also Inc.reased to 2292 in 2017 from 1827 in 2014.
The gross profit margin Apple Inc (Rama, 2018). was 0.38 in 2014 and for next year it Inc.reased
to 0.40 in 2015 and from that year, it started to fall to 0.39 in 2016 and 0.38 in 2017.
This reflects that the though t there is an Inc.rement in the sales revenue but the cost is
also Inc.reasing in the same proportion of sales. The cost Inc.urred to generate profit is getting
high resulting in diminishing the gross profit margin of Apple Inc..
For Samsung Ltd., with an Inc.rement in sales revenue there is an Inc.rease in gross
profit margin, also the company have seen a growth of 0.90 in past 4 years in its gross profit
margin, which reflect a strong financial position of the business and also acquisition of
competitive advantage in the mobile and technology industry (Almamy, Aston, and Ngwa,
2016). The major jump in sales and gross profit margin was in year 2016 to 2017 which was of
0.6 with Inc.remental sales revenue of 378.
From the above bar graph, it can be clearly stated that Samsung Ltd is leading in earning
in gross profits between both the firms. For Samsung Ltd, there is a growth and for Apple Inc.
with a fall in profits the company have reached at same level of profits as in 2014.
Net profit margin:
Interpretation:
3
The above bar graph depicts the net profit earned by both Samsung Ltd. and Apple Inc..
It can be clearly seen that net profit margins of both the organisations have a huge difference.
This huge difference is due to administration and operation costs Inc.urred by both organisations
to generate revenues.
There is a vast variation in the net profit margin of Samsung Ltd in all 4 years. For 2014,
it was 0.11 which fell down to 0.09 in 2015. Again, in 2016, it shows a growth of 0.02 and for
2017, it experienced a high jump in profit of 0.06 reaching to 0.17, this is due to an Inc.rease in
sales revenue of business in 2017.
Apple Inc.. has maintained its position in net profit margin with slight fluctuations. It has
maintained its net profit above 0.20 for all 4 years. In 2016, the margin dropped by 0.01 and
reached to 0.21 from 0.22. However, it again reached to 0.22 in 2017 by controlling its cost.
Apple Inc.. is operating at same level of net profit margin for past 4 years but Samsung Ltd is
continuously making a growth in its net profit as compared to Apple Inc (Zainudin and Hashim,
2016). must get a control over the administration and other costs to Inc.rease its net profit level
as there is an Inc.rease in its sales revenue which reflects that profits is reducing due to Inc.rease
in cost so cost control is essential for Apple Inc..
Interpretation
From the above table, it can be concluded that more or less Apple Inc.. is operating as
same level of profits for last 4 years and Samsung Ltd., with major fluctuation, is generating
more profits as compared to Apple Inc.. As compared between both the organisations Apple Inc..
is stable in its position and Samsung Ltd. is at growth stage from past 4 years. The major jump
in the profits of Samsung Ltd. is due to the control over the administration and operating cost
which Inc.reased the profit margin of the firm.
Liquidity ratio
4
⊘ This is a preview!⊘
Do you want full access?
Subscribe today to unlock all pages.
Trusted by 1+ million students worldwide
Liquidity ratio depicts an ability of a business to meet its current liability with available
current assets. This means what is the value of current assets that can be sold in market in a very
short period if it has to pay all it current liabilities. The liquidity of a business is measured
through current and quick ratio. The standard current ratio is 2:1 and quick ratio is 1:1.
Current Ratio:
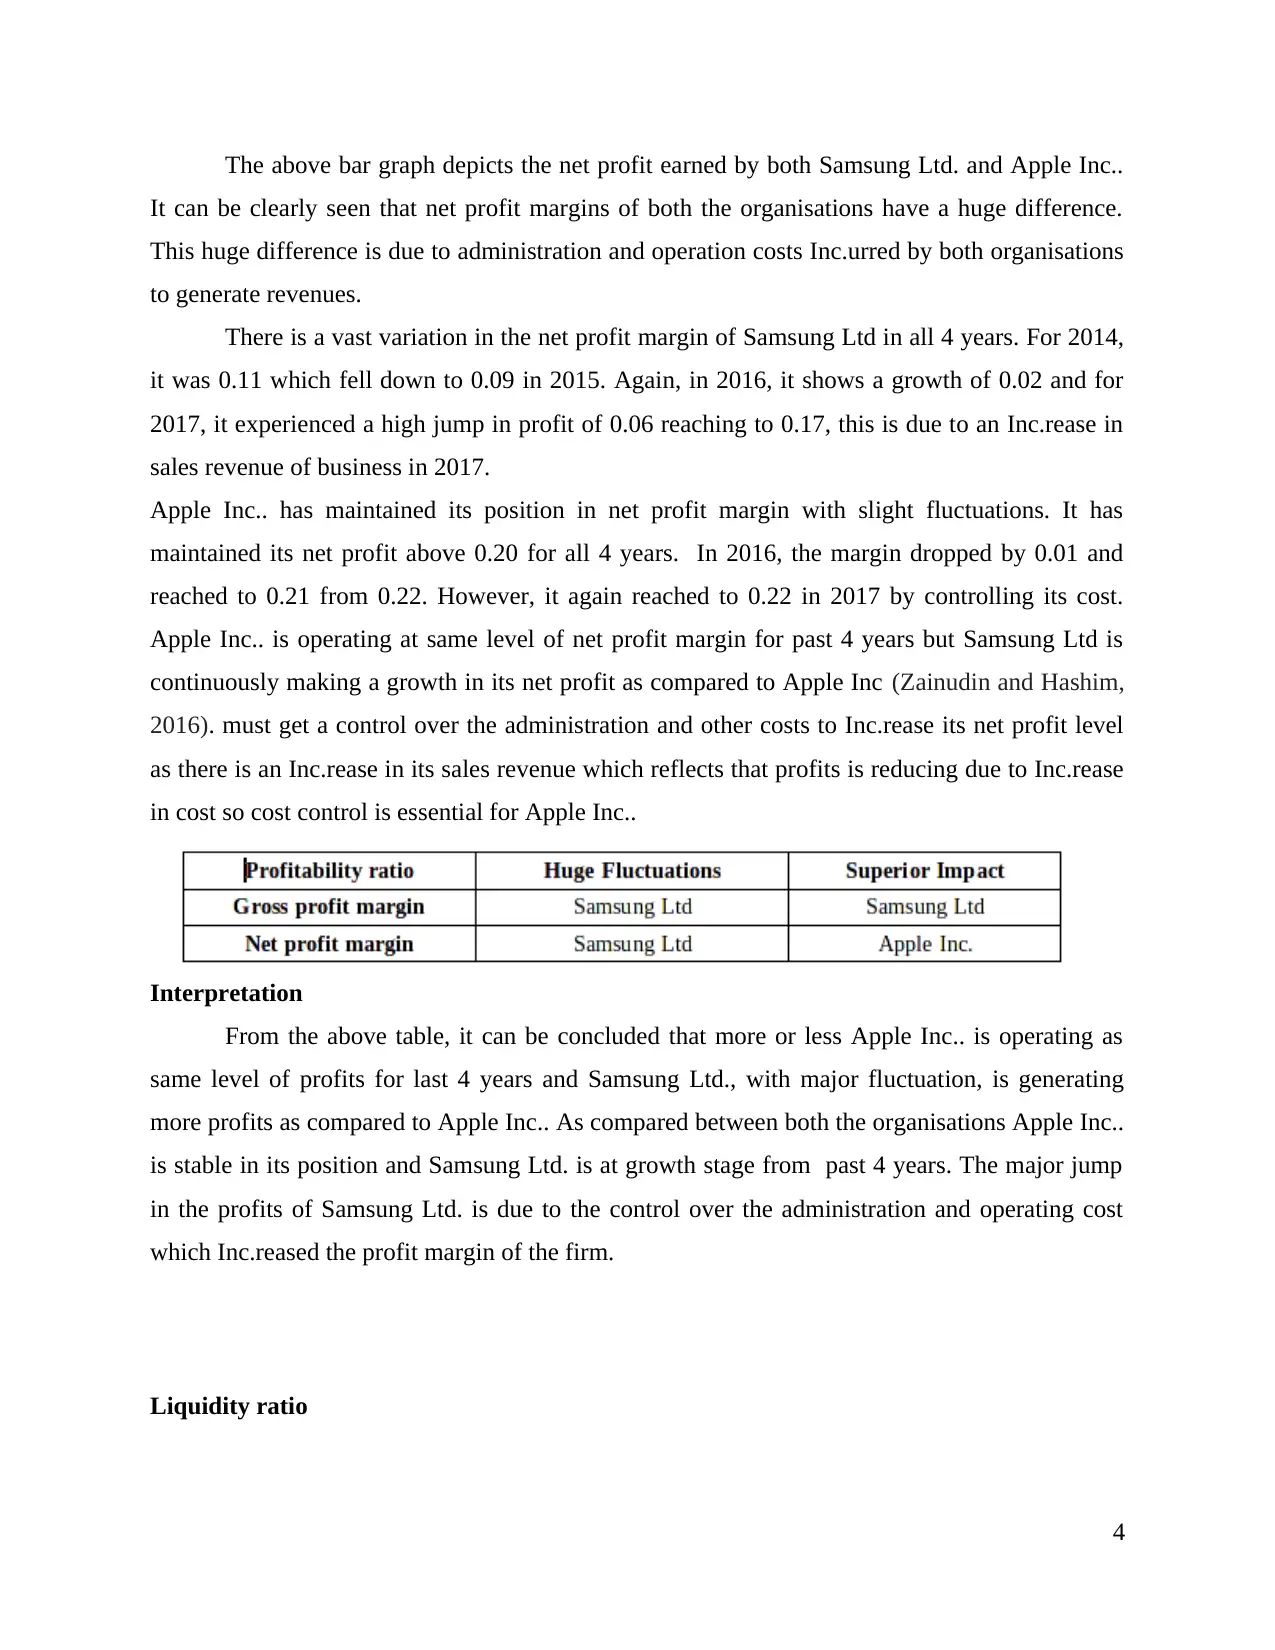
Interpretation:
Liquidity position of Apple Inc. and Samsung Ltd are reflected in above bar graph. It can
be clearly stated that Samsung Ltd. has a far better liquid position when compared to Apple Inc..
Samsung Ltd has seen a growth in 2015 and 2016 of 2.47 and 2.58 respectively from 2.23 in
2014 but in the year 2017, the ratio doomed to 2.18 due to decrement in holding of current
assets.
For Apple Inc., there is a slow and steady growth in current ration from 1.1 to 1.4. Though there
is growth but it is nowhere near the standard ratio. Apple Inc.. does not possess an efficient
liquidity position and to achieve a better liquidity, it shall focus to diminish its current liabilities
and shall increase in its cash and liquid assets.
Quick Ratio
5
current assets. This means what is the value of current assets that can be sold in market in a very
short period if it has to pay all it current liabilities. The liquidity of a business is measured
through current and quick ratio. The standard current ratio is 2:1 and quick ratio is 1:1.
Current Ratio:
Interpretation:
Liquidity position of Apple Inc. and Samsung Ltd are reflected in above bar graph. It can
be clearly stated that Samsung Ltd. has a far better liquid position when compared to Apple Inc..
Samsung Ltd has seen a growth in 2015 and 2016 of 2.47 and 2.58 respectively from 2.23 in
2014 but in the year 2017, the ratio doomed to 2.18 due to decrement in holding of current
assets.
For Apple Inc., there is a slow and steady growth in current ration from 1.1 to 1.4. Though there
is growth but it is nowhere near the standard ratio. Apple Inc.. does not possess an efficient
liquidity position and to achieve a better liquidity, it shall focus to diminish its current liabilities
and shall increase in its cash and liquid assets.
Quick Ratio
5
Paraphrase This Document
Need a fresh take? Get an instant paraphrase of this document with our AI Paraphraser
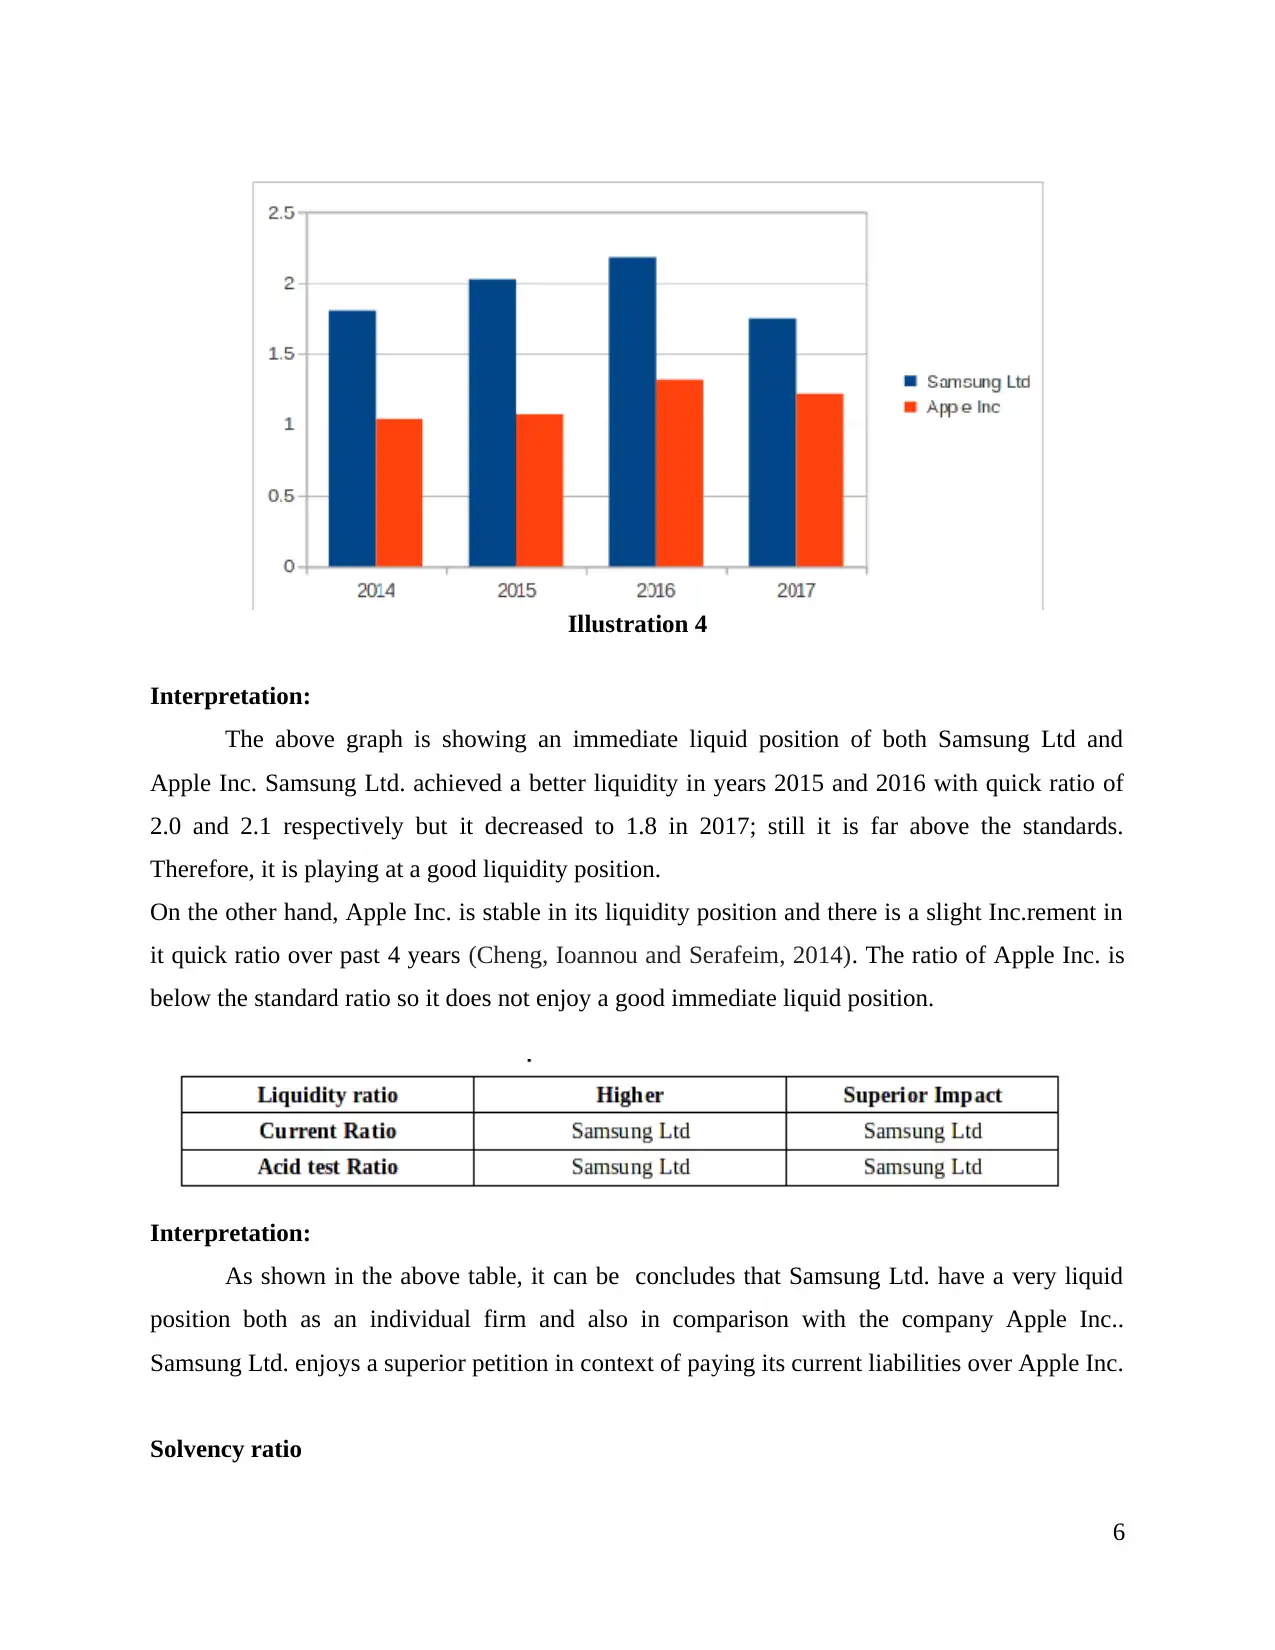
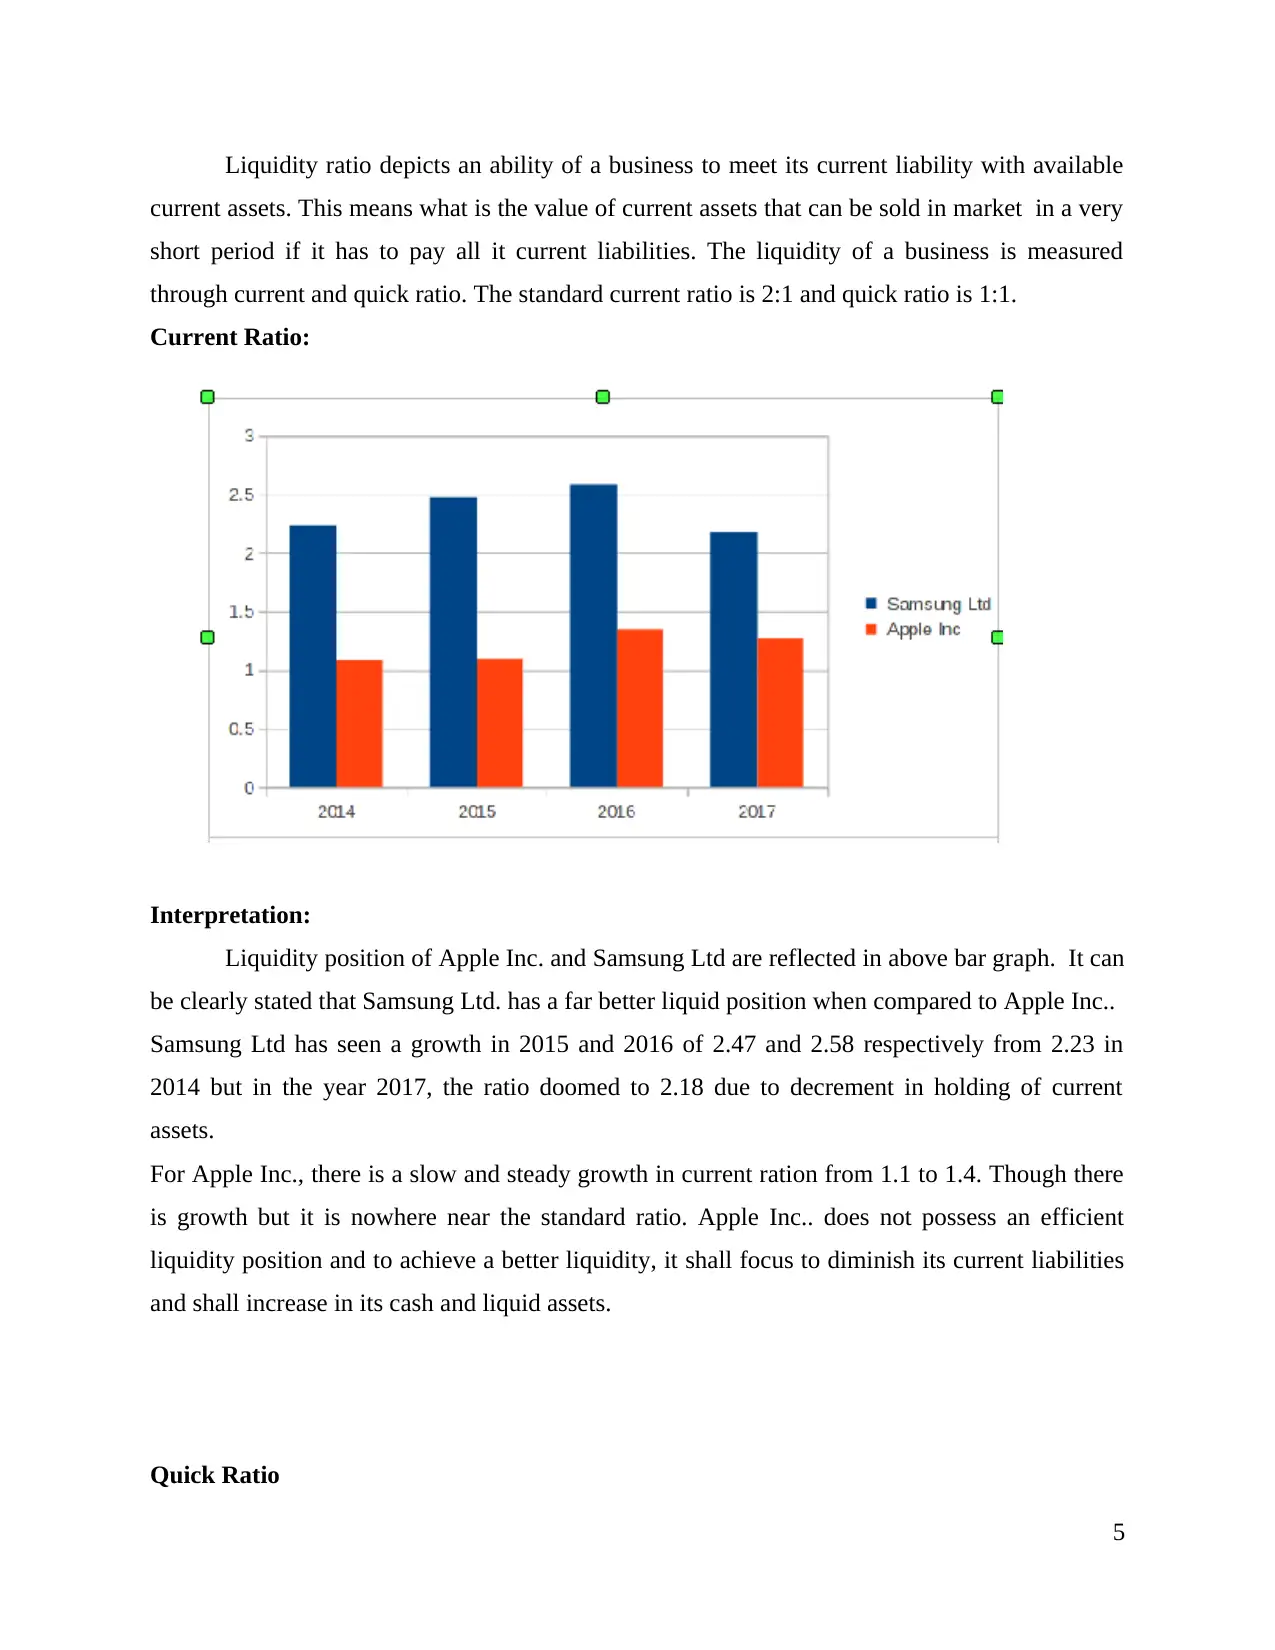
Illustration 4
Interpretation:
The above graph is showing an immediate liquid position of both Samsung Ltd and
Apple Inc. Samsung Ltd. achieved a better liquidity in years 2015 and 2016 with quick ratio of
2.0 and 2.1 respectively but it decreased to 1.8 in 2017; still it is far above the standards.
Therefore, it is playing at a good liquidity position.
On the other hand, Apple Inc. is stable in its liquidity position and there is a slight Inc.rement in
it quick ratio over past 4 years (Cheng, Ioannou and Serafeim, 2014). The ratio of Apple Inc. is
below the standard ratio so it does not enjoy a good immediate liquid position.
Interpretation:
As shown in the above table, it can be concludes that Samsung Ltd. have a very liquid
position both as an individual firm and also in comparison with the company Apple Inc..
Samsung Ltd. enjoys a superior petition in context of paying its current liabilities over Apple Inc.
Solvency ratio
6
Interpretation:
The above graph is showing an immediate liquid position of both Samsung Ltd and
Apple Inc. Samsung Ltd. achieved a better liquidity in years 2015 and 2016 with quick ratio of
2.0 and 2.1 respectively but it decreased to 1.8 in 2017; still it is far above the standards.
Therefore, it is playing at a good liquidity position.
On the other hand, Apple Inc. is stable in its liquidity position and there is a slight Inc.rement in
it quick ratio over past 4 years (Cheng, Ioannou and Serafeim, 2014). The ratio of Apple Inc. is
below the standard ratio so it does not enjoy a good immediate liquid position.
Interpretation:
As shown in the above table, it can be concludes that Samsung Ltd. have a very liquid
position both as an individual firm and also in comparison with the company Apple Inc..
Samsung Ltd. enjoys a superior petition in context of paying its current liabilities over Apple Inc.
Solvency ratio
6
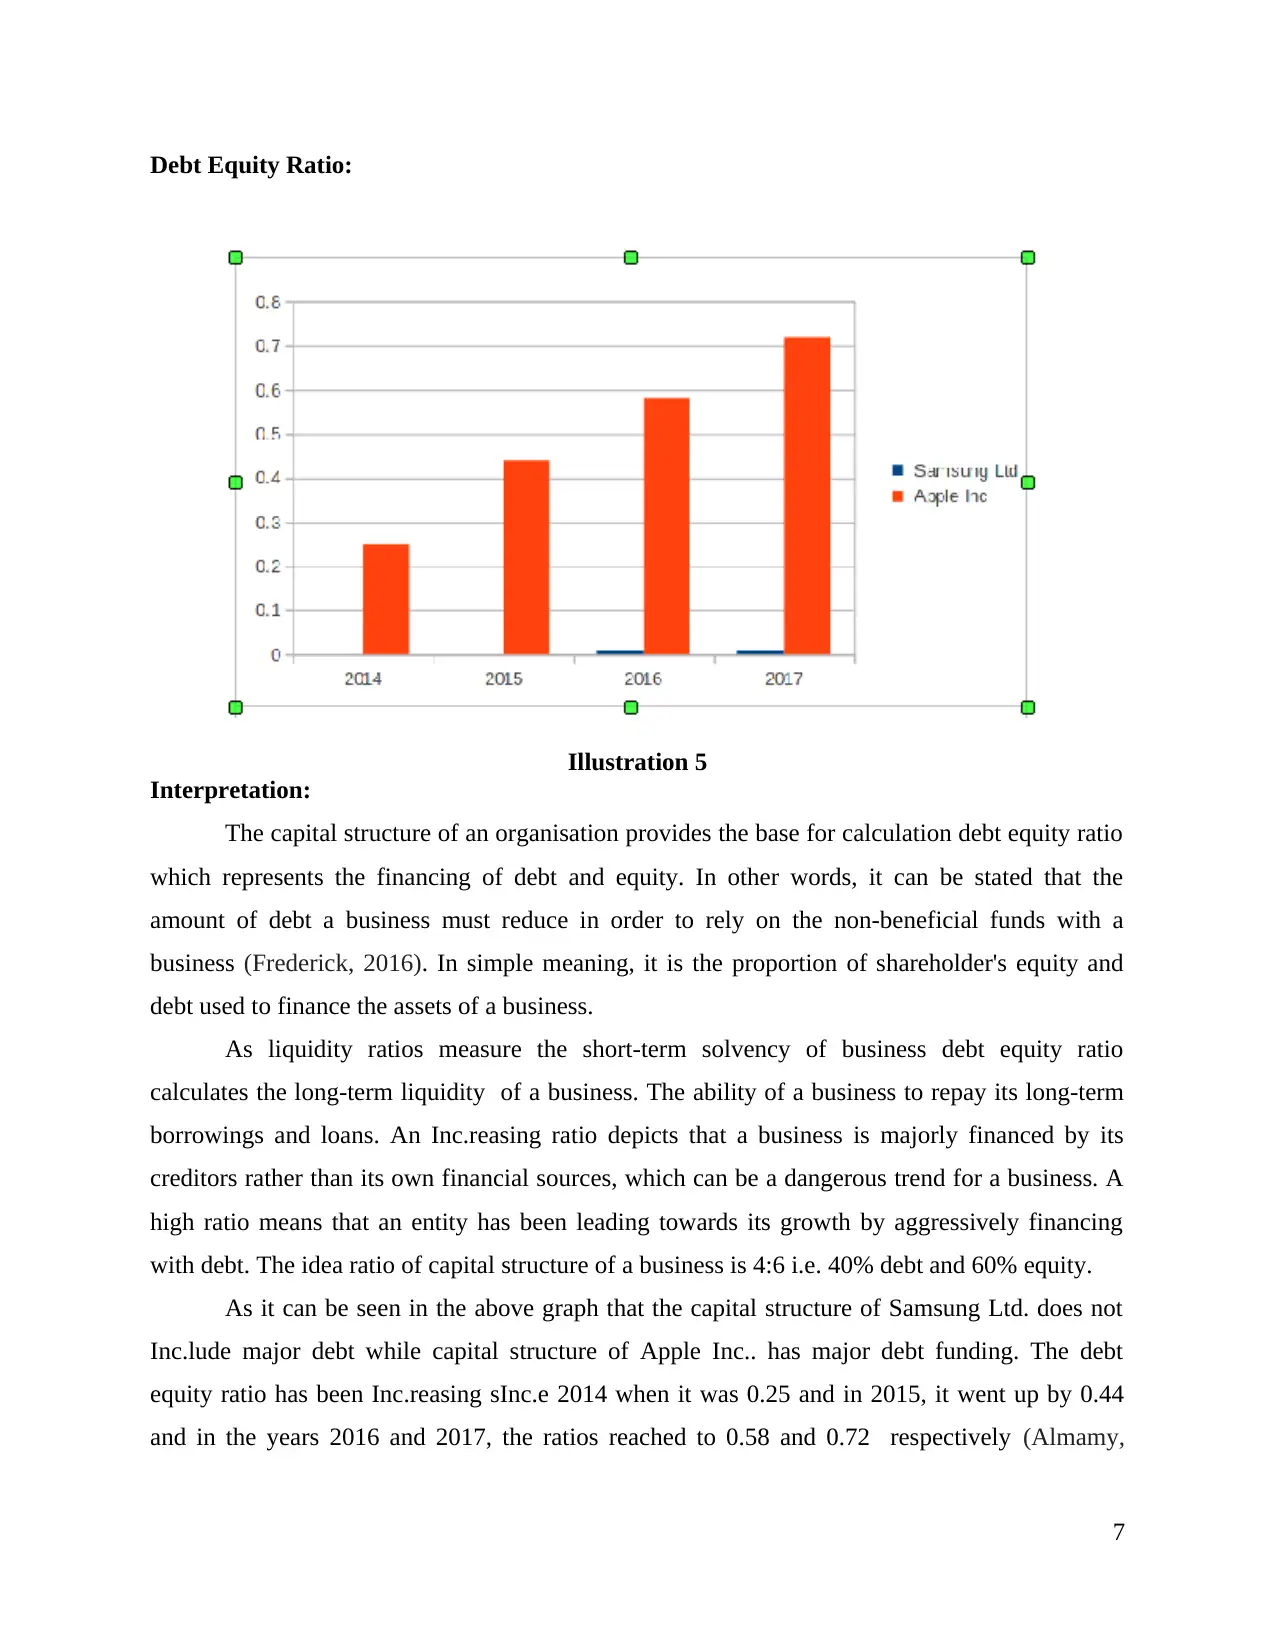
Debt Equity Ratio:
Illustration 5
Interpretation:
The capital structure of an organisation provides the base for calculation debt equity ratio
which represents the financing of debt and equity. In other words, it can be stated that the
amount of debt a business must reduce in order to rely on the non-beneficial funds with a
business (Frederick, 2016). In simple meaning, it is the proportion of shareholder's equity and
debt used to finance the assets of a business.
As liquidity ratios measure the short-term solvency of business debt equity ratio
calculates the long-term liquidity of a business. The ability of a business to repay its long-term
borrowings and loans. An Inc.reasing ratio depicts that a business is majorly financed by its
creditors rather than its own financial sources, which can be a dangerous trend for a business. A
high ratio means that an entity has been leading towards its growth by aggressively financing
with debt. The idea ratio of capital structure of a business is 4:6 i.e. 40% debt and 60% equity.
As it can be seen in the above graph that the capital structure of Samsung Ltd. does not
Inc.lude major debt while capital structure of Apple Inc.. has major debt funding. The debt
equity ratio has been Inc.reasing sInc.e 2014 when it was 0.25 and in 2015, it went up by 0.44
and in the years 2016 and 2017, the ratios reached to 0.58 and 0.72 respectively (Almamy,
7
⊘ This is a preview!⊘
Do you want full access?
Subscribe today to unlock all pages.
Trusted by 1+ million students worldwide
Aston, and Ngwa, 2016). This reflects that Apple Inc.. are relying more on the debt funding,
which is not good for business in long term.
Efficiency ratio:
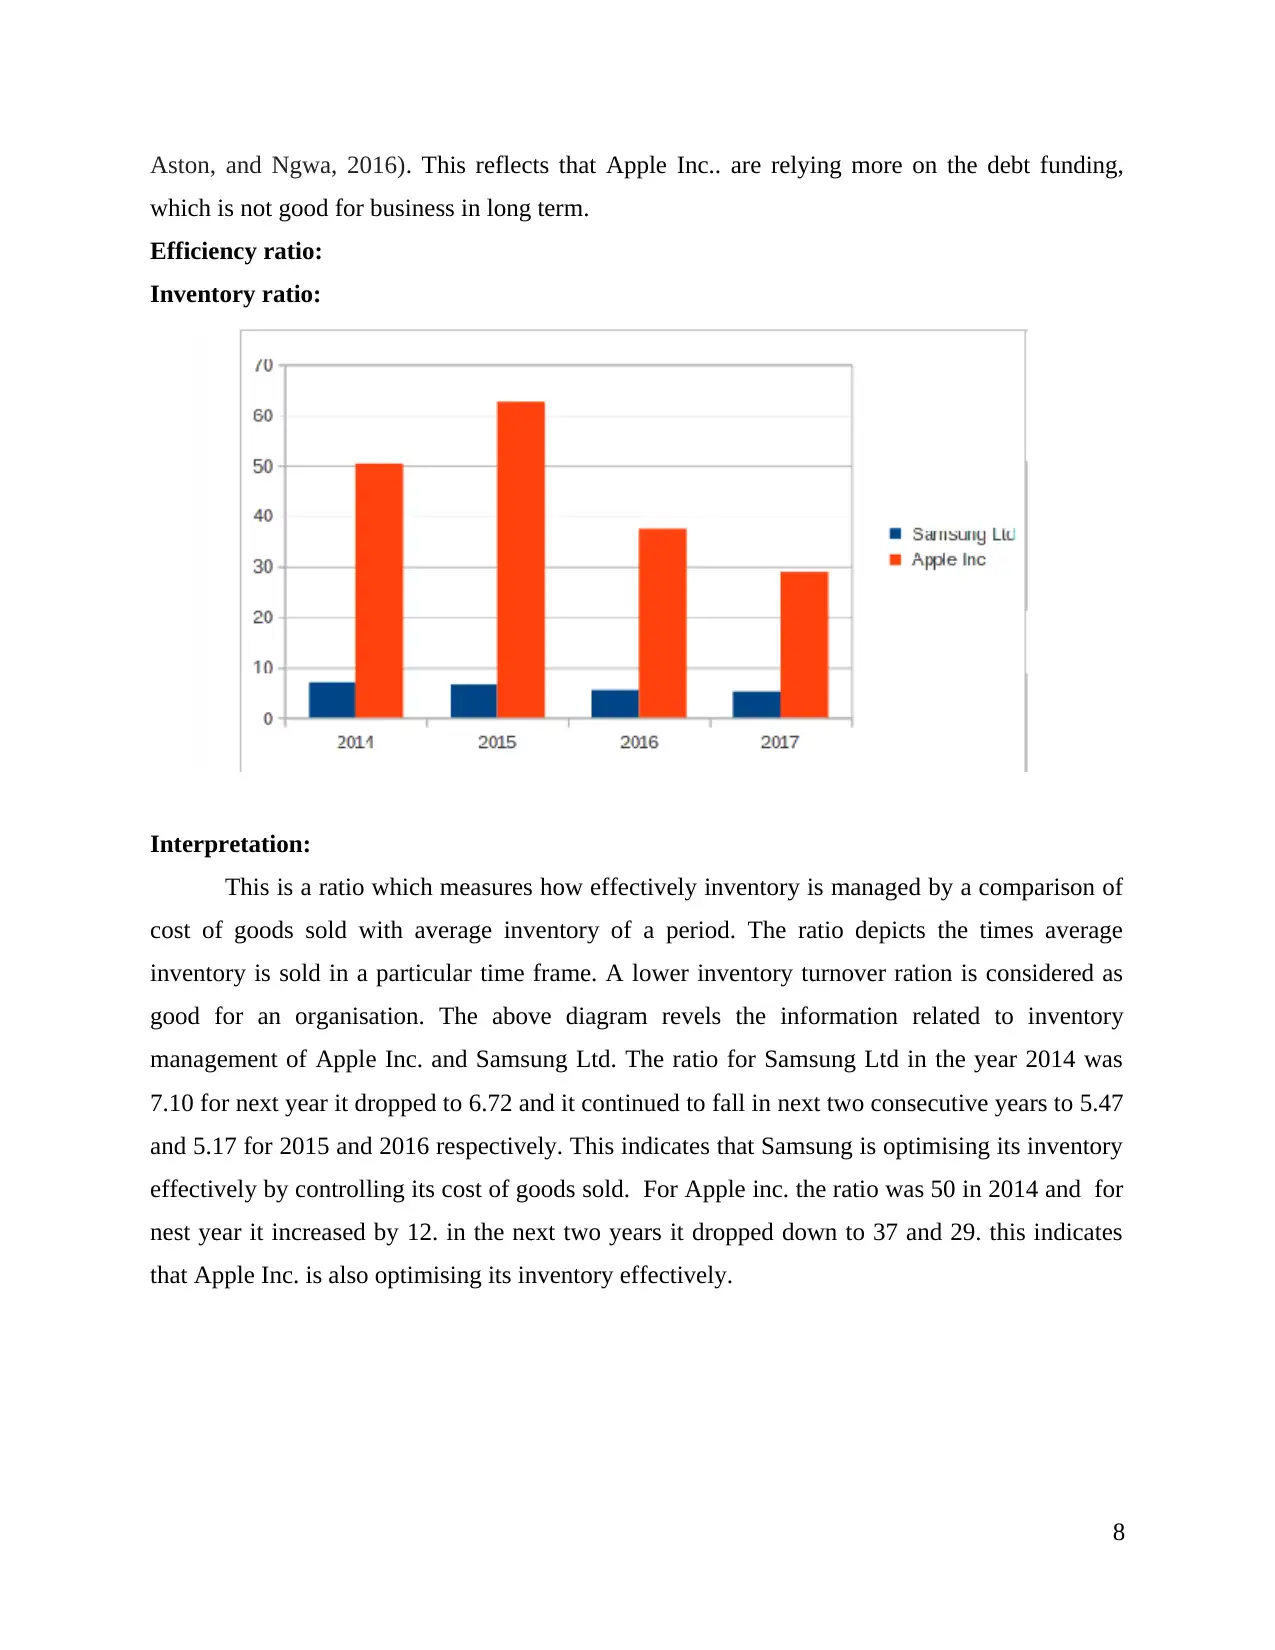
Inventory ratio:
Interpretation:
This is a ratio which measures how effectively inventory is managed by a comparison of
cost of goods sold with average inventory of a period. The ratio depicts the times average
inventory is sold in a particular time frame. A lower inventory turnover ration is considered as
good for an organisation. The above diagram revels the information related to inventory
management of Apple Inc. and Samsung Ltd. The ratio for Samsung Ltd in the year 2014 was
7.10 for next year it dropped to 6.72 and it continued to fall in next two consecutive years to 5.47
and 5.17 for 2015 and 2016 respectively. This indicates that Samsung is optimising its inventory
effectively by controlling its cost of goods sold. For Apple inc. the ratio was 50 in 2014 and for
nest year it increased by 12. in the next two years it dropped down to 37 and 29. this indicates
that Apple Inc. is also optimising its inventory effectively.
8
which is not good for business in long term.
Efficiency ratio:
Inventory ratio:
Interpretation:
This is a ratio which measures how effectively inventory is managed by a comparison of
cost of goods sold with average inventory of a period. The ratio depicts the times average
inventory is sold in a particular time frame. A lower inventory turnover ration is considered as
good for an organisation. The above diagram revels the information related to inventory
management of Apple Inc. and Samsung Ltd. The ratio for Samsung Ltd in the year 2014 was
7.10 for next year it dropped to 6.72 and it continued to fall in next two consecutive years to 5.47
and 5.17 for 2015 and 2016 respectively. This indicates that Samsung is optimising its inventory
effectively by controlling its cost of goods sold. For Apple inc. the ratio was 50 in 2014 and for
nest year it increased by 12. in the next two years it dropped down to 37 and 29. this indicates
that Apple Inc. is also optimising its inventory effectively.
8
Paraphrase This Document
Need a fresh take? Get an instant paraphrase of this document with our AI Paraphraser
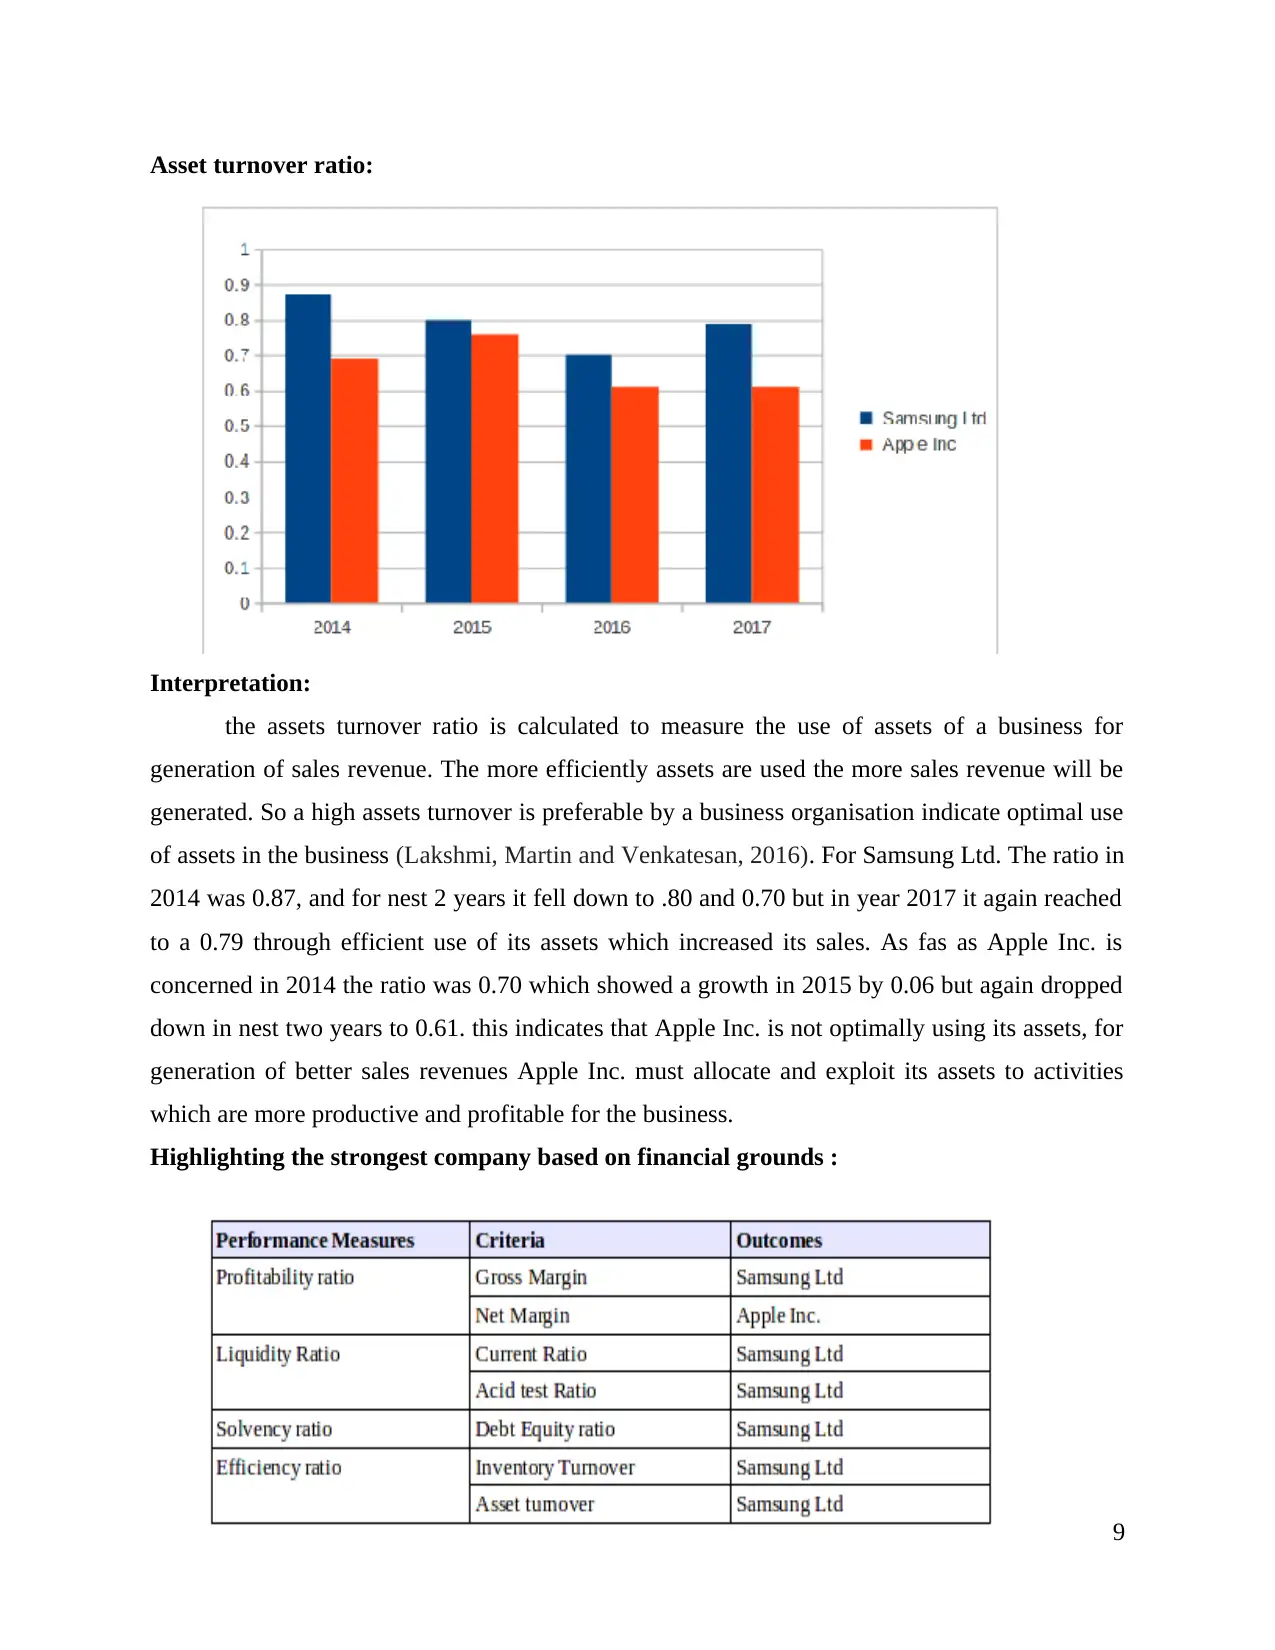
Asset turnover ratio:
Interpretation:
the assets turnover ratio is calculated to measure the use of assets of a business for
generation of sales revenue. The more efficiently assets are used the more sales revenue will be
generated. So a high assets turnover is preferable by a business organisation indicate optimal use
of assets in the business (Lakshmi, Martin and Venkatesan, 2016). For Samsung Ltd. The ratio in
2014 was 0.87, and for nest 2 years it fell down to .80 and 0.70 but in year 2017 it again reached
to a 0.79 through efficient use of its assets which increased its sales. As fas as Apple Inc. is
concerned in 2014 the ratio was 0.70 which showed a growth in 2015 by 0.06 but again dropped
down in nest two years to 0.61. this indicates that Apple Inc. is not optimally using its assets, for
generation of better sales revenues Apple Inc. must allocate and exploit its assets to activities
which are more productive and profitable for the business.
Highlighting the strongest company based on financial grounds :
9
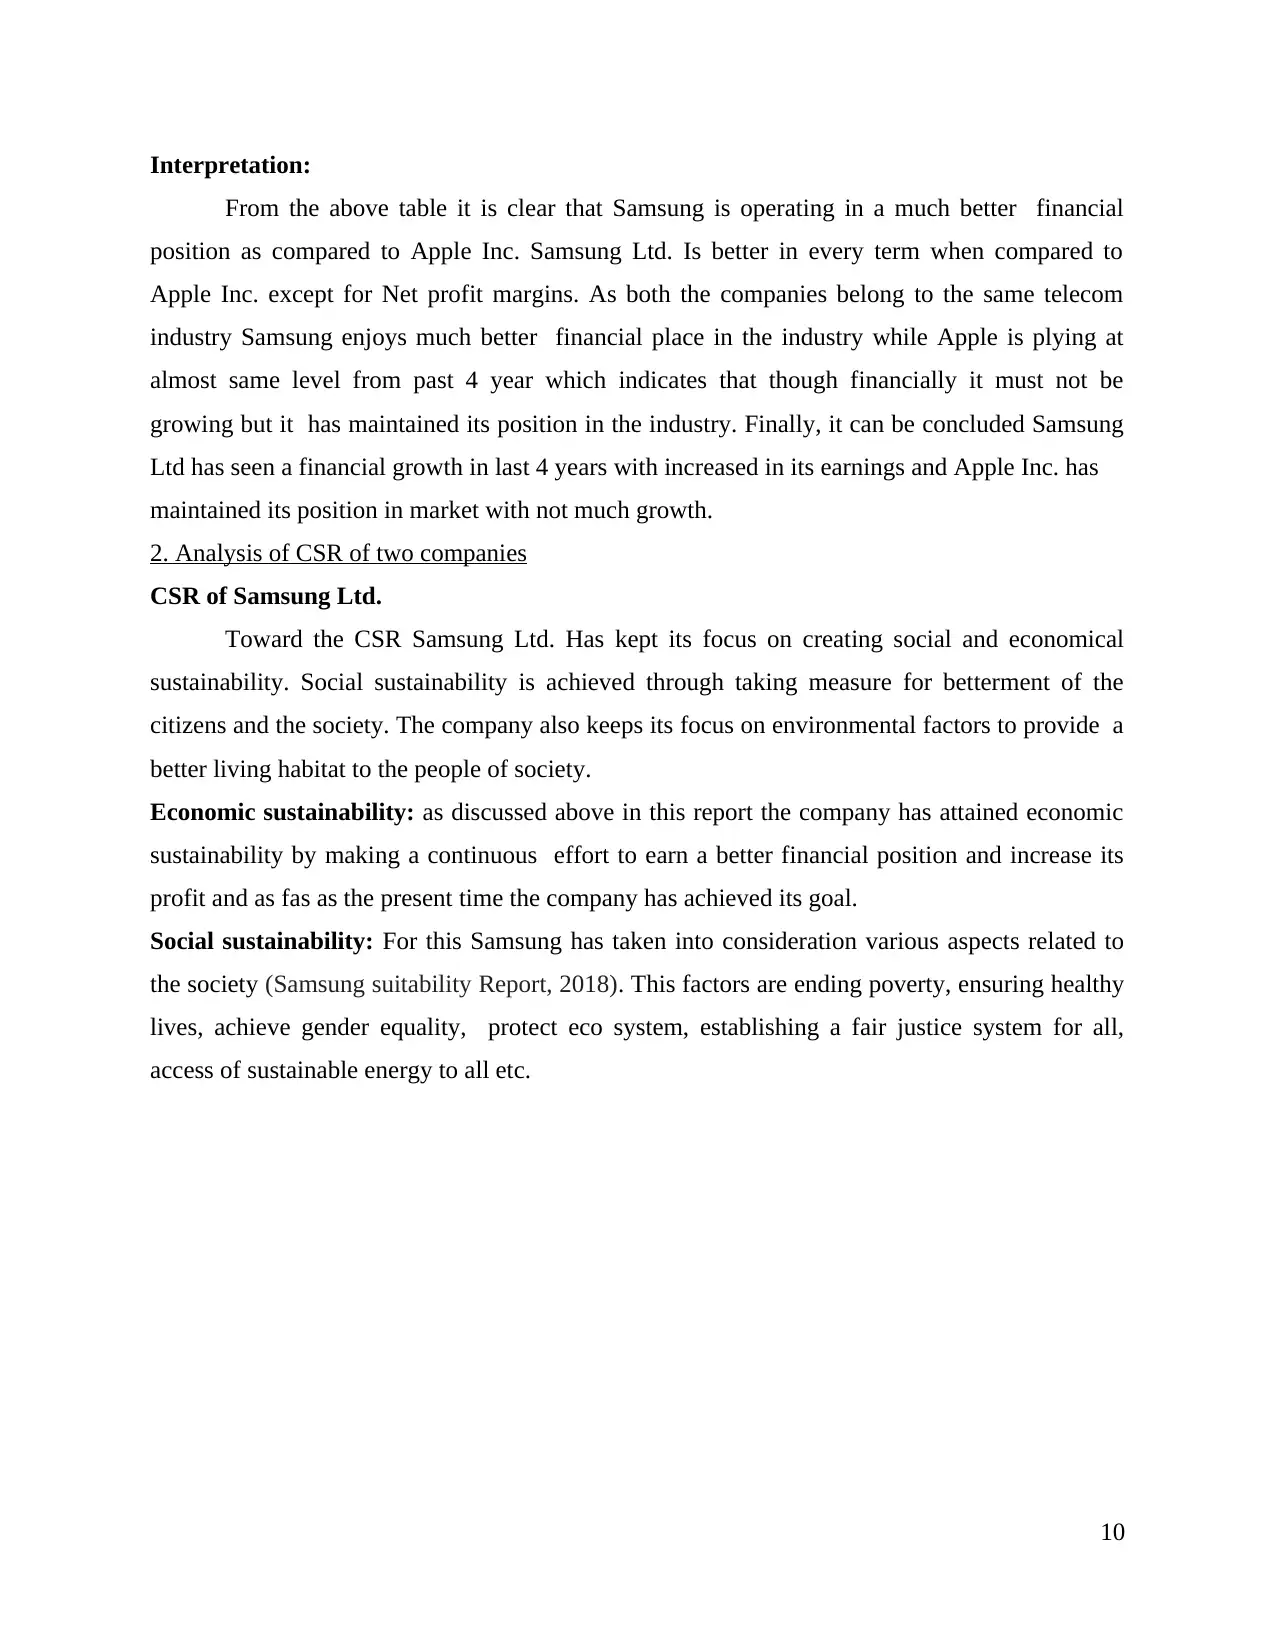
Interpretation:
From the above table it is clear that Samsung is operating in a much better financial
position as compared to Apple Inc. Samsung Ltd. Is better in every term when compared to
Apple Inc. except for Net profit margins. As both the companies belong to the same telecom
industry Samsung enjoys much better financial place in the industry while Apple is plying at
almost same level from past 4 year which indicates that though financially it must not be
growing but it has maintained its position in the industry. Finally, it can be concluded Samsung
Ltd has seen a financial growth in last 4 years with increased in its earnings and Apple Inc. has
maintained its position in market with not much growth.
2. Analysis of CSR of two companies
CSR of Samsung Ltd.
Toward the CSR Samsung Ltd. Has kept its focus on creating social and economical
sustainability. Social sustainability is achieved through taking measure for betterment of the
citizens and the society. The company also keeps its focus on environmental factors to provide a
better living habitat to the people of society.
Economic sustainability: as discussed above in this report the company has attained economic
sustainability by making a continuous effort to earn a better financial position and increase its
profit and as fas as the present time the company has achieved its goal.
Social sustainability: For this Samsung has taken into consideration various aspects related to
the society (Samsung suitability Report, 2018). This factors are ending poverty, ensuring healthy
lives, achieve gender equality, protect eco system, establishing a fair justice system for all,
access of sustainable energy to all etc.
10
⊘ This is a preview!⊘
Do you want full access?
Subscribe today to unlock all pages.
Trusted by 1+ million students worldwide
1 out of 18
Related Documents


Your All-in-One AI-Powered Toolkit for Academic Success.
+13062052269
info@desklib.com
Available 24*7 on WhatsApp / Email
![[object Object]](/_next/static/media/star-bottom.7253800d.svg)
Unlock your academic potential
Copyright © 2020–2026 A2Z Services. All Rights Reserved. Developed and managed by ZUCOL.