Comparative Financial Ratio Analysis: ERM Energy and Pacific Energy
VerifiedAdded on 2019/10/30
|8
|2164
|255
Report
AI Summary
This report presents a comprehensive financial analysis comparing ERM Energy and Pacific Energy Limited, both operating in the Australian energy sector. The analysis encompasses a detailed examination of financial ratios, including profitability, asset efficiency, liquidity, and capital structure ratios, providing insights into each company's financial performance. The report highlights the strengths and weaknesses of each company based on these ratios, with Pacific Energy emerging as a potentially better investment due to its superior capital structure and profitability metrics. Furthermore, the report incorporates a Corporate Social Responsibility (CSR) analysis, revealing that ERM Energy demonstrates stronger performance in sustainability practices. The study concludes by emphasizing the importance of integrating both financial and non-financial information for making well-informed investment decisions, supporting the recommendation to consider both financial metrics and CSR performance when evaluating investment opportunities in the energy sector.

Accounting for Business Decisions
Paraphrase This Document
Need a fresh take? Get an instant paraphrase of this document with our AI Paraphraser
Executive Summary
The present report is developed for implementing the quantitative and qualitative
analysis in the financial information for supporting the decision-making process. In this
context, the report has carried out financial ratio analysis of ERM Energy and Pacific Energy
Limited operating in the energy sector of Australia. It has been inferred from the overall
financial ratio analysis that Pacific Energy Company is better for investment purposes. Also,
the CSR analysis of both the companies has revealed ERM Energy Limited is performing
better on sustainability perspectives. As such, based on the overall analysis it can be said that
investors should select the company on the basis of integration of both financial and non-
financial information for realizing good returns on their investment.
Contents
Introduction................................................................................................................................4
Part B: Financial ratio analysis and interpretation.....................................................................4
Answer 1.................................................................................................................................4
Answer 2.................................................................................................................................6
Answer 3.................................................................................................................................6
Limitations of financial ratio analysis and non-financial information of an entity....................7
Conclusion..................................................................................................................................7
References..................................................................................................................................8
⊘ This is a preview!⊘
Do you want full access?
Subscribe today to unlock all pages.
Trusted by 1+ million students worldwide
Introduction
The analysis and interpretation of financial position of a business entity is essential
for the end-users such as investors and creditors for taking accurate investment decisions. As
such, the report discusses and analyses the findings obtained from financial analysis of two
ASX listed companies operating in the same sector in Australia. The companies selected for
the purpose are ERM Energy and Pacific Energy Limited. The reports present the findings
interpreted from the horizontal, vertical and ratio analysis of both the companies. It also
provides recommendations to the investors regarding their potential investment decision
based on their financial performances. The limitations of the investment decisions based on
the financial statements analysis is also discussed in the report. The investment decision
recommend is also supported from the CSR performance of both the companies.
Part B: Financial ratio analysis and interpretation
Answer 1
The financial ratio analysis is an important tool in analysing and examining the
financial performance of both the companies. The analysis will help the end-users in making
decisions relating to their investment in either of two companies (Stickney et al., 2009). The
results interpreted from the financial ratio analysis of both the companies can be discussed as
follows:
Profitability
The profitability ratio helps in evaluating the earnings realised by a company as
compared to the expenses incurred during a specific period of time (Weygandt, Kieso and
Kimmel, 2010). The profitability position of both the companies is analysed through the
calculation of the following ratios:
Return on Equity: The return on equity ratio measures the efficiency of a company in
generating earnings in comparison to the investment incurred. The return on equity
ratio of Pacific Energy Limited is 11.9% and of ERM Power Limited is 9% and
therefore it can be said that ROE of Pacific Energy is better than ERM Energy.
Return on Assets: The ratio measures the profit or loss realised by a company from its
overall assets. The return on assets of Pacific Energy Limited is 8.58% which is far
better than that of ERM Energy of 3.31%.
Profit Margin: The profit margin ratio depicts the profit realised by a company in
comparison to the sales revenue. The profit margin of Pacific Energy is 31.37% as
compared to ERM Energy of 1.3%.
Cash Flow to Sales Ratio: The ratio measures the net cash flow realised by a
company in comparison to the sales revenue. The ratio of Pacific Energy Limited is
68.63% as compared to ERM Energy of 4.34% (Morning Star, 2017).
Asset Efficiency Ratio
Paraphrase This Document
Need a fresh take? Get an instant paraphrase of this document with our AI Paraphraser
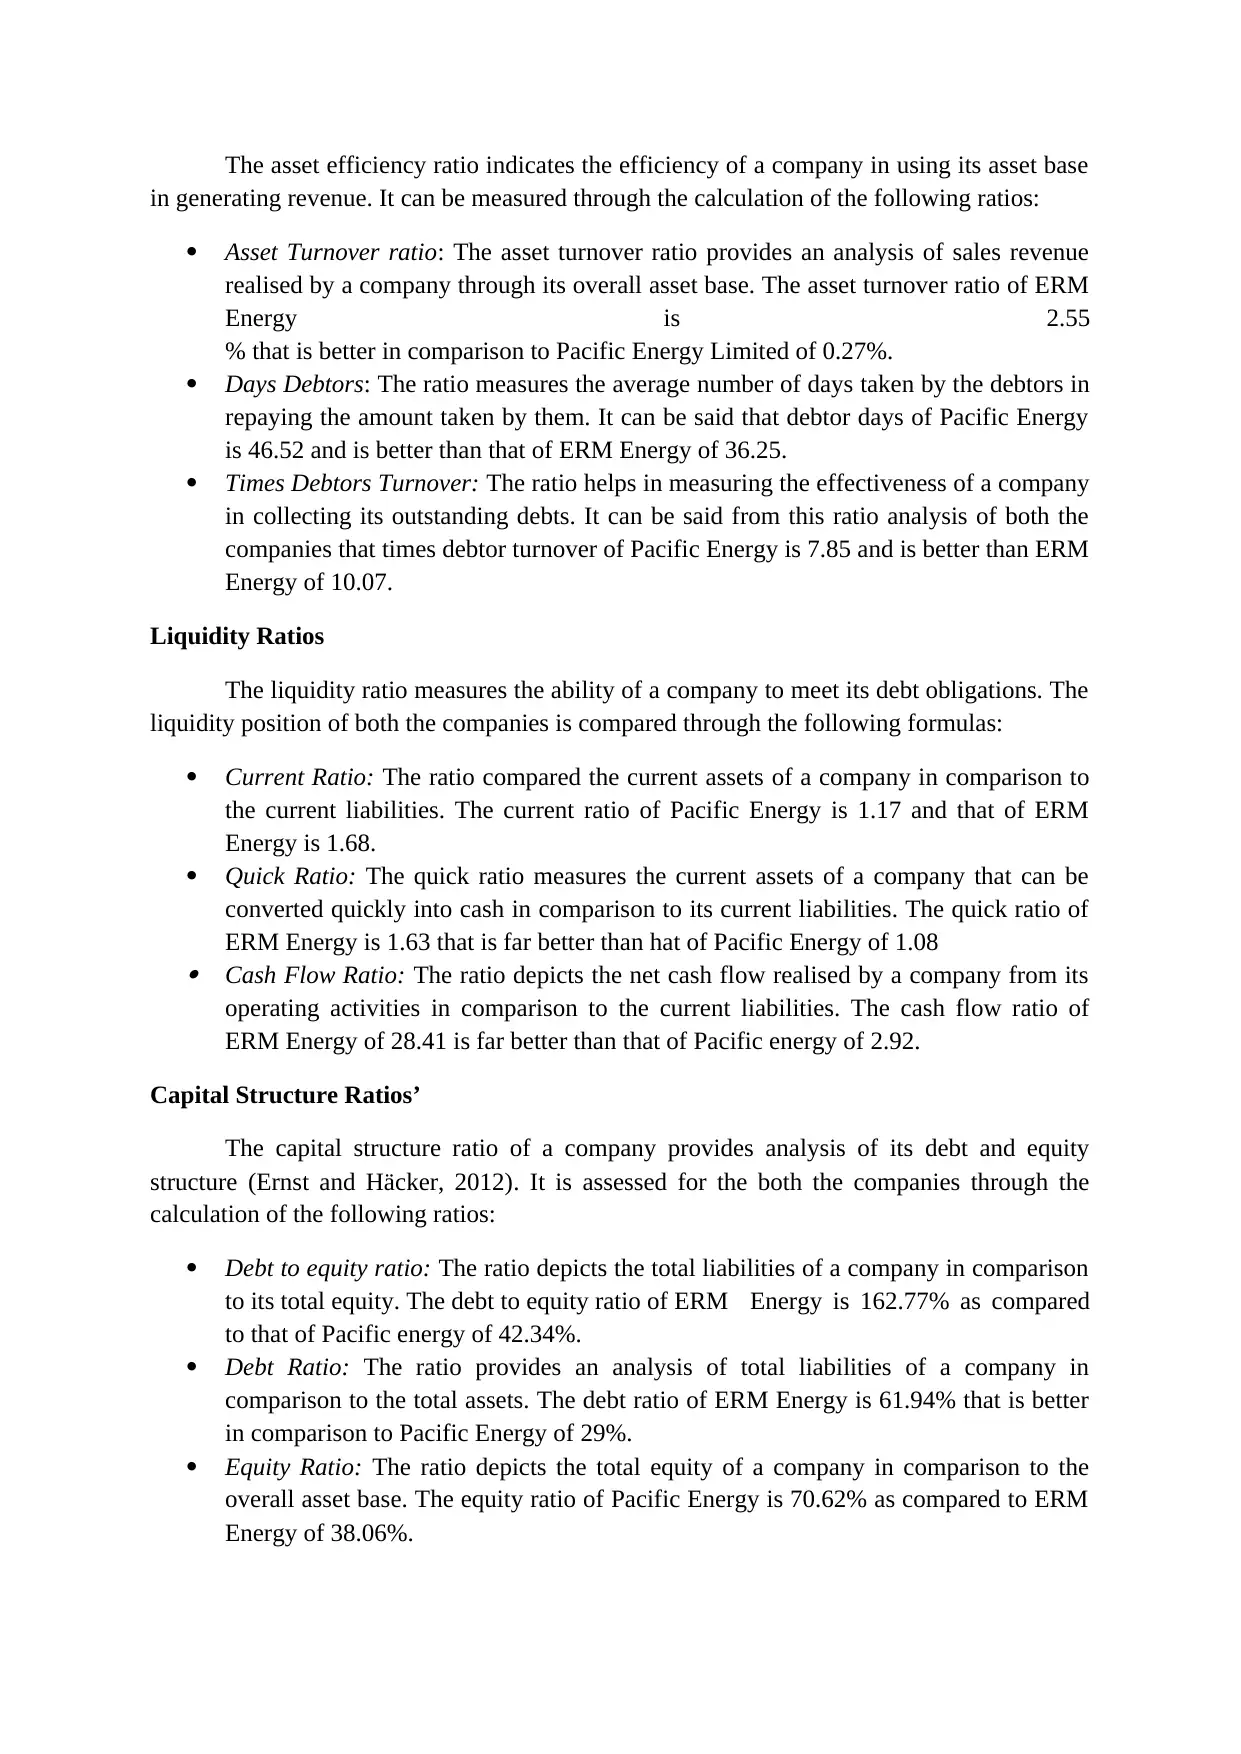
The asset efficiency ratio indicates the efficiency of a company in using its asset base
in generating revenue. It can be measured through the calculation of the following ratios:
Asset Turnover ratio: The asset turnover ratio provides an analysis of sales revenue
realised by a company through its overall asset base. The asset turnover ratio of ERM
Energy is 2.55
% that is better in comparison to Pacific Energy Limited of 0.27%.
Days Debtors: The ratio measures the average number of days taken by the debtors in
repaying the amount taken by them. It can be said that debtor days of Pacific Energy
is 46.52 and is better than that of ERM Energy of 36.25.
Times Debtors Turnover: The ratio helps in measuring the effectiveness of a company
in collecting its outstanding debts. It can be said from this ratio analysis of both the
companies that times debtor turnover of Pacific Energy is 7.85 and is better than ERM
Energy of 10.07.
Liquidity Ratios
The liquidity ratio measures the ability of a company to meet its debt obligations. The
liquidity position of both the companies is compared through the following formulas:
Current Ratio: The ratio compared the current assets of a company in comparison to
the current liabilities. The current ratio of Pacific Energy is 1.17 and that of ERM
Energy is 1.68.
Quick Ratio: The quick ratio measures the current assets of a company that can be
converted quickly into cash in comparison to its current liabilities. The quick ratio of
ERM Energy is 1.63 that is far better than hat of Pacific Energy of 1.08
Cash Flow Ratio: The ratio depicts the net cash flow realised by a company from its
operating activities in comparison to the current liabilities. The cash flow ratio of
ERM Energy of 28.41 is far better than that of Pacific energy of 2.92.
Capital Structure Ratios’
The capital structure ratio of a company provides analysis of its debt and equity
structure (Ernst and Häcker, 2012). It is assessed for the both the companies through the
calculation of the following ratios:
Debt to equity ratio: The ratio depicts the total liabilities of a company in comparison
to its total equity. The debt to equity ratio of ERM Energy is 162.77% as compared
to that of Pacific energy of 42.34%.
Debt Ratio: The ratio provides an analysis of total liabilities of a company in
comparison to the total assets. The debt ratio of ERM Energy is 61.94% that is better
in comparison to Pacific Energy of 29%.
Equity Ratio: The ratio depicts the total equity of a company in comparison to the
overall asset base. The equity ratio of Pacific Energy is 70.62% as compared to ERM
Energy of 38.06%.
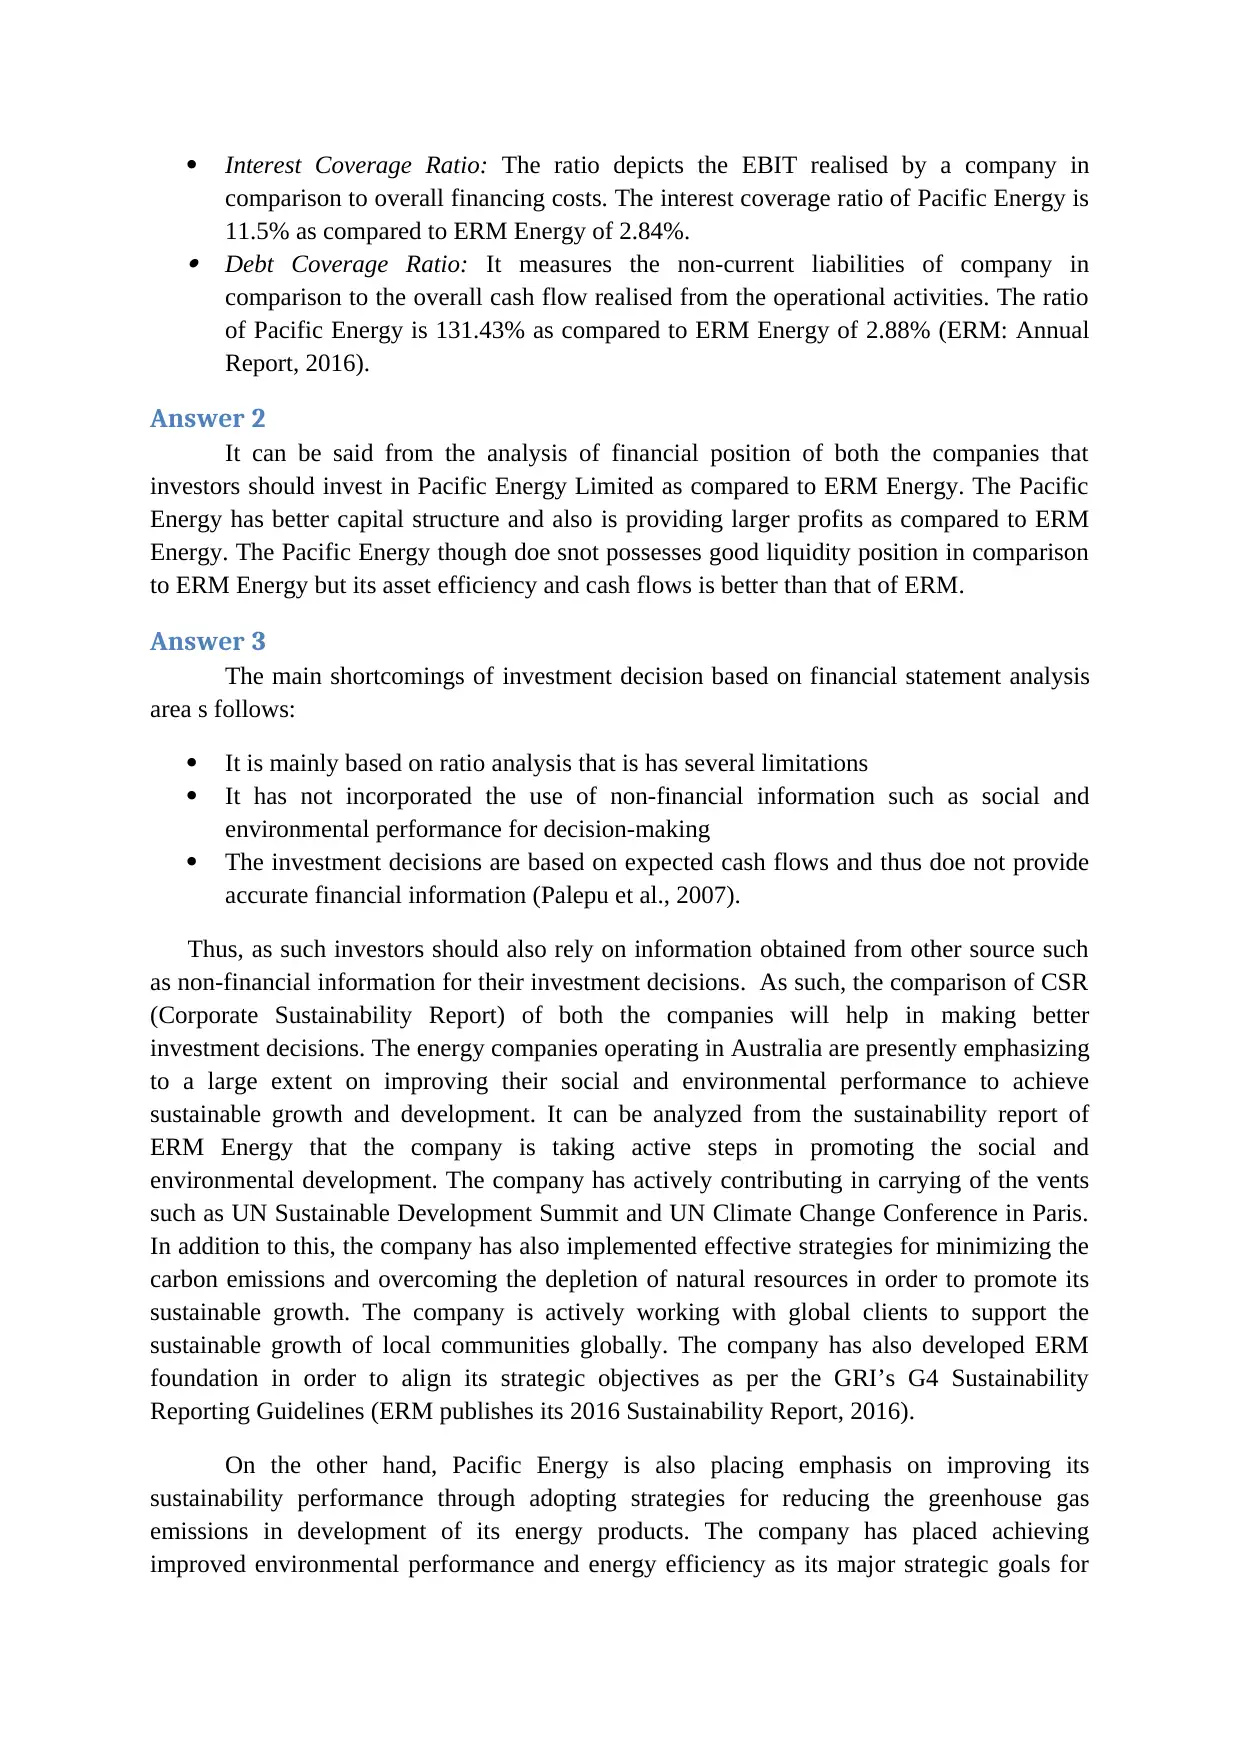
Interest Coverage Ratio: The ratio depicts the EBIT realised by a company in
comparison to overall financing costs. The interest coverage ratio of Pacific Energy is
11.5% as compared to ERM Energy of 2.84%.
Debt Coverage Ratio: It measures the non-current liabilities of company in
comparison to the overall cash flow realised from the operational activities. The ratio
of Pacific Energy is 131.43% as compared to ERM Energy of 2.88% (ERM: Annual
Report, 2016).
Answer 2
It can be said from the analysis of financial position of both the companies that
investors should invest in Pacific Energy Limited as compared to ERM Energy. The Pacific
Energy has better capital structure and also is providing larger profits as compared to ERM
Energy. The Pacific Energy though doe snot possesses good liquidity position in comparison
to ERM Energy but its asset efficiency and cash flows is better than that of ERM.
Answer 3
The main shortcomings of investment decision based on financial statement analysis
area s follows:
It is mainly based on ratio analysis that is has several limitations
It has not incorporated the use of non-financial information such as social and
environmental performance for decision-making
The investment decisions are based on expected cash flows and thus doe not provide
accurate financial information (Palepu et al., 2007).
Thus, as such investors should also rely on information obtained from other source such
as non-financial information for their investment decisions. As such, the comparison of CSR
(Corporate Sustainability Report) of both the companies will help in making better
investment decisions. The energy companies operating in Australia are presently emphasizing
to a large extent on improving their social and environmental performance to achieve
sustainable growth and development. It can be analyzed from the sustainability report of
ERM Energy that the company is taking active steps in promoting the social and
environmental development. The company has actively contributing in carrying of the vents
such as UN Sustainable Development Summit and UN Climate Change Conference in Paris.
In addition to this, the company has also implemented effective strategies for minimizing the
carbon emissions and overcoming the depletion of natural resources in order to promote its
sustainable growth. The company is actively working with global clients to support the
sustainable growth of local communities globally. The company has also developed ERM
foundation in order to align its strategic objectives as per the GRI’s G4 Sustainability
Reporting Guidelines (ERM publishes its 2016 Sustainability Report, 2016).
On the other hand, Pacific Energy is also placing emphasis on improving its
sustainability performance through adopting strategies for reducing the greenhouse gas
emissions in development of its energy products. The company has placed achieving
improved environmental performance and energy efficiency as its major strategic goals for
⊘ This is a preview!⊘
Do you want full access?
Subscribe today to unlock all pages.
Trusted by 1+ million students worldwide
promoting the social and environmental development. The company is also attributed to be a
recognized leader in developing clean burn technology. Therefore, it can be said although
both the companies are implementing strategies for improving the sustainable performance
but ERM is performing better on the basis of sustainability perspectives. The Pacific Energy
Limited has not disclosed its CSR reports and therefore investors re recommend investing in
ERM as it has provided larger information reading its social and environmental performance
(Pacific Energy, 2017).
Limitations of financial ratio analysis and non-financial information
of an entity
The financial ratio analysis through supports the decision-making process of investors
by providing an insight into the present and future financial condition of a business entity has
also some limitations. The ratio analysis helps the investors in comparing the financial
position of different business entities but sometimes the results obtained from its use is not
accurate due to some limitations of the method. The major limitation of ratio analysis is that
some results obtained from the method are based on historical data and some on current
financial data (Gibson, 2010). For example, the income statements report some financial
elements on the current costs while in balance sheet some information is stated on historical
cost. As such, the ratio analysis can provide unusual financial results. Also, the use of only
non-financial information in decision-making has a major problem that it does not depict the
future performance of an entity in absence of accounting estimations and predictions (Weil,
Schipper and Francis, 2013).
Conclusion
It can be inferred from the overall report that end-users should integrate the use of
both financial and non-financial information in making investment decisions.
Paraphrase This Document
Need a fresh take? Get an instant paraphrase of this document with our AI Paraphraser
References
Annual Report. 2016. ERM Limited.
ERM publishes its 2016 Sustainability Report. 2016. [Online]. Available at:
http://www.erm.com/en/news-events/news/erm-publishes-its-sustainability-report-2016/
[Accessed on: 7 October, 2017].
Ernst, D. and Häcker, J. 2012. Applied International Corporate Finance. Vahlen.
Gibson, C. 2010. Financial Reporting and Analysis: Using Financial Accounting
Information. Cengage Learning.
Morning Star. 2017. Pacific Energy Ltd PEA. [Online]. Available at:
http://financials.morningstar.com/balance-sheet/bs.html?t=PEA®ion=aus&culture=en-US
[Accessed on: 7 October, 2017].
Pacific Energy. 2017. Green Energy. [Online]. Available at: https://pacificenergy.net/green-
energy [Accessed on: 7 October, 2017].
Palepu, K. et al. 2007. Business Analysis and Valuation: Text and Cases. Cengage Learning
EMEA.
Stickney, C.P. et al. 2009. Financial Accounting: An Introduction to Concepts, Methods and
Uses. Cengage Learning.
Weil, R., Schipper, K. and Francis, J. 2013. Financial Accounting: An Introduction to
Concepts, Methods and Uses. Cengage Learning.
Weygandt, J., Kieso, D.E. and Kimmel, P.D. 2010. Financial Accounting: IFRS. John Wiley
& Sons.
1 out of 8
Related Documents


Your All-in-One AI-Powered Toolkit for Academic Success.
+13062052269
info@desklib.com
Available 24*7 on WhatsApp / Email
![[object Object]](/_next/static/media/star-bottom.7253800d.svg)
Unlock your academic potential
Copyright © 2020–2026 A2Z Services. All Rights Reserved. Developed and managed by ZUCOL.