Report: Financial Ratio Analysis of DAMAC and Al-Mazaya Holdings
VerifiedAdded on 2020/04/29
|42
|8122
|192
Report
AI Summary
This report presents a detailed financial analysis of DAMAC Properties and Al-Mazaya Holdings, two prominent real estate companies in the Middle East. The analysis focuses on key financial ratios, including operating profit margin, return on capital employed, capital gearing ratio, interest coverage ratio, asset turnover ratio, and P/E ratio, to assess their financial performance. The report examines the companies' missions, visions, and goals, providing context for the financial data. It compares the performance of both companies over two years, highlighting trends and significant changes in their financial health. The analysis also considers industry benchmarks and external factors influencing the companies' profitability and efficiency. The report concludes with an evaluation of each company's strengths and weaknesses, offering insights into their financial positions and future prospects. Appendices include detailed financial data and company overviews.

Running head: ACCOUNT
Account
Name of the student
Name of the university
Author note
Account
Name of the student
Name of the university
Author note
Paraphrase This Document
Need a fresh take? Get an instant paraphrase of this document with our AI Paraphraser
1ACCOUNT
Table of Contents
Part 1..........................................................................................................................................3
Introduction............................................................................................................................3
Ratio analysis and financial performance..............................................................................5
Ratio analysis.........................................................................................................................6
Operating profit margin ratio.................................................................................................7
Return on capital employed...................................................................................................8
Capital gearing ratio...............................................................................................................9
Interest coverage ratio..........................................................................................................10
Asset turnover ratio..............................................................................................................10
P/E ratio................................................................................................................................11
Conclusion............................................................................................................................12
Part 2........................................................................................................................................13
Introduction..........................................................................................................................13
Sources of funds...................................................................................................................14
Final verdict.........................................................................................................................17
Part 3........................................................................................................................................20
Answer to Question 1...........................................................................................................20
Answer to Question 2...........................................................................................................21
Answer to Question 3...........................................................................................................21
2ACCOUNT
Answer to Question 4...........................................................................................................23
Answer to Question 5...........................................................................................................24
Answer to Question 6...........................................................................................................25
Answer to Question 7...........................................................................................................25
Answer to Question 8...........................................................................................................26
Answer to Question 9...........................................................................................................26
Answer to Question 10.........................................................................................................27
References................................................................................................................................29
Appendix..................................................................................................................................34
DAMAC Properties..............................................................................................................34
Al-Mazaya Holdings............................................................................................................37
⊘ This is a preview!⊘
Do you want full access?
Subscribe today to unlock all pages.
Trusted by 1+ million students worldwide
3ACCOUNT
Part 1
Introduction
DAMAC Properties
The DAMAC properties is at forefront of the luxury real estate market of Middle East
since 2002 that delivers leisure, commercial and luxury residential properties all over Saudi
Arabia, UAE, Jordan Qatar, United Kingdom and Lebanon. Making their mark at highest end
of the stylish living, the company cemented the leading place in the industry and it delivers to
almost 20,000 homes with the development portfolio for more than 44,000 units at different
progress stages. It prides itself on the uncompromising commitment for serving excellence
service to the clients irrespective of whether they are assisting the young couple searching for
new homes or providing the advises to the investors with regard to properties. That is why the
company is identified among the leaders with respect to the luxury developers in Middle
East.
The vision of the company is to become the leader in the luxury developer all over the
Middle East and realises that the customers dreams through building the highest quality
commercial, leisure and residential developments. At heart of DAMAC properties the culture
Paraphrase This Document
Need a fresh take? Get an instant paraphrase of this document with our AI Paraphraser
4ACCOUNT
focuses on the preferences of the customers to deliver the vision to them. For ensuring the
vision development the customers are delivered with highest standards possible, the company
delivers the proper working environment for their talented employees, chooses right partners
and develops the project in the prime locations and utilises the building material that is most
sophisticated.
The mission statement of the company is – “DAMAC Properties, as the leading
developer for luxury real estate, strives to deliver the unique living concepts and dream
homes to the customers from all over the world”.
Al - Mazaya
Al – Mzaya is is well known among the highly thought and most important in the real
estate development entity in Middle East market with various impressive projects. The
company believes that with the requirements of rigorous and strong investment in the sector
and with respect to maintain and create the trust of wide range of investors in Kuwati market
and in the overseas market. The company is engaged in various other fields related to real
estate like ownership, selling and purchasing the lands and developing the land for outside of
Kuwait and inside of the company. The company handles the management, properties of the
parties, investment and operation, renting the hotels, leasing, health clubs, recreational parks,
exhibitions, restaurants, commercial and residential complexes, health resorts and tourists.
5ACCOUNT
The vision of the company is to be among the market leaders in the sector of the
development of real estate and to work with the targeted prospective and the strong brand
name that will deliver the distinguished products to the customers.
The mission of the company is to –
Develop the land mark projects
Sustain the value added quality for the projects
Develop the human capital with high calibre
Diversify projects for encompassing the wide spectrum for real estate sectors.
Further, as per the message of the cEO, the company’s goals are –
Sidestepping the market risks
Boarding on the new developments in each fiscal years
Deliver and execute periodical sales for the real estate developments
10% growth in the net profits
Managing the debt of the company in sound way and securing the high credit ranking
from the agencies those are internationally recognized.
Ratio analysis and financial performance
Ratio analysis is the quantitative analysis for the contained information in the
financial statement of the company. The analysis of the ratios are based on the line items in
the financial statements of the company like income statement, balance sheet and cash flow
sttaemnet (Amornkitvikai and Harvie 2017). The analysis of ratios is utilised for evaluating
the different aspects of the company’s financial and operating performances with regard to its
liquidity, efficiency, solvency and profitability. The ratio trends over the time is analysed and
compared with the competitors and the industry average to evaluate whether they are
⊘ This is a preview!⊘
Do you want full access?
Subscribe today to unlock all pages.
Trusted by 1+ million students worldwide
6ACCOUNT
improving or getting worsen. Though various ratios are there, the invstors are mainly
concerned with the key ratios mainly like profitability ratio, capital gearing ratio, P/E ratio.
Further, most of the companies have the specific range as the benchmark and while the
company’s ratio does not fall within the range then it will be regarded as overvalued and
undervalued based on the ratios (Ashton and Gregoriou 2017).
The ratios are generally compared across various companies from the same sector as
the acceptable ratio in the one industry can be considered as too high for another. For
instance, the companies in the utility sectors may have high ratio for debt-equity, however the
similar ratio for the technology company may be considered as exceptionally high (Babalola
and Abiola 2013). Normally the successful entities have the strong ratios in all aspects and
the hints of the weaknesses in one sector may highlight the significant selling-off the
inventories. Few ratios are closely analyzed as their relevance to the specific sector, for
instance, the inventory turnover for retail sector and the outstanding sales for days for the
technology sectors.
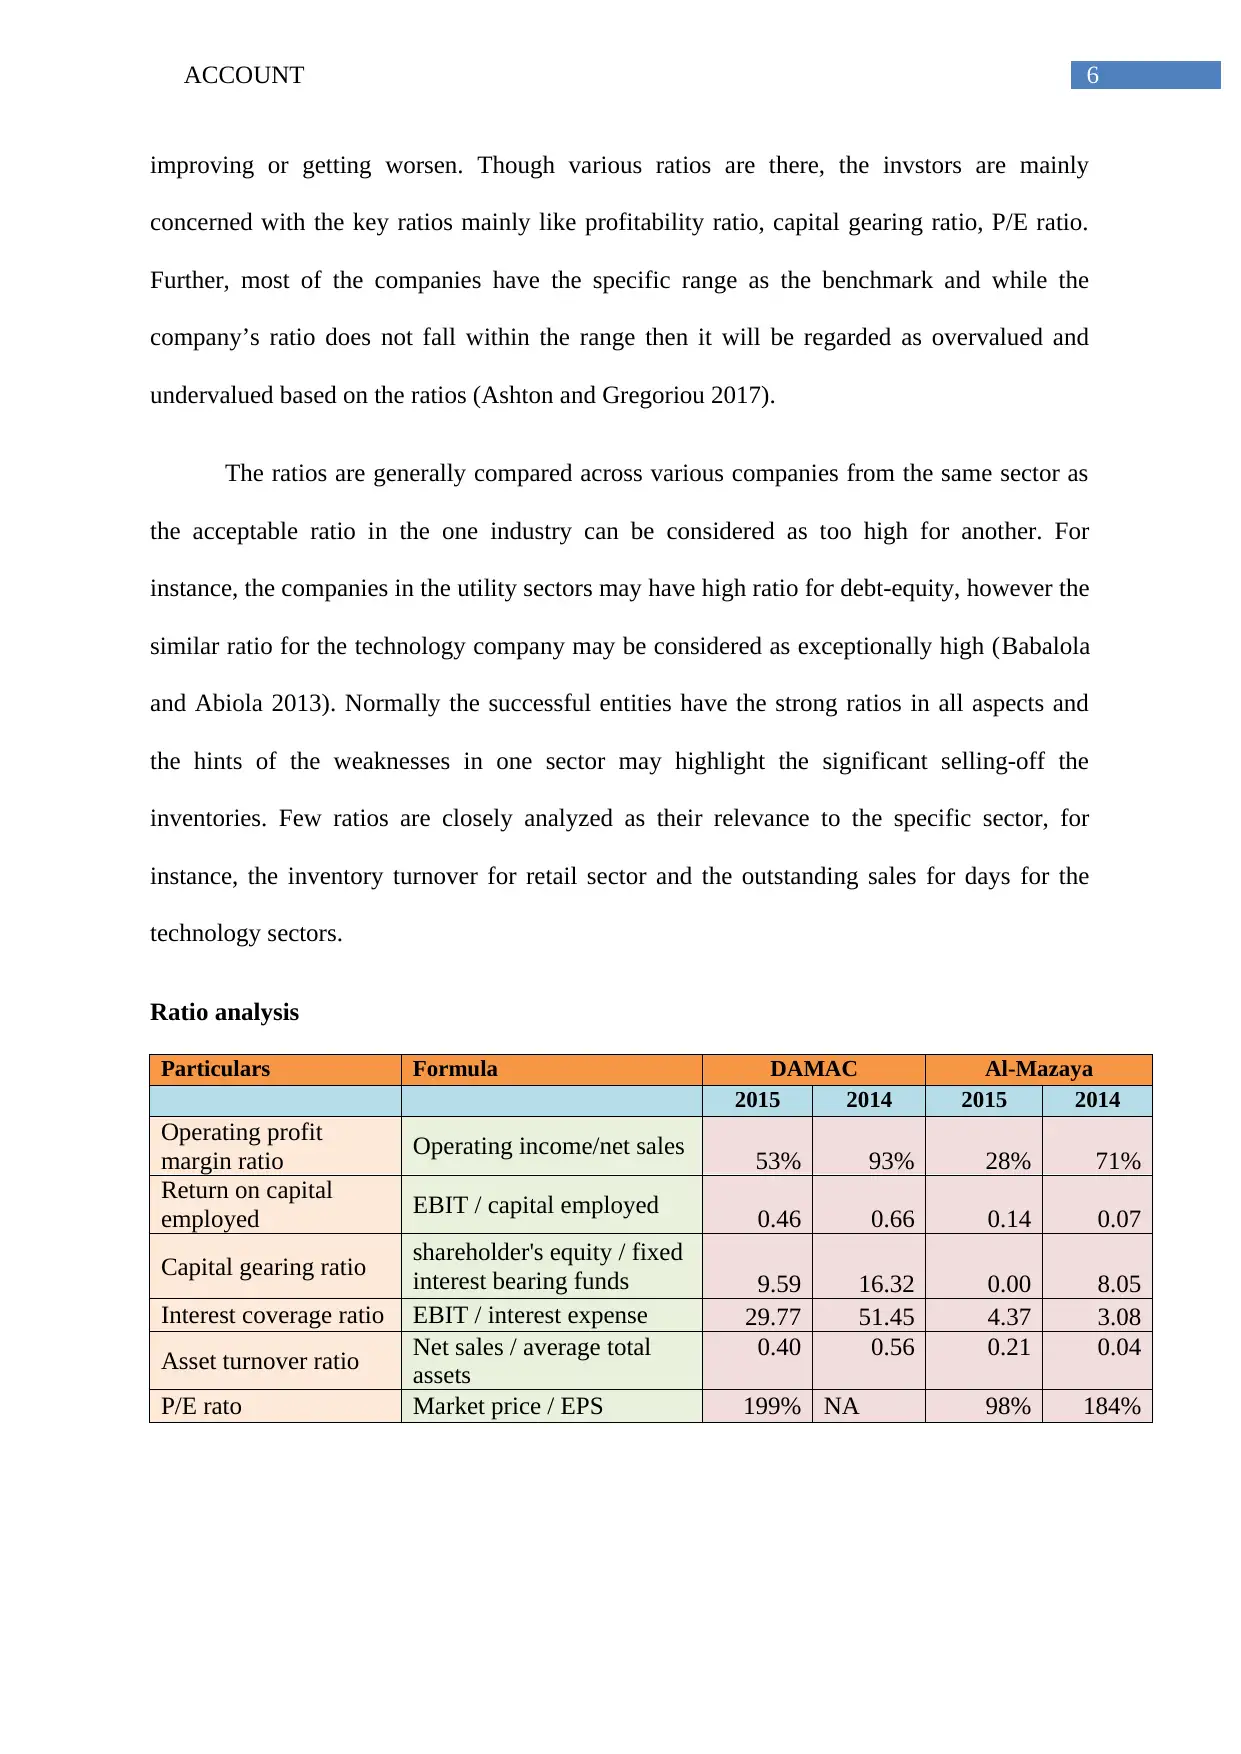
Ratio analysis
Particulars Formula DAMAC Al-Mazaya
2015 2014 2015 2014
Operating profit
margin ratio Operating income/net sales 53% 93% 28% 71%
Return on capital
employed EBIT / capital employed 0.46 0.66 0.14 0.07
Capital gearing ratio shareholder's equity / fixed
interest bearing funds 9.59 16.32 0.00 8.05
Interest coverage ratio EBIT / interest expense 29.77 51.45 4.37 3.08
Asset turnover ratio Net sales / average total
assets
0.40 0.56 0.21 0.04
P/E rato Market price / EPS 199% NA 98% 184%
improving or getting worsen. Though various ratios are there, the invstors are mainly
concerned with the key ratios mainly like profitability ratio, capital gearing ratio, P/E ratio.
Further, most of the companies have the specific range as the benchmark and while the
company’s ratio does not fall within the range then it will be regarded as overvalued and
undervalued based on the ratios (Ashton and Gregoriou 2017).
The ratios are generally compared across various companies from the same sector as
the acceptable ratio in the one industry can be considered as too high for another. For
instance, the companies in the utility sectors may have high ratio for debt-equity, however the
similar ratio for the technology company may be considered as exceptionally high (Babalola
and Abiola 2013). Normally the successful entities have the strong ratios in all aspects and
the hints of the weaknesses in one sector may highlight the significant selling-off the
inventories. Few ratios are closely analyzed as their relevance to the specific sector, for
instance, the inventory turnover for retail sector and the outstanding sales for days for the
technology sectors.
Ratio analysis
Particulars Formula DAMAC Al-Mazaya
2015 2014 2015 2014
Operating profit
margin ratio Operating income/net sales 53% 93% 28% 71%
Return on capital
employed EBIT / capital employed 0.46 0.66 0.14 0.07
Capital gearing ratio shareholder's equity / fixed
interest bearing funds 9.59 16.32 0.00 8.05
Interest coverage ratio EBIT / interest expense 29.77 51.45 4.37 3.08
Asset turnover ratio Net sales / average total
assets
0.40 0.56 0.21 0.04
P/E rato Market price / EPS 199% NA 98% 184%
Paraphrase This Document
Need a fresh take? Get an instant paraphrase of this document with our AI Paraphraser
7ACCOUNT
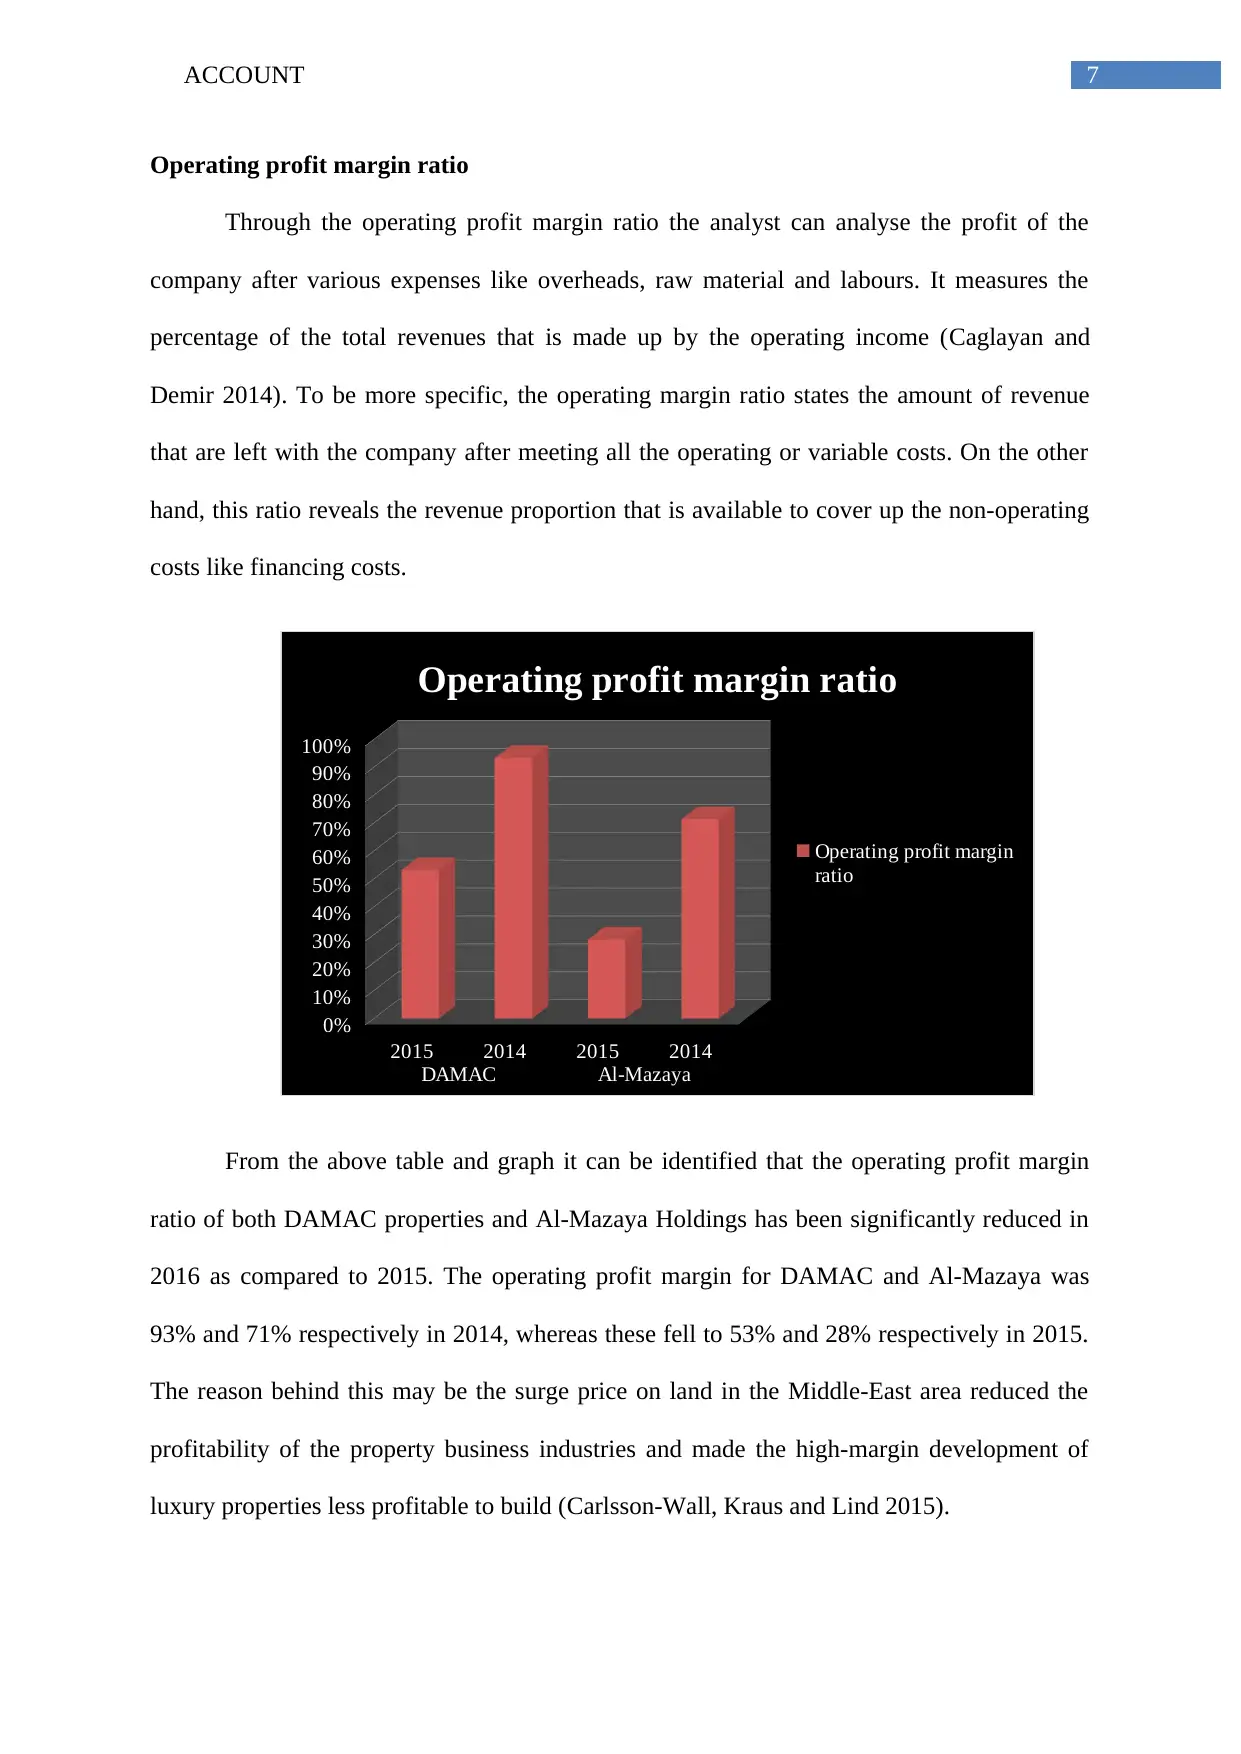
Operating profit margin ratio
Through the operating profit margin ratio the analyst can analyse the profit of the
company after various expenses like overheads, raw material and labours. It measures the
percentage of the total revenues that is made up by the operating income (Caglayan and
Demir 2014). To be more specific, the operating margin ratio states the amount of revenue
that are left with the company after meeting all the operating or variable costs. On the other
hand, this ratio reveals the revenue proportion that is available to cover up the non-operating
costs like financing costs.
2015 2014 2015 2014
DAMAC Al-Mazaya
0%
10%
20%
30%
40%
50%
60%
70%
80%
90%
100%
Operating profit margin ratio
Operating profit margin
ratio
From the above table and graph it can be identified that the operating profit margin
ratio of both DAMAC properties and Al-Mazaya Holdings has been significantly reduced in
2016 as compared to 2015. The operating profit margin for DAMAC and Al-Mazaya was
93% and 71% respectively in 2014, whereas these fell to 53% and 28% respectively in 2015.
The reason behind this may be the surge price on land in the Middle-East area reduced the
profitability of the property business industries and made the high-margin development of
luxury properties less profitable to build (Carlsson-Wall, Kraus and Lind 2015).
Operating profit margin ratio
Through the operating profit margin ratio the analyst can analyse the profit of the
company after various expenses like overheads, raw material and labours. It measures the
percentage of the total revenues that is made up by the operating income (Caglayan and
Demir 2014). To be more specific, the operating margin ratio states the amount of revenue
that are left with the company after meeting all the operating or variable costs. On the other
hand, this ratio reveals the revenue proportion that is available to cover up the non-operating
costs like financing costs.
2015 2014 2015 2014
DAMAC Al-Mazaya
0%
10%
20%
30%
40%
50%
60%
70%
80%
90%
100%
Operating profit margin ratio
Operating profit margin
ratio
From the above table and graph it can be identified that the operating profit margin
ratio of both DAMAC properties and Al-Mazaya Holdings has been significantly reduced in
2016 as compared to 2015. The operating profit margin for DAMAC and Al-Mazaya was
93% and 71% respectively in 2014, whereas these fell to 53% and 28% respectively in 2015.
The reason behind this may be the surge price on land in the Middle-East area reduced the
profitability of the property business industries and made the high-margin development of
luxury properties less profitable to build (Carlsson-Wall, Kraus and Lind 2015).
8ACCOUNT
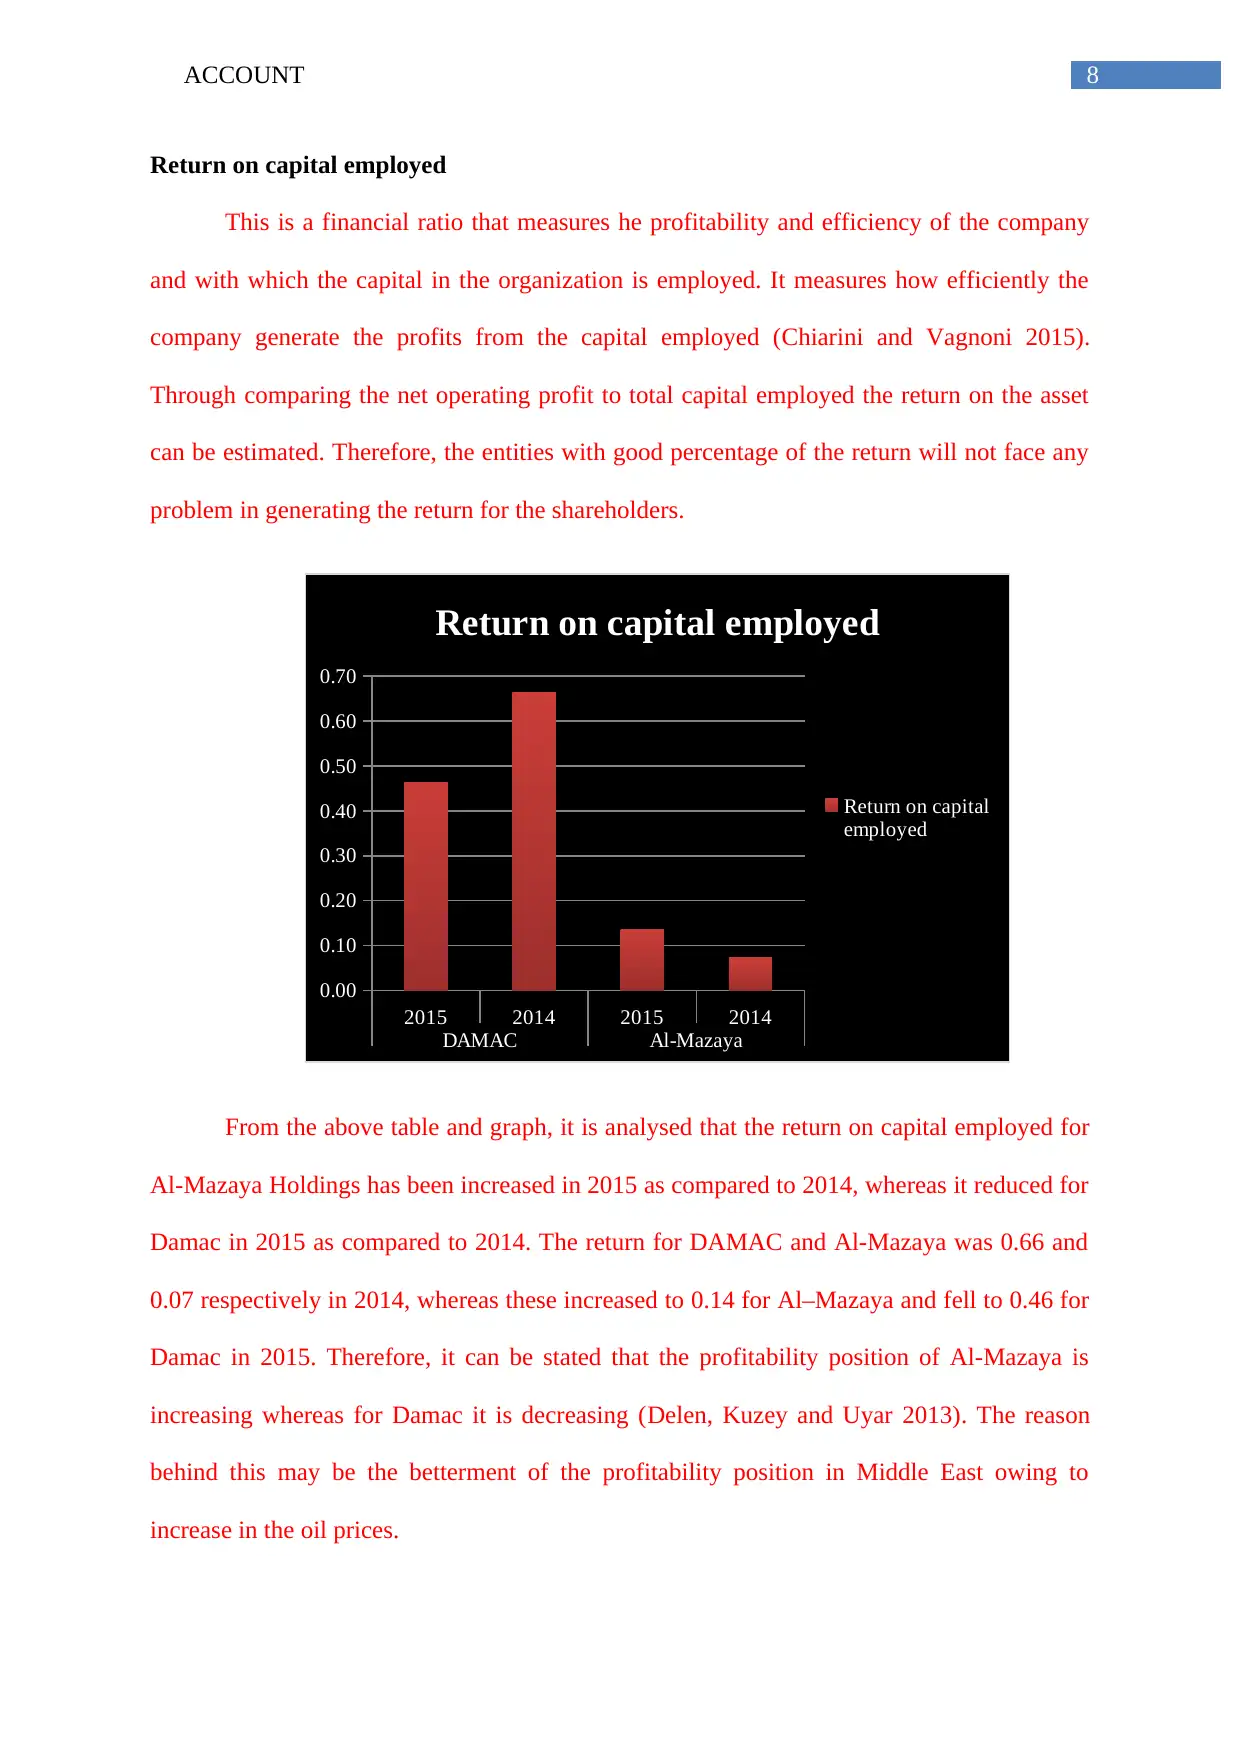
Return on capital employed
This is a financial ratio that measures he profitability and efficiency of the company
and with which the capital in the organization is employed. It measures how efficiently the
company generate the profits from the capital employed (Chiarini and Vagnoni 2015).
Through comparing the net operating profit to total capital employed the return on the asset
can be estimated. Therefore, the entities with good percentage of the return will not face any
problem in generating the return for the shareholders.
2015 2014 2015 2014
DAMAC Al-Mazaya
0.00
0.10
0.20
0.30
0.40
0.50
0.60
0.70
Return on capital employed
Return on capital
employed
From the above table and graph, it is analysed that the return on capital employed for
Al-Mazaya Holdings has been increased in 2015 as compared to 2014, whereas it reduced for
Damac in 2015 as compared to 2014. The return for DAMAC and Al-Mazaya was 0.66 and
0.07 respectively in 2014, whereas these increased to 0.14 for Al–Mazaya and fell to 0.46 for
Damac in 2015. Therefore, it can be stated that the profitability position of Al-Mazaya is
increasing whereas for Damac it is decreasing (Delen, Kuzey and Uyar 2013). The reason
behind this may be the betterment of the profitability position in Middle East owing to
increase in the oil prices.
Return on capital employed
This is a financial ratio that measures he profitability and efficiency of the company
and with which the capital in the organization is employed. It measures how efficiently the
company generate the profits from the capital employed (Chiarini and Vagnoni 2015).
Through comparing the net operating profit to total capital employed the return on the asset
can be estimated. Therefore, the entities with good percentage of the return will not face any
problem in generating the return for the shareholders.
2015 2014 2015 2014
DAMAC Al-Mazaya
0.00
0.10
0.20
0.30
0.40
0.50
0.60
0.70
Return on capital employed
Return on capital
employed
From the above table and graph, it is analysed that the return on capital employed for
Al-Mazaya Holdings has been increased in 2015 as compared to 2014, whereas it reduced for
Damac in 2015 as compared to 2014. The return for DAMAC and Al-Mazaya was 0.66 and
0.07 respectively in 2014, whereas these increased to 0.14 for Al–Mazaya and fell to 0.46 for
Damac in 2015. Therefore, it can be stated that the profitability position of Al-Mazaya is
increasing whereas for Damac it is decreasing (Delen, Kuzey and Uyar 2013). The reason
behind this may be the betterment of the profitability position in Middle East owing to
increase in the oil prices.
⊘ This is a preview!⊘
Do you want full access?
Subscribe today to unlock all pages.
Trusted by 1+ million students worldwide
9ACCOUNT
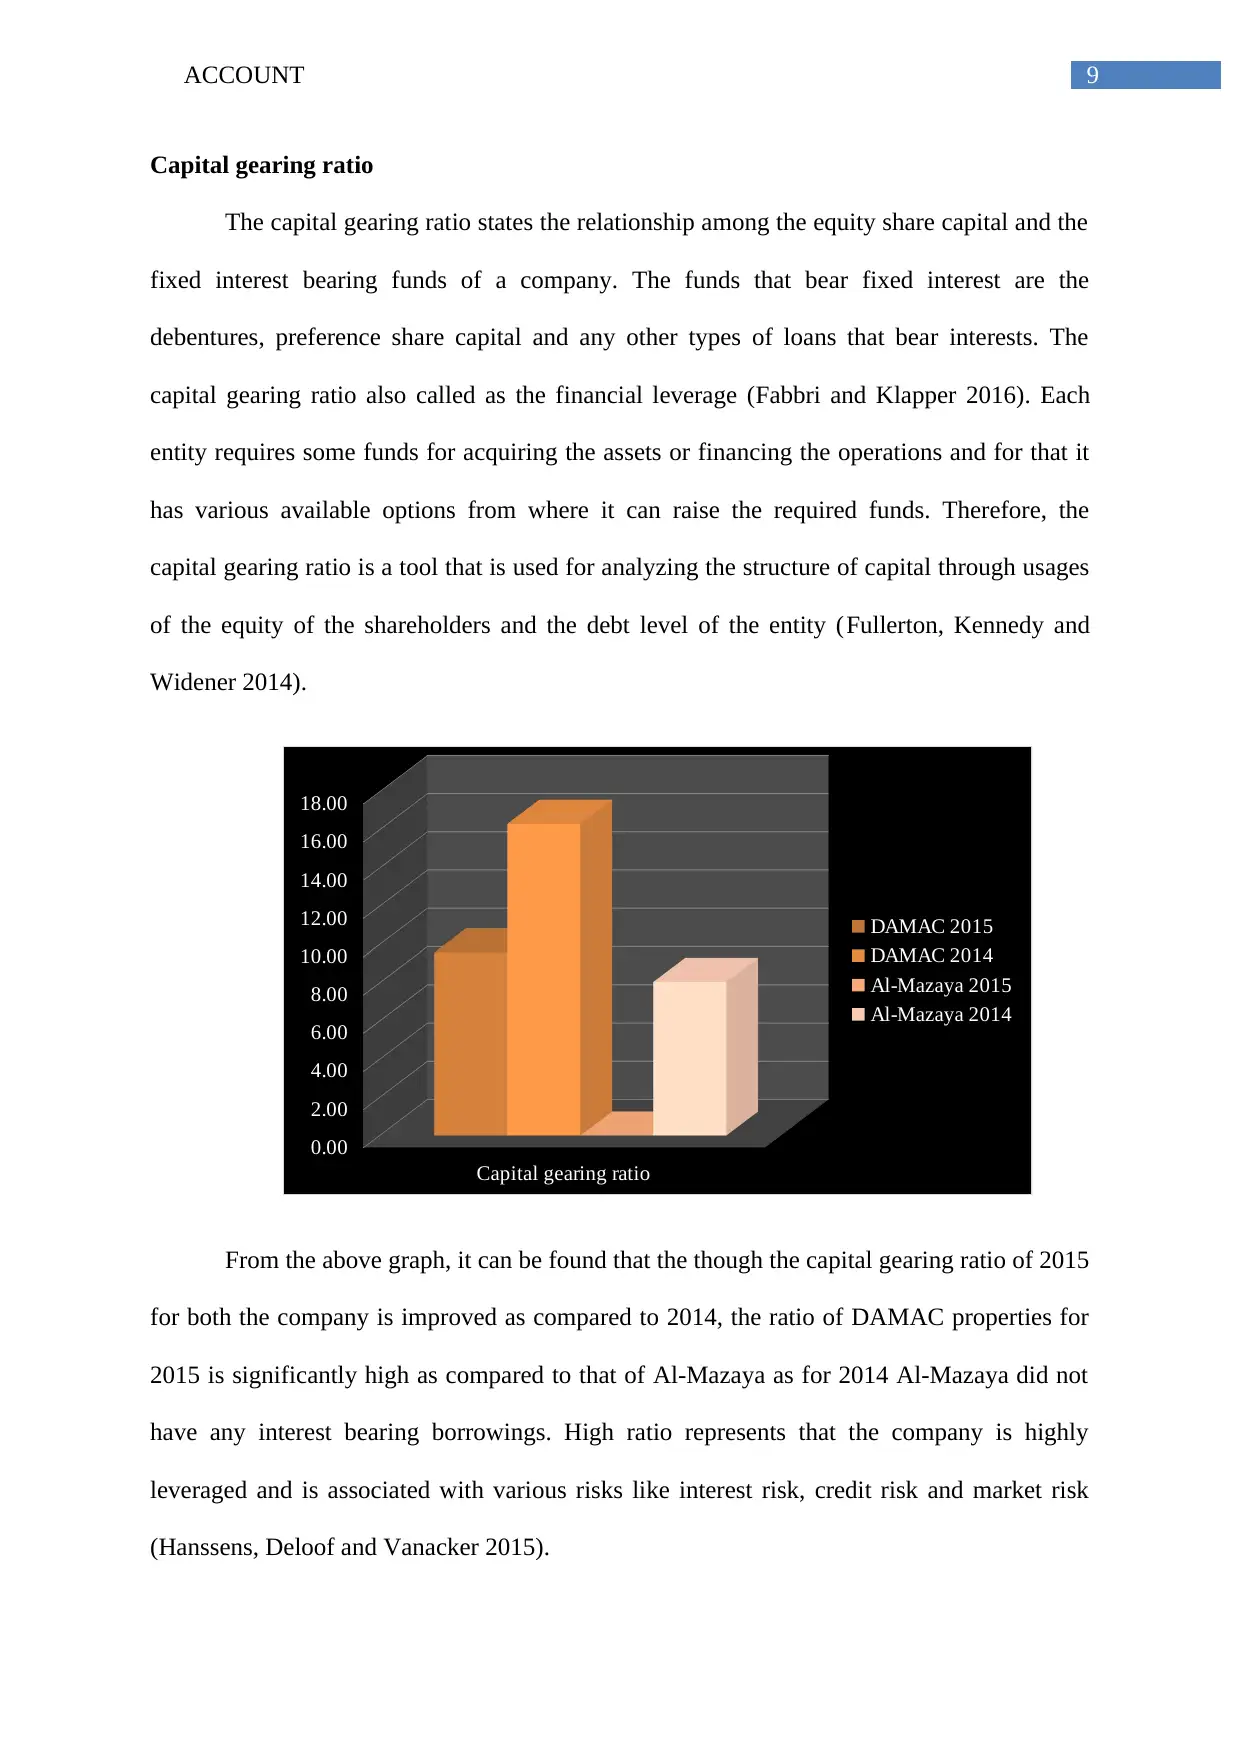
Capital gearing ratio
The capital gearing ratio states the relationship among the equity share capital and the
fixed interest bearing funds of a company. The funds that bear fixed interest are the
debentures, preference share capital and any other types of loans that bear interests. The
capital gearing ratio also called as the financial leverage (Fabbri and Klapper 2016). Each
entity requires some funds for acquiring the assets or financing the operations and for that it
has various available options from where it can raise the required funds. Therefore, the
capital gearing ratio is a tool that is used for analyzing the structure of capital through usages
of the equity of the shareholders and the debt level of the entity (Fullerton, Kennedy and
Widener 2014).
Capital gearing ratio
0.00
2.00
4.00
6.00
8.00
10.00
12.00
14.00
16.00
18.00
DAMAC 2015
DAMAC 2014
Al-Mazaya 2015
Al-Mazaya 2014
From the above graph, it can be found that the though the capital gearing ratio of 2015
for both the company is improved as compared to 2014, the ratio of DAMAC properties for
2015 is significantly high as compared to that of Al-Mazaya as for 2014 Al-Mazaya did not
have any interest bearing borrowings. High ratio represents that the company is highly
leveraged and is associated with various risks like interest risk, credit risk and market risk
(Hanssens, Deloof and Vanacker 2015).
Capital gearing ratio
The capital gearing ratio states the relationship among the equity share capital and the
fixed interest bearing funds of a company. The funds that bear fixed interest are the
debentures, preference share capital and any other types of loans that bear interests. The
capital gearing ratio also called as the financial leverage (Fabbri and Klapper 2016). Each
entity requires some funds for acquiring the assets or financing the operations and for that it
has various available options from where it can raise the required funds. Therefore, the
capital gearing ratio is a tool that is used for analyzing the structure of capital through usages
of the equity of the shareholders and the debt level of the entity (Fullerton, Kennedy and
Widener 2014).
Capital gearing ratio
0.00
2.00
4.00
6.00
8.00
10.00
12.00
14.00
16.00
18.00
DAMAC 2015
DAMAC 2014
Al-Mazaya 2015
Al-Mazaya 2014
From the above graph, it can be found that the though the capital gearing ratio of 2015
for both the company is improved as compared to 2014, the ratio of DAMAC properties for
2015 is significantly high as compared to that of Al-Mazaya as for 2014 Al-Mazaya did not
have any interest bearing borrowings. High ratio represents that the company is highly
leveraged and is associated with various risks like interest risk, credit risk and market risk
(Hanssens, Deloof and Vanacker 2015).
Paraphrase This Document
Need a fresh take? Get an instant paraphrase of this document with our AI Paraphraser
10ACCOUNT
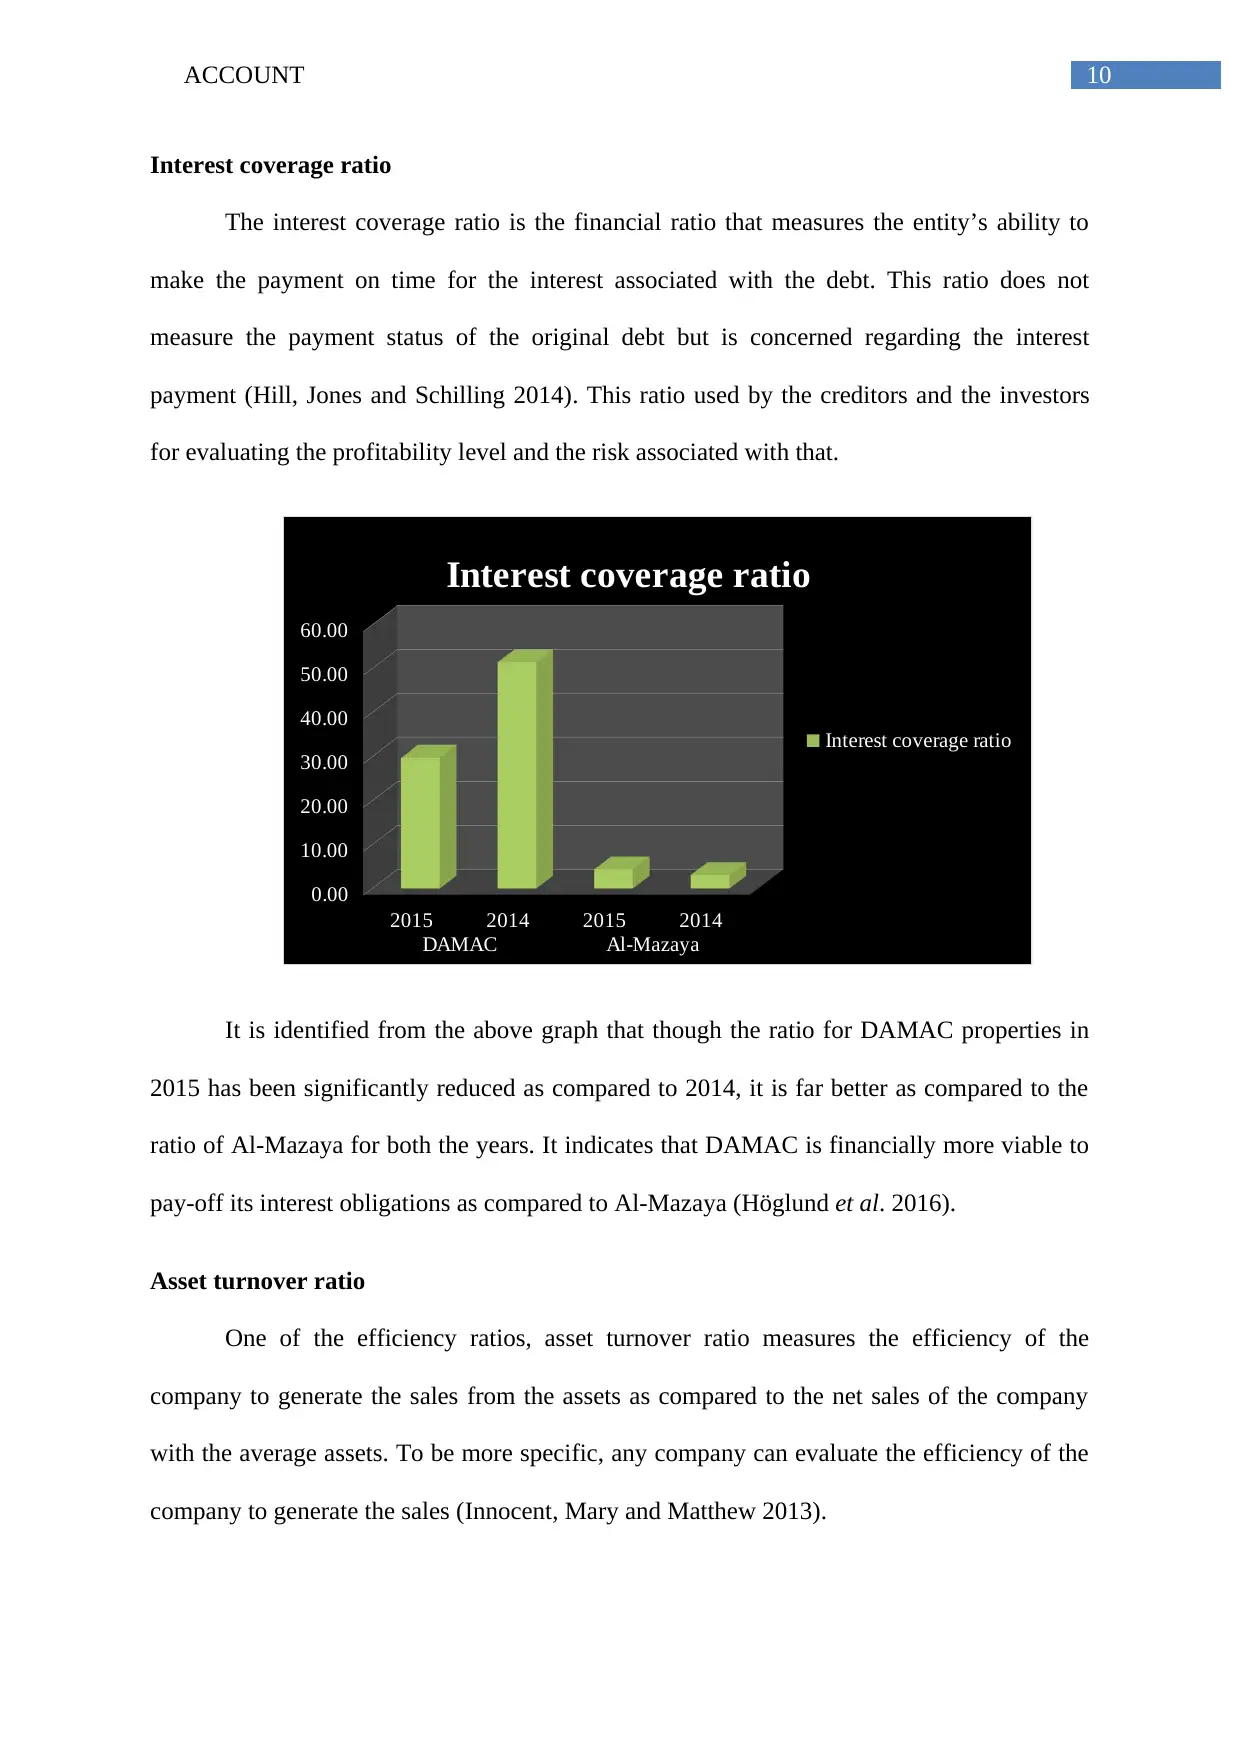
Interest coverage ratio
The interest coverage ratio is the financial ratio that measures the entity’s ability to
make the payment on time for the interest associated with the debt. This ratio does not
measure the payment status of the original debt but is concerned regarding the interest
payment (Hill, Jones and Schilling 2014). This ratio used by the creditors and the investors
for evaluating the profitability level and the risk associated with that.
2015 2014 2015 2014
DAMAC Al-Mazaya
0.00
10.00
20.00
30.00
40.00
50.00
60.00
Interest coverage ratio
Interest coverage ratio
It is identified from the above graph that though the ratio for DAMAC properties in
2015 has been significantly reduced as compared to 2014, it is far better as compared to the
ratio of Al-Mazaya for both the years. It indicates that DAMAC is financially more viable to
pay-off its interest obligations as compared to Al-Mazaya (Höglund et al. 2016).
Asset turnover ratio
One of the efficiency ratios, asset turnover ratio measures the efficiency of the
company to generate the sales from the assets as compared to the net sales of the company
with the average assets. To be more specific, any company can evaluate the efficiency of the
company to generate the sales (Innocent, Mary and Matthew 2013).
Interest coverage ratio
The interest coverage ratio is the financial ratio that measures the entity’s ability to
make the payment on time for the interest associated with the debt. This ratio does not
measure the payment status of the original debt but is concerned regarding the interest
payment (Hill, Jones and Schilling 2014). This ratio used by the creditors and the investors
for evaluating the profitability level and the risk associated with that.
2015 2014 2015 2014
DAMAC Al-Mazaya
0.00
10.00
20.00
30.00
40.00
50.00
60.00
Interest coverage ratio
Interest coverage ratio
It is identified from the above graph that though the ratio for DAMAC properties in
2015 has been significantly reduced as compared to 2014, it is far better as compared to the
ratio of Al-Mazaya for both the years. It indicates that DAMAC is financially more viable to
pay-off its interest obligations as compared to Al-Mazaya (Höglund et al. 2016).
Asset turnover ratio
One of the efficiency ratios, asset turnover ratio measures the efficiency of the
company to generate the sales from the assets as compared to the net sales of the company
with the average assets. To be more specific, any company can evaluate the efficiency of the
company to generate the sales (Innocent, Mary and Matthew 2013).
11ACCOUNT
2015 2014 2015 2014
DAMAC Al-Mazaya
0.00
0.10
0.20
0.30
0.40
0.50
0.60
Asset turnover ratio
Asset turnover ratio
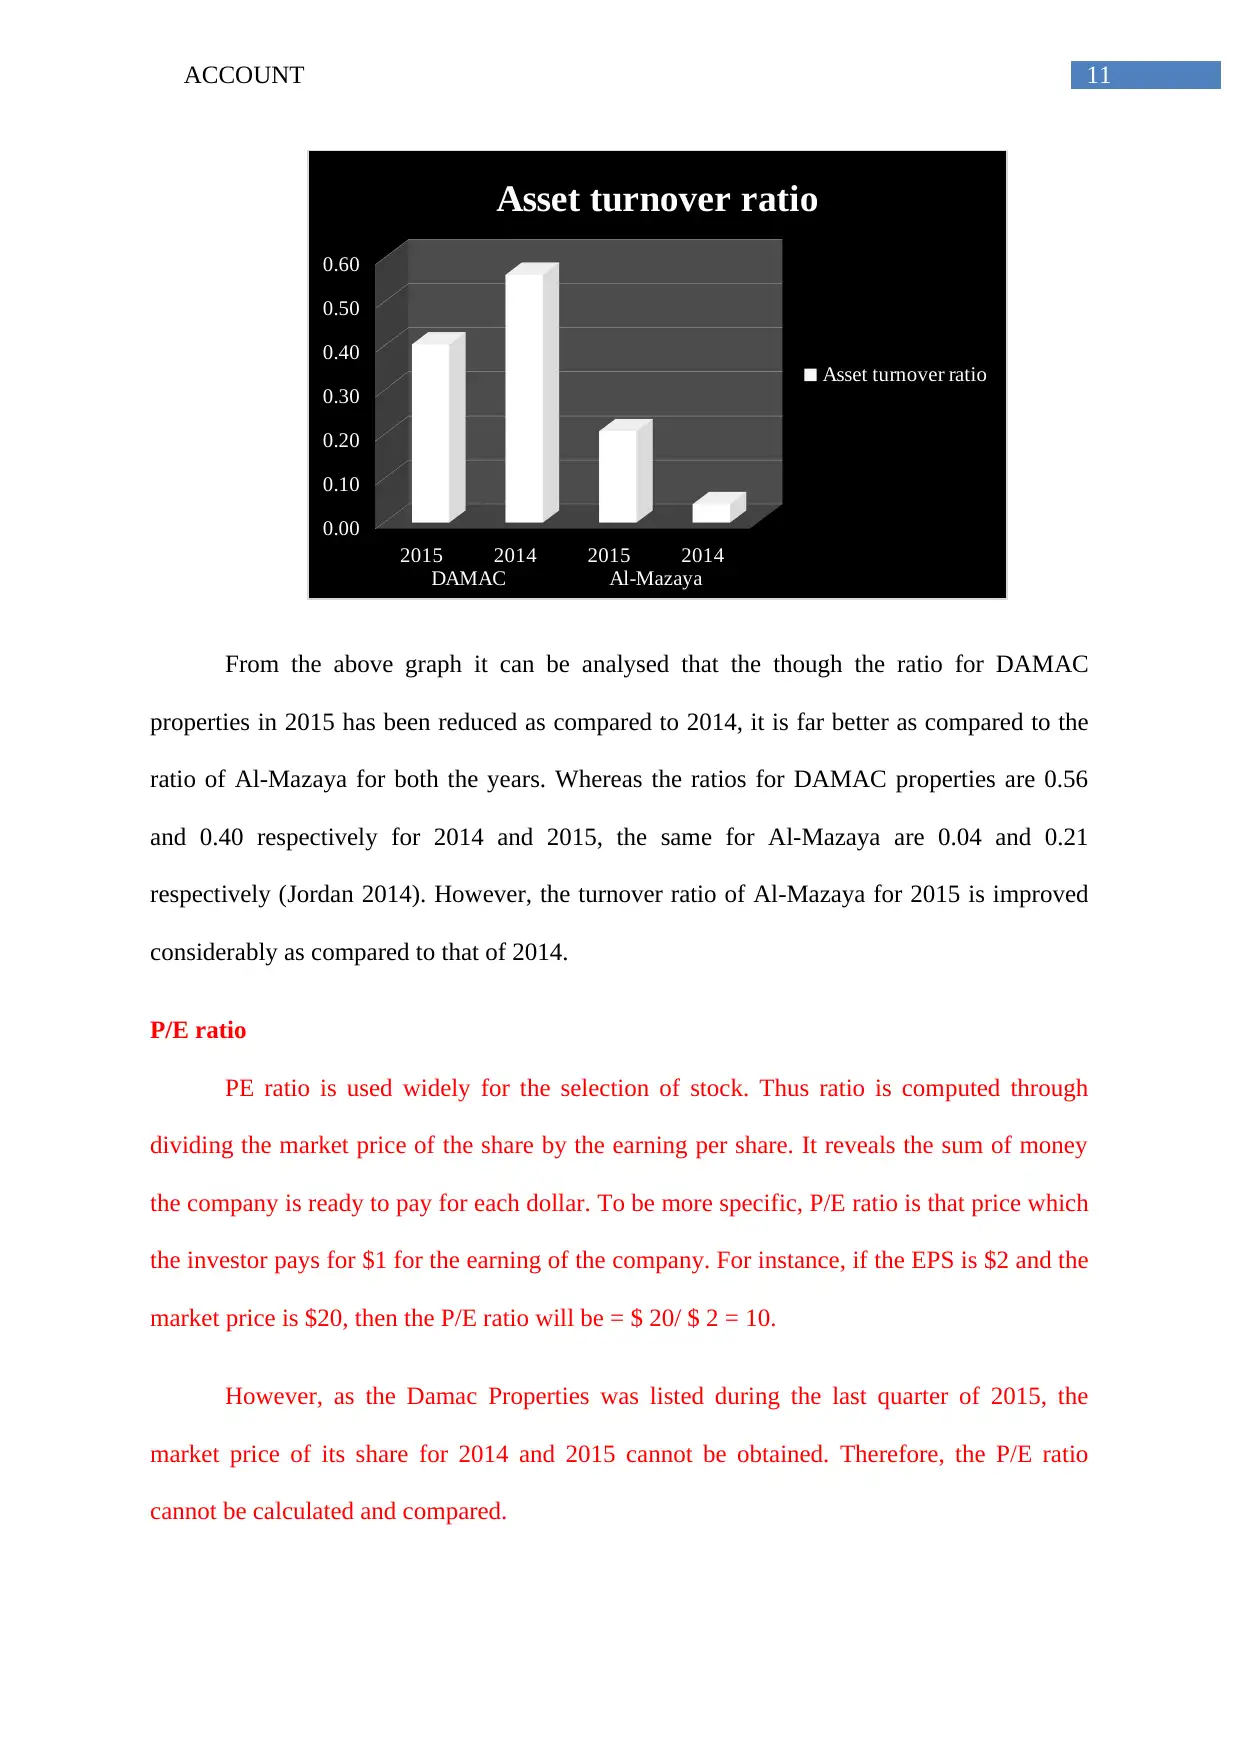
From the above graph it can be analysed that the though the ratio for DAMAC
properties in 2015 has been reduced as compared to 2014, it is far better as compared to the
ratio of Al-Mazaya for both the years. Whereas the ratios for DAMAC properties are 0.56
and 0.40 respectively for 2014 and 2015, the same for Al-Mazaya are 0.04 and 0.21
respectively (Jordan 2014). However, the turnover ratio of Al-Mazaya for 2015 is improved
considerably as compared to that of 2014.
P/E ratio
PE ratio is used widely for the selection of stock. Thus ratio is computed through
dividing the market price of the share by the earning per share. It reveals the sum of money
the company is ready to pay for each dollar. To be more specific, P/E ratio is that price which
the investor pays for $1 for the earning of the company. For instance, if the EPS is $2 and the
market price is $20, then the P/E ratio will be = $ 20/ $ 2 = 10.
However, as the Damac Properties was listed during the last quarter of 2015, the
market price of its share for 2014 and 2015 cannot be obtained. Therefore, the P/E ratio
cannot be calculated and compared.
2015 2014 2015 2014
DAMAC Al-Mazaya
0.00
0.10
0.20
0.30
0.40
0.50
0.60
Asset turnover ratio
Asset turnover ratio
From the above graph it can be analysed that the though the ratio for DAMAC
properties in 2015 has been reduced as compared to 2014, it is far better as compared to the
ratio of Al-Mazaya for both the years. Whereas the ratios for DAMAC properties are 0.56
and 0.40 respectively for 2014 and 2015, the same for Al-Mazaya are 0.04 and 0.21
respectively (Jordan 2014). However, the turnover ratio of Al-Mazaya for 2015 is improved
considerably as compared to that of 2014.
P/E ratio
PE ratio is used widely for the selection of stock. Thus ratio is computed through
dividing the market price of the share by the earning per share. It reveals the sum of money
the company is ready to pay for each dollar. To be more specific, P/E ratio is that price which
the investor pays for $1 for the earning of the company. For instance, if the EPS is $2 and the
market price is $20, then the P/E ratio will be = $ 20/ $ 2 = 10.
However, as the Damac Properties was listed during the last quarter of 2015, the
market price of its share for 2014 and 2015 cannot be obtained. Therefore, the P/E ratio
cannot be calculated and compared.
⊘ This is a preview!⊘
Do you want full access?
Subscribe today to unlock all pages.
Trusted by 1+ million students worldwide
1 out of 42

Your All-in-One AI-Powered Toolkit for Academic Success.
+13062052269
info@desklib.com
Available 24*7 on WhatsApp / Email
![[object Object]](/_next/static/media/star-bottom.7253800d.svg)
Unlock your academic potential
Copyright © 2020–2026 A2Z Services. All Rights Reserved. Developed and managed by ZUCOL.